Support and Resistance in Forex Trading | Definition & Strategies
Support and resistance levels play a crucial role in the world of trading, particularly in forex markets. These levels represent areas on a price chart where buyers and sellers interact, shaping market dynamics. Understanding how support and resistance levels affect the market is essential for traders to make informed decisions and maximize their trading opportunities. This article will delve into the significance of support and resistance levels, how to identify and draw them correctly, strategies to trade them effectively, and methods to filter out false signals. By gaining a comprehensive understanding of these concepts, traders can enhance their trading skills and potentially improve their profitability.
Understanding Support and Resistance Levels
Support and resistance levels are key price clusters where buyers compete with sellers.
A support level is a price point where demand is strong enough to stop the further decline in the value of an asset. It is logical to assume that as the price goes down to the support level, the number of buyers increases and the number of sellers decreases (the volume of buying increases and the volume of selling decreases).
When the price drops to the support line, it is very likely to bounce back up from it, as the line defines a strong psychological low in the market.
"Support" seems to support the price, assisting it from continuing to go down.
Support and resistance levels are never clearly drawn. The price can reach this level with a small deviation, then not reaching it, or going below the line, but just a little.
If the price breaks through the support line and goes down, it turns into resistance.
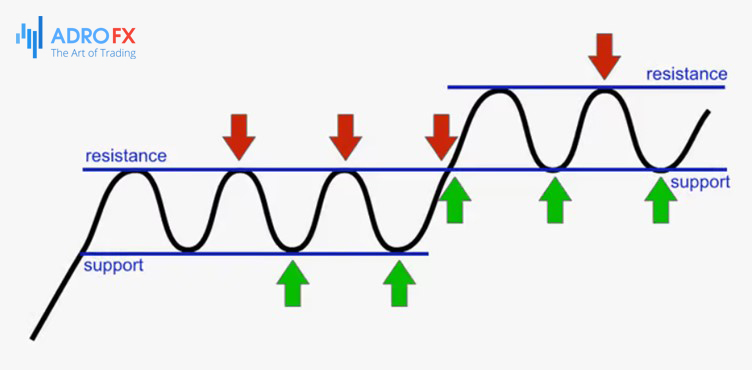
Resistance levels are the opposite of support. These marks appear when supply becomes equal to demand. The logic here is that as the resistance level is approached, the volume of buyers decreases, while the volume of sellers gradually increases. At the point where the balance is reached, the price will stop, and further growth will stop.
The resistance level is always above the price. The name also speaks for itself. This mark is as if restraining the price from further growth by resisting it.
How to Draw Support and Resistance Levels
There is much debate about how to draw support and resistance lines correctly:
- Levels are built by at least two extrema, the more points, the stronger the level;
- They are plotted horizontally, not as trend lines;
- Lines are usually plotted on candlestick tails, but it is acceptable to use zones instead of lines.
Let us pay attention to each nuance in detail.
Two extrema minimum
As we know, an extremum is understood as a critical point (minimum or maximum) in the price chart. Two points are necessary to draw any line; the same is true for the level.
Horizontal levels
The level line is drawn only horizontally, as is customary in classical technical analysis. A big misconception is to draw trend lines and channels, calling them support or resistance.
Drawing on candlestick tails and zones
According to the rule, levels are plotted based on candlestick tails, but extrema need not necessarily coincide completely, false breakouts are acceptable. There is such a notion as a support and resistance zone, which means that the level is an area, not an exact line.
To summarize, building support and resistance lines is a creative process, but has some generally accepted norms that must be followed.
How to Trade Based on Support and Resistance Levels
Trading support and resistance levels is popular in forex trading. These levels are areas on a price chart where the price tends to reverse or consolidate, indicating potential buying or selling opportunities. Here are some steps to help you trade support and resistance levels effectively:
- Identify key support and resistance levels: Look for areas on the chart where the price has previously reversed or struggled to break through. These can be determined by analyzing historical price data, such as swing highs and swing lows, trendlines, Fibonacci retracement levels, or horizontal price levels.
- Mark the levels on your chart: Once you've identified the key support and resistance levels, mark them on your chart. This will help you visualize the areas where potential trading opportunities may arise.
- Wait for price reactions: Monitor the price as it approaches the support or resistance levels. Look for signs of a potential reversal or a break of the level. These signs may include candlestick patterns, chart patterns, or indicators signaling a shift in momentum.
- Confirm with additional indicators: While support and resistance levels can be traded on their own, it's often helpful to use additional indicators or tools to confirm your trading decisions. For example, you might use oscillators like the Relative Strength Index (RSI) or the Moving Average Convergence Divergence (MACD) to gauge overbought or oversold conditions.
- Define your entry and exit points: Once you've identified a potential trading opportunity, determine your entry point, Stop Loss level (to protect against excessive losses), and take-profit level (to secure your profits). These levels can be based on technical analysis, such as the distance between the entry point and the nearest support or resistance level.
- Manage your risk: It's crucial to manage your risk properly when trading support and resistance levels. Consider using appropriate position sizing, setting Stop Loss orders, and maintaining a favorable risk-to-reward ratio. This ensures that even if some trades are unsuccessful, your overall trading strategy remains profitable.
- Practice and refine your strategy: Like any trading strategy, mastering support and resistance trading requires practice and experience. Start by testing your approach on a demo account or using backtesting software to evaluate its performance over historical data. Refine your strategy based on your observations and gradually build your confidence.
Remember, trading involves inherent risks, and there are no guaranteed outcomes. It's essential to combine support and resistance levels with proper risk management, patience, and discipline. Additionally, stay updated with market news and events that may impact your trades.
Support and Resistance Trading Strategies
Several trading strategies can be used when trading support and resistance levels. Here are a few common approaches:
Breakout Strategy
This strategy involves trading the breakouts of support and resistance levels. When the price breaks above a resistance level or below a support level, it suggests a potential continuation of the trend. Traders can enter a long position when the price breaks above resistance or a short position when the price breaks below support. Stop Loss orders can be placed below the breakout level to manage risk.
Bounce Strategy
With this strategy, traders look for price bounces off support and resistance levels. When the price approaches a support level, traders can go long and place a Stop Loss order below the support level. Conversely, when the price nears a resistance level, traders can go short and place a Stop Loss order above the resistance level. The expectation is that the price will reverse from these levels, providing profitable trading opportunities.
Range Trading
Range-bound markets occur when the price oscillates between a support and resistance level. Traders can take advantage of this by buying near the support level and selling near the resistance level. This strategy involves identifying the boundaries of the range and using technical indicators, such as oscillators, to gauge overbought and oversold conditions within the range.
Pullback Strategy
In this strategy, traders wait for the price to pull back to a support or resistance level after a breakout. The idea is to enter a trade in the direction of the breakout once the pullback is complete. For example, if the price breaks above a resistance level, traders wait for a pullback to the resistance-turned-support level before entering a long position.
Confluence Strategy
This strategy combines support and resistance levels with other technical indicators or chart patterns to increase the probability of successful trades. Traders look for instances where multiple factors align, such as a support level coinciding with a trendline or a Fibonacci retracement level. This can provide stronger signals for potential trading opportunities.
It's important to note that no strategy is foolproof, and it's crucial to adapt your approach based on market conditions and your trading style. Additionally, practice, backtesting, and maintaining proper risk management are essential to successful trading.
How to Filter False Signals While Trading Support and Resistance Levels?
Filtering false signals while trading support and resistance levels can be challenging, but there are some tips you can use to increase your accuracy.
First of all, you should confirm with multiple indicators since relying on a single indicator or signal can lead to false readings. To increase the reliability of your analysis, consider using multiple indicators that complement each other. For example, you can combine support or resistance levels with trendlines, moving averages, or oscillators like the RSI or Stochastic Oscillator. When multiple indicators align, it can provide stronger confirmation for potential trading opportunities.
Secondly, you can analyze price action. It refers to the movement of the price itself on the chart. By studying how the price behaves around support and resistance levels, you can gain insights into the strength or weakness of those levels. Look for clear and decisive price movements, such as strong breakouts or bounces, accompanied by significant volume. False signals often lack conviction and may exhibit choppy or erratic price action.
The next tip is to consider time frames. Analyzing support and resistance levels across multiple time frames can help you filter out false signals. A support or resistance level that holds on a higher time frame, such as the daily or weekly chart, carries more weight than one on a lower timeframe, such as the hourly chart. Focus on the levels that are significant across multiple time frames, as they are more likely to attract market participants and generate reliable signals.
Also, you can monitor the market context. Indeed, understanding the broader market context can help you avoid false signals. Consider the overall trend, market sentiment, and any significant news or events that could impact the price. If a support or resistance level aligns with the prevailing trend and market sentiment, it increases the likelihood of a valid signal. Conversely, if a level conflicts with the trend or market sentiment, it may be a false signal or a potential reversal point.
Apart from that, be patient and selective. Avoid jumping into trades based on every touch of a support or resistance level. Exercise patience and wait for strong confirmation signals before entering a trade. Look for price rejections, candlestick patterns, or breaks with high volume and momentum. Being selective and waiting for high-quality setups can help you filter out false signals and increase your trading accuracy.
And, of course, use proper risk management. Implementing effective risk management techniques is crucial to mitigate the impact of false signals. Set appropriate Stop Loss orders to limit losses if a trade goes against you. Consider using Trailing Stop to protect profits as the trade moves in your favor. By managing your risk properly, you can protect your trading capital and minimize the impact of false signals on your overall trading performance.
Conclusion
Support and resistance levels have a profound impact on the forex market. They act as price zones where supply and demand imbalances occur, influencing trend reversals, consolidations, breakouts, and market psychology. By correctly identifying and drawing support and resistance levels, traders can locate potential buying and selling opportunities. Implementing various trading strategies, such as breakouts, bounces, range trading, and pullbacks, enables traders to capitalize on these levels. However, it is crucial to filter out false signals by using multiple indicators, analyzing price action, considering time frames and market context, exercising patience, and employing proper risk management techniques. By incorporating these principles into their trading approach, traders can navigate the complexities of support and resistance levels and enhance their trading outcomes.

About AdroFx
Established in 2018, AdroFx is known for its high technology and its ability to deliver high-quality brokerage services in more than 200 countries around the world. AdroFx makes every effort to keep its customers satisfied and to meet all the trading needs of any trader. With the five types of trading accounts, we have all it takes to fit any traders` needs and styles. The company provides access to 115+ trading instruments, including currencies, metals, stocks, and cryptocurrencies, which make it possible to make the most out of trading on the financial markets. Considering all the above, AdroFx is the perfect variant for anyone who doesn't settle for less than the best.
Related Articles


Latest updates
Latest updates


Technical Analysis
Latest updates


