The Vital Role of Support and Resistance in Trading: Unlocking Strategic Success

Support and resistance are cornerstone principles in trading that offer crucial insights into price dynamics and market behavior. These levels act as key indicators, signaling points where an asset's price is likely to either pause or reverse direction. Support refers to the price level where strong demand prevents further declines, while resistance marks the point where selling pressure halts a price rise.
In the realm of technical analysis, which focuses on using historical market data to predict future price movements, understanding support and resistance is essential. Traders rely on these levels to pinpoint optimal trade entry and exit points while also managing risk effectively. By recognizing where the market may reverse or maintain its trajectory, traders can craft more robust strategies.
Decoding Support and Resistance Levels
Support and resistance levels are crucial price points on a chart that traders utilize to forecast future market behavior. Support represents a level where a downtrend is likely to pause, driven by a concentration of buying interest. In other words, it's the price point where demand is strong enough to stop further declines. For instance, if a stock repeatedly drops to $50 and then bounces back, $50 becomes a recognized support level.
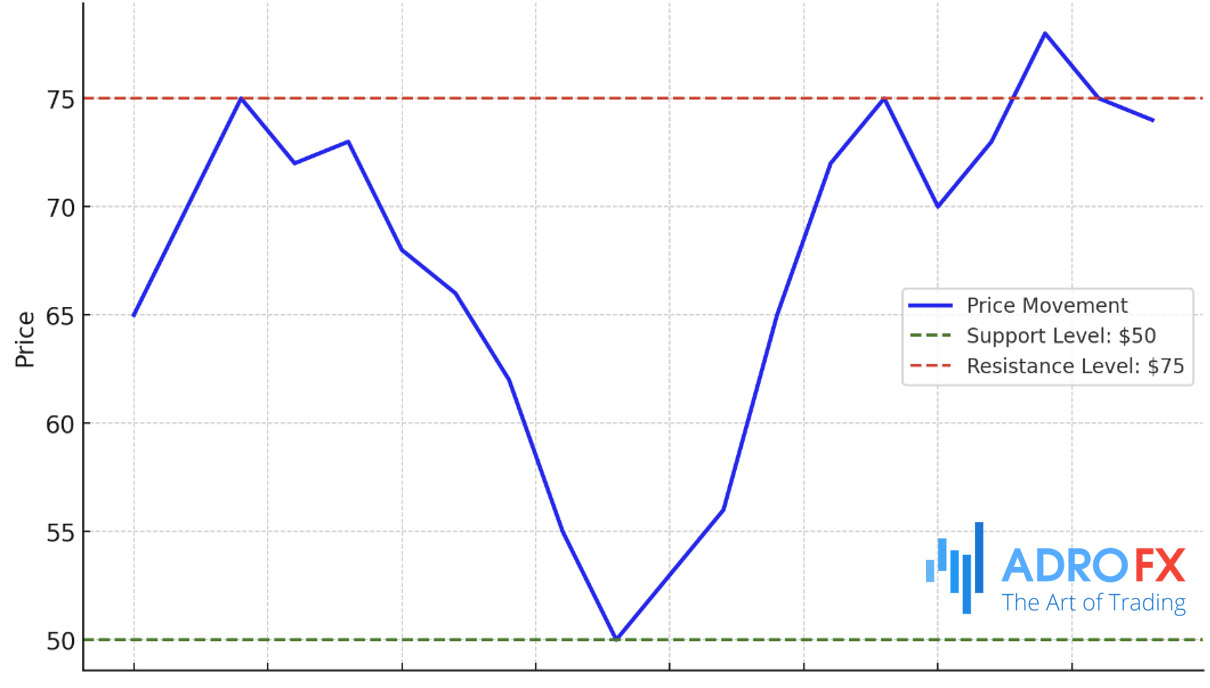
On the flip side, resistance is the price level where an uptrend often halts due to a high volume of sellers. Unlike support, resistance is where selling pressure overpowers buying interest, preventing prices from climbing further. If a stock consistently hits $75 and then retreats, $75 serves as a resistance level.
These levels are significant in technical analysis because they represent psychological thresholds for market participants. When prices approach support, buyers may step in, seeing it as a good entry point. Conversely, when prices near resistance, sellers might take action, expecting the price to struggle moving higher. Understanding how these levels work helps traders refine their timing and make more informed decisions.
The Impact of Support and Resistance in Technical Analysis
Support and resistance are pivotal in technical analysis, guiding traders in interpreting market movements and predicting future price trends. These levels act as psychological barriers that help determine whether a price trend will persist or reverse.
Traders use support and resistance to make more informed decisions by examining how prices behave near these levels. For example, if a stock repeatedly approaches a resistance level but fails to break through, traders may interpret this as strong selling pressure and consider selling or shorting the asset. Conversely, if a price consistently rebounds off a support level, traders might see it as a buying opportunity.
In technical analysis, visual tools like charts and diagrams are indispensable for identifying support and resistance levels. By drawing horizontal lines at points where the price has historically reversed, traders can easily spot critical levels and predict potential market movements. These visual aids enhance decision-making by providing a clear picture of where key price barriers lie.
Also read: Technical Analysis for Beginners: Yes, It Is Possible
The Crucial Role of Support and Resistance Levels in Trading Strategies
Support and resistance levels are the foundation of successful trading strategies, offering traders the tools to optimize entry and exit points, maximize profits, and manage risks effectively.
By pinpointing these key levels, traders can craft strategies that align with market movements while safeguarding their investments. For example, when a price hovers near a support level, a trader might take a long position, anticipating a rise in value. Simultaneously, they could place a Stop Loss just below the support level to limit potential losses if the price unexpectedly drops. Similarly, resistance levels provide invaluable insights for deciding when to exit trades or set profit targets. If a price approaches resistance, it might be wise to close a position to secure gains or prepare for a possible reversal.
Understanding and identifying support and resistance levels also play a vital role in risk management. Setting Stop Loss orders near these levels helps traders protect their capital from significant losses if the market turns against them. This disciplined approach not only enhances profitability but also promotes long-term success in trading.
Different Forms of Support and Resistance
Support and resistance levels come in various forms, each providing unique perspectives on market behavior. The most common types include horizontal levels, trendlines, and moving averages.
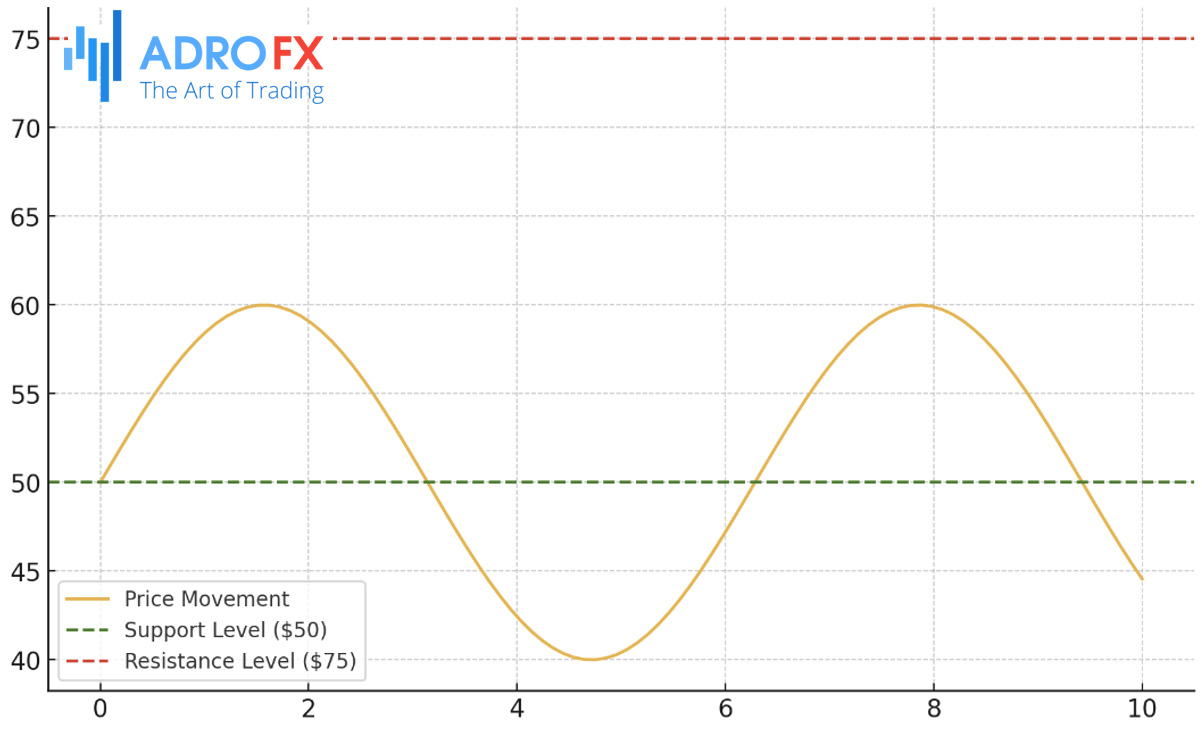
Horizontal Support and Resistance
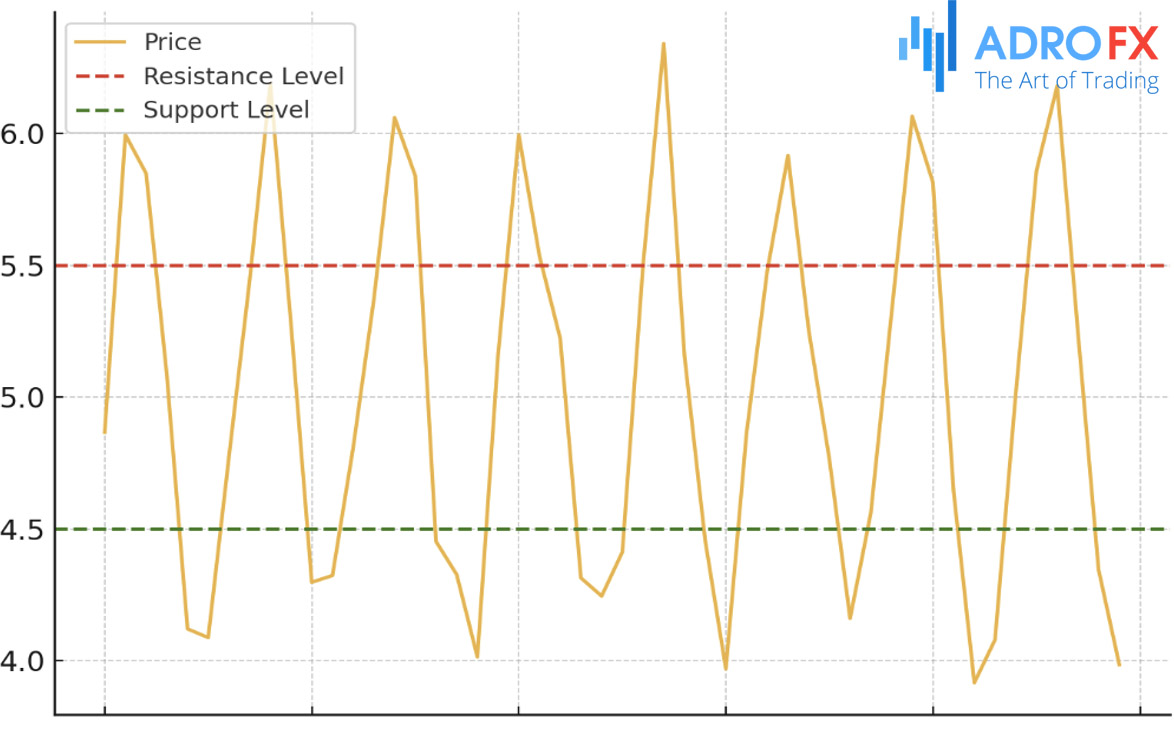
Horizontal levels are straightforward and widely recognized. These levels are drawn at points where the price has consistently reversed in the past. For instance, if a stock repeatedly drops to $50 and then bounces back, $50 would be considered a support level. Likewise, if a price frequently stalls at $75, that level serves as resistance. Traders use these levels as benchmarks for setting entry and exit points, making them essential tools in any trading strategy.
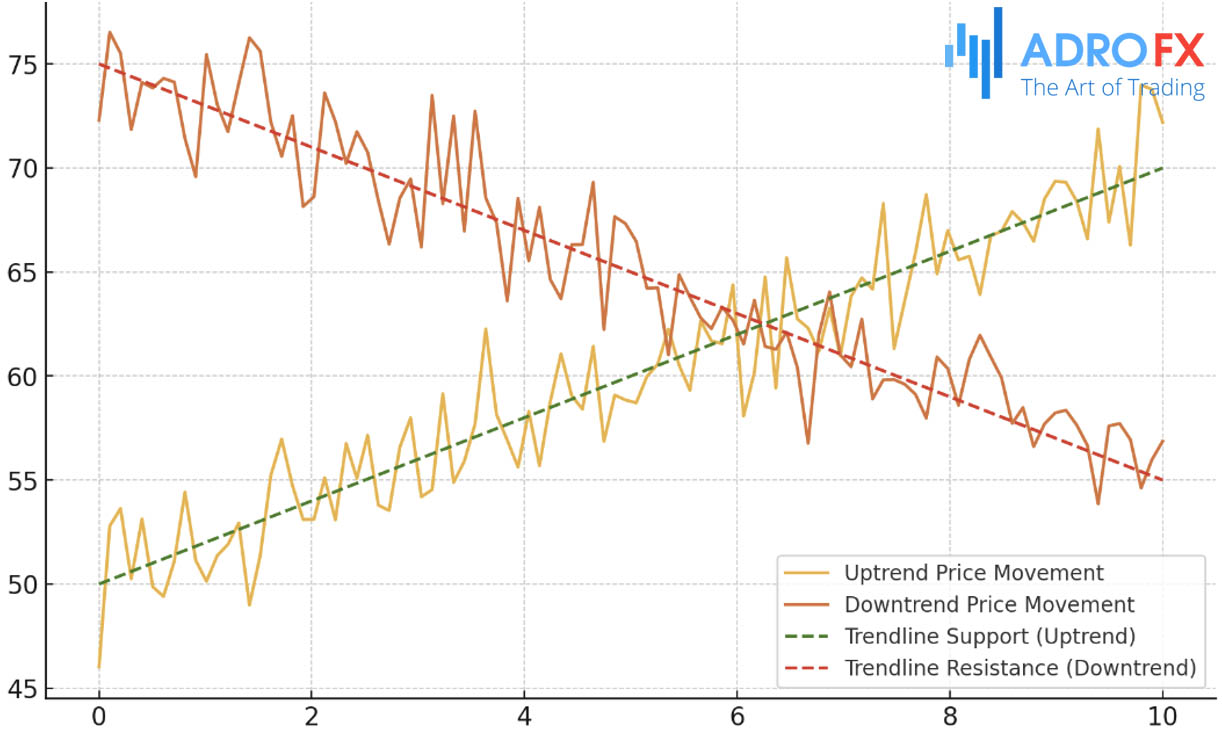
Trendline Support and Resistance
Trendlines connect a series of higher lows in an uptrend or lower highs in a downtrend, acting as dynamic support and resistance. These lines guide traders on the market's overall direction. In an uptrend, for example, the trendline can serve as a support level, signaling buying opportunities. Conversely, in a downtrend, the trendline might act as resistance, where traders look for selling or shorting opportunities.
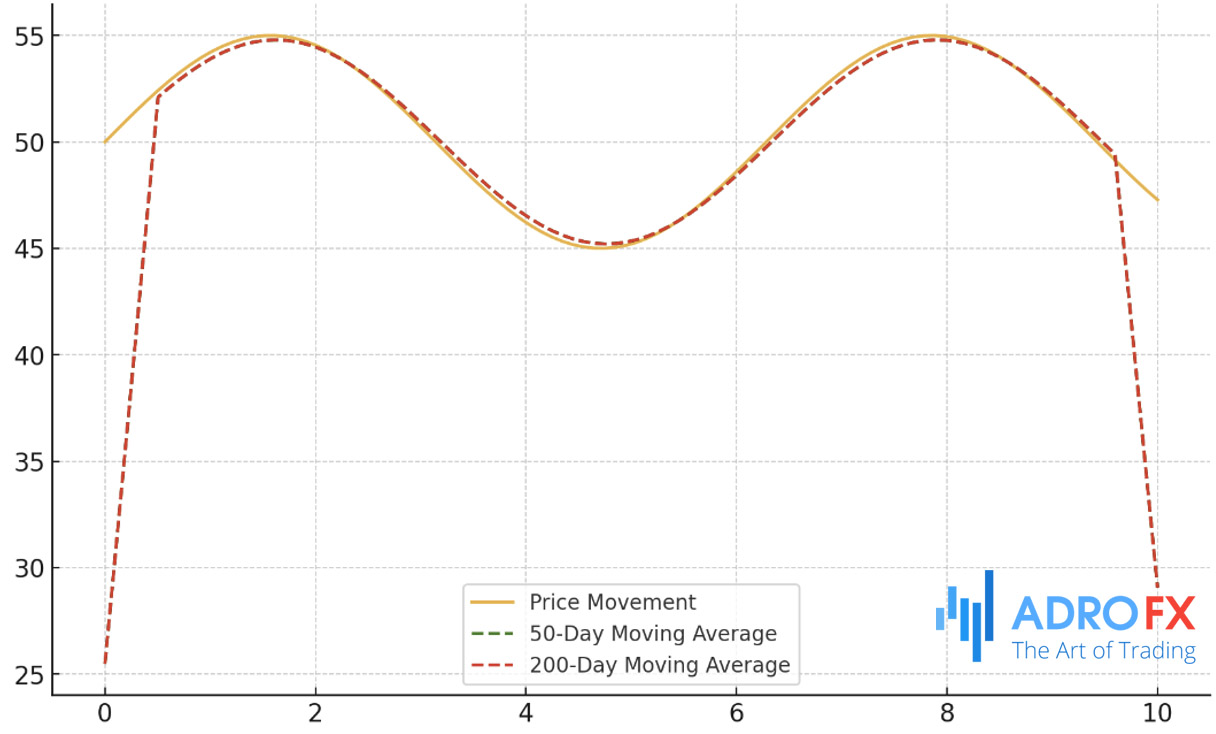
Moving Averages
Moving averages, such as the 50-day or 200-day average, often function as support or resistance levels. Prices tend to respect these levels, bouncing off them during pullbacks in a trend. For instance, if a stock pulls back to its 50-day moving average during an uptrend and then continues its upward trajectory, the moving average acts as a support level.
In practice, combining these different types of support and resistance can significantly enhance trading strategies. For example, if a horizontal support level aligns with a trendline, it strengthens the signal, providing a more reliable entry or exit point for trades.
Also read: Mastering the 50-Day Moving Average and Its Applications
How to Identify Key Support and Resistance Levels
Identifying robust support and resistance zones is a cornerstone of effective trading. To help you pinpoint these critical levels, here are some practical and detailed strategies:
Spot Price Clusters
Look for areas on the chart where the price has consistently reversed direction. These price clusters often signal strong support or resistance zones. For example, if a stock consistently bounces off a particular price level, this indicates a robust support level. Similarly, if it repeatedly fails to break above a certain point, that level may serve as a significant resistance.
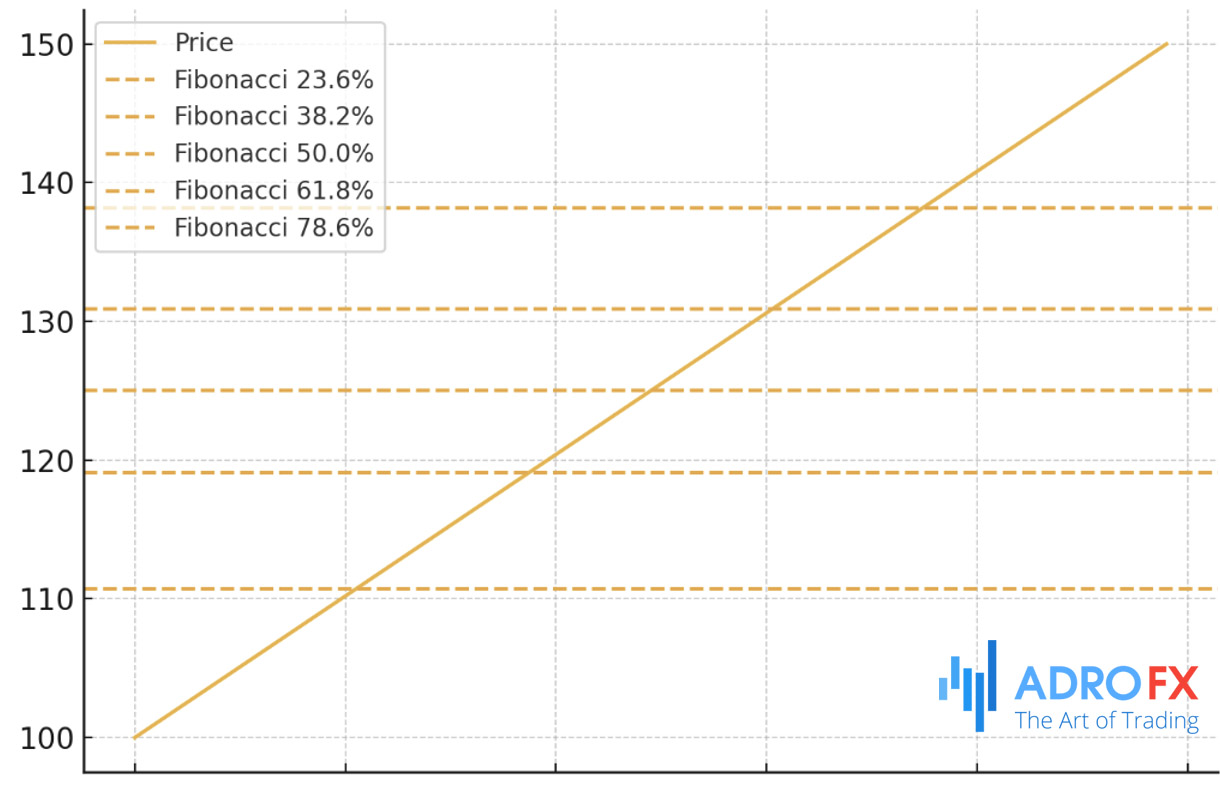
Leverage Technical Indicators
These tools help identify potential reversal levels during pullbacks by dividing a price move into key percentages, such as 38.2%, 50%, and 61.8%. Traders often use these retracement levels to predict where the price might find support or resistance.
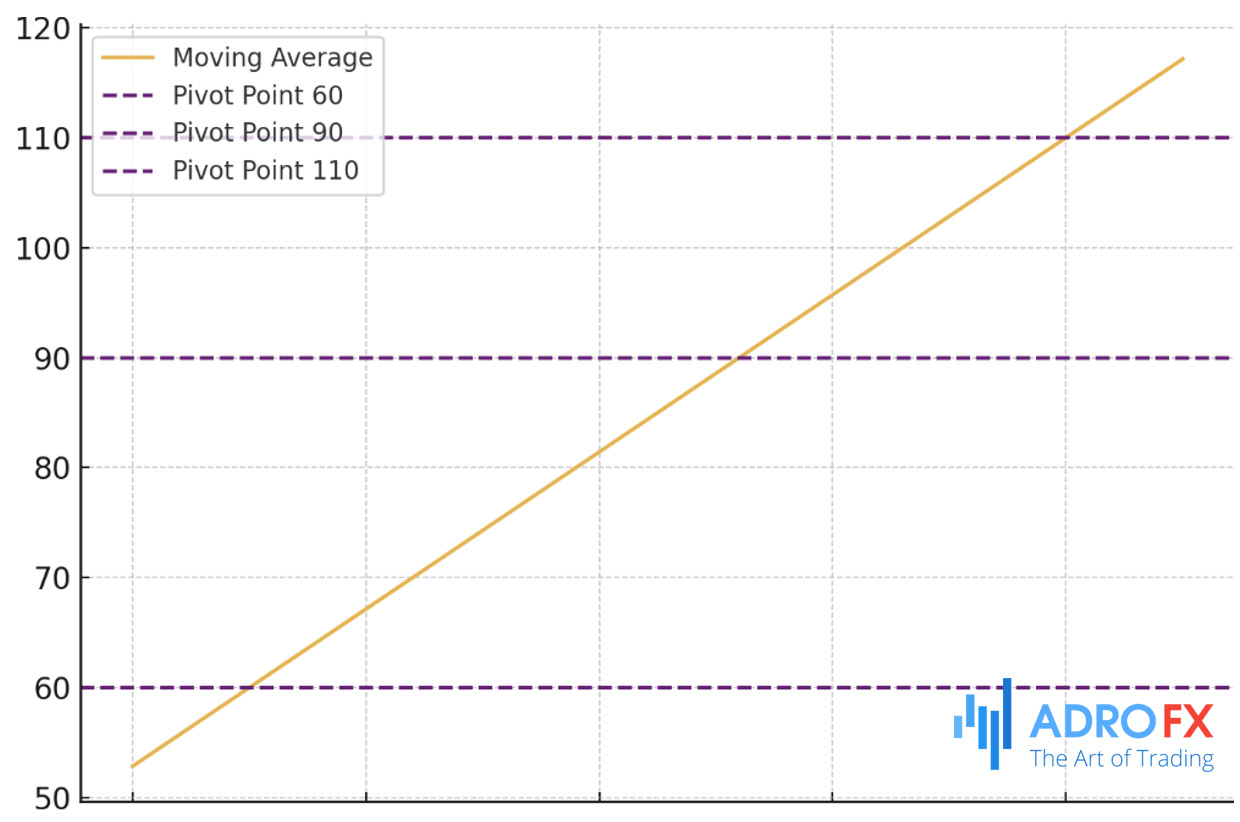
- Pivot Points
Calculated using the high, low, and closing prices from the previous trading session, pivot points can highlight potential support and resistance levels for the current session.
- Moving Averages
Simple moving averages (SMA) and exponential moving averages (EMA) can act as dynamic support and resistance levels. For example, if a stock consistently finds support at its 50-day SMA, that level becomes a key area to watch.
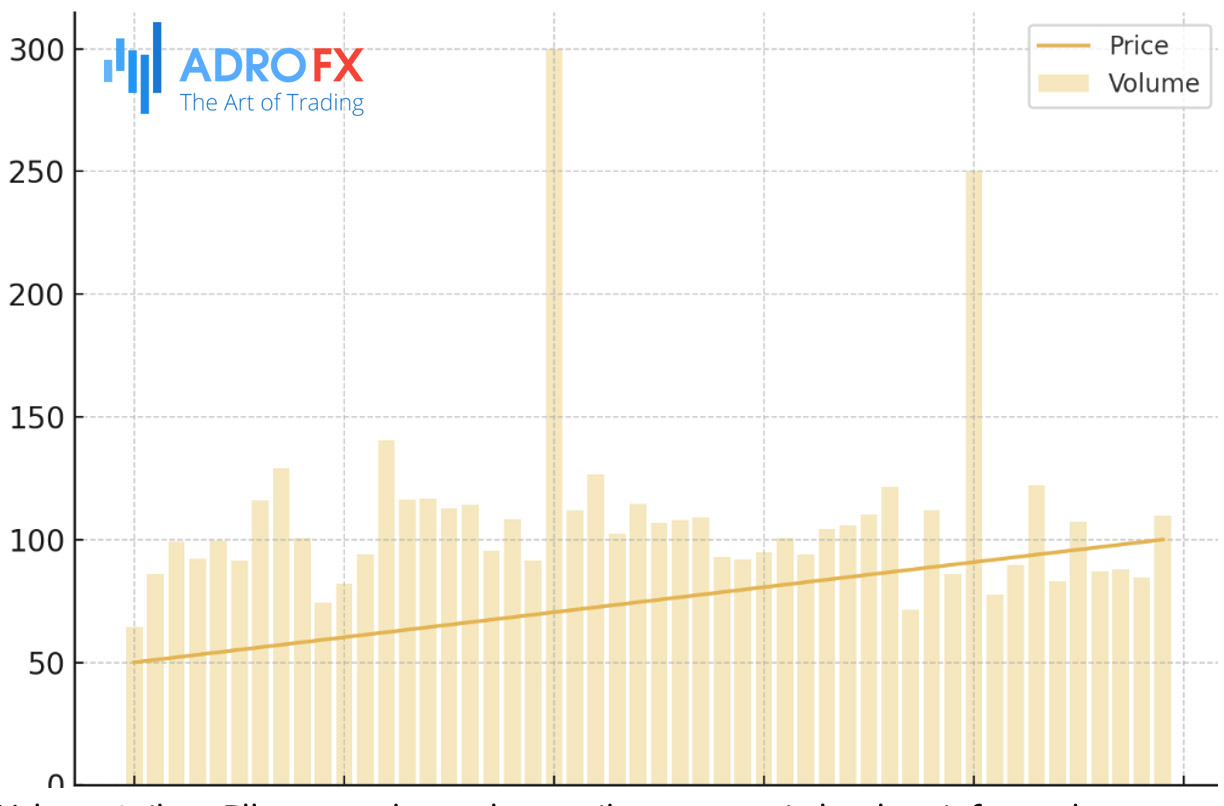
Observe Volume Spikes
Price levels with unusually high trading volume tend to be more significant. When a support or resistance level is accompanied by a spike in volume, it indicates strong market interest. For instance, a resistance level with high volume suggests that many sellers are willing to offload at that price, reinforcing its strength.
Combine with Other Methods
- Fundamental Analysis
It's essential to corroborate your technical findings with other forms of analysis. For instance, a strong support level might coincide with positive earnings reports, industry trends, or macroeconomic factors that suggest a price rebound.
- Market Sentiment and News Events
News events, such as product launches, policy changes, or geopolitical developments, can impact price levels. Aligning your support and resistance analysis with current events can provide additional layers of validation.
By integrating these approaches, you can develop a well-rounded view of the market. This enhanced understanding allows you to better identify crucial support and resistance zones, enabling you to make more informed and strategic trading decisions.
Common Pitfalls When Using Support and Resistance in Trading
Support and resistance are crucial tools in a trader's arsenal, but even seasoned traders can fall into traps when interpreting these levels. Here are some common mistakes and tips on how to avoid them:
Over-Reliance on Exact Numbers
One of the most common errors is viewing support and resistance as fixed, unchanging numbers. In reality, these levels should be seen as zones rather than pinpoint values. For instance, a stock might fluctuate around $50 instead of bouncing exactly at $50. Flexibility is key - consider the broader area around the level rather than sticking rigidly to a specific price.
Ignoring Confirmation Signals
Jumping into a trade the moment the price touches support or resistance without waiting for confirmation can be risky. Always look for signs like a candlestick pattern or a surge in volume to confirm that the level will hold before making your move. This reduces the risk of falling for a "fakeout," where the price briefly breaches a level only to reverse shortly after.
Chasing Breakouts Too Hastily
Breakouts can be lucrative, but rushing in without caution is a common mistake. Not all breakouts lead to sustained trends; some fail quickly, leaving traders at a loss. To avoid this, wait for confirmation - such as increased volume - before jumping into a breakout trade.
Impatience
Patience is a virtue in trading. Many traders force trades at support or resistance levels without the proper setup, leading to poor outcomes. Discipline is essential - stick to your trading plan, and only execute trades when all your criteria are met. Avoid the urge to act prematurely.
By staying mindful of these common errors and exercising patience, traders can make more effective use of support and resistance levels, ultimately improving their trading results.
Advanced Strategies for Support and Resistance Trading
For more experienced traders, support and resistance levels are the foundation for advanced strategies that can be tailored to various market conditions:
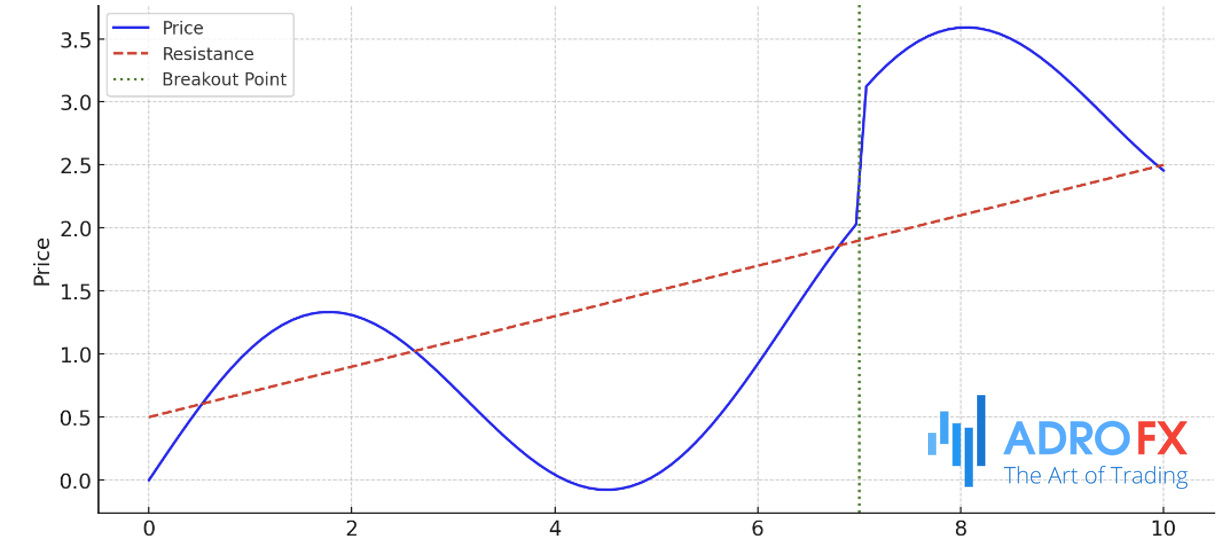
Breakouts
A breakout happens when the price decisively moves above resistance or below support, often signaling the start of a new trend. Traders can capitalize on breakouts by entering positions once the breakout is confirmed. To avoid false breakouts, wait for signs like increased volume and follow-through. Using Stop Loss orders just below or above the breakout point can also help manage risk.
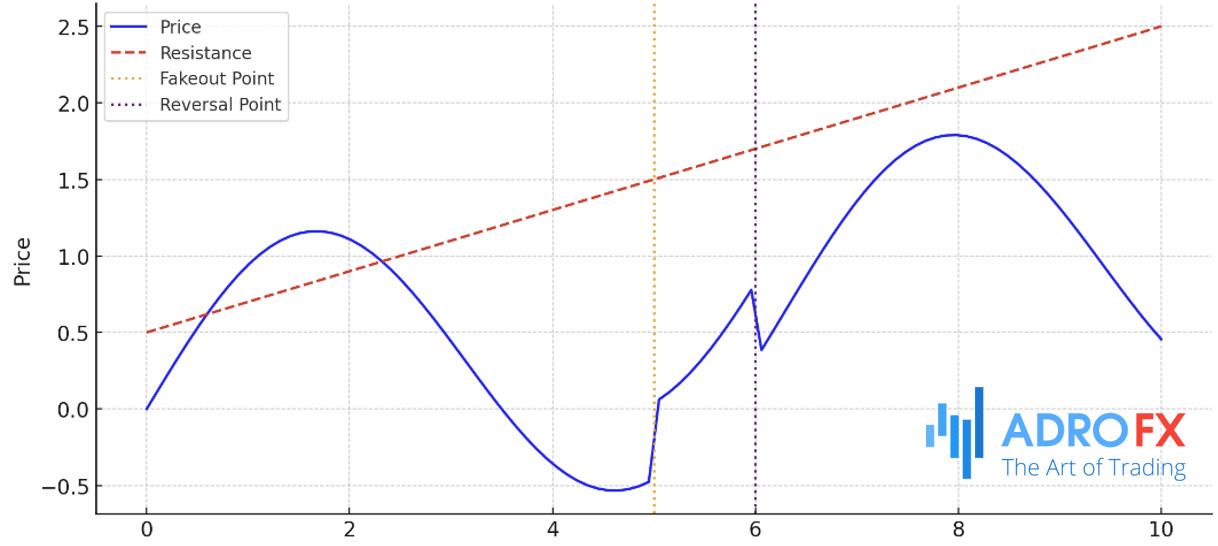
Fakeouts
Occasionally, prices may temporarily breach support or resistance levels before reversing direction - a scenario known as a fakeout. Advanced traders can use fakeouts to their advantage by waiting for the price to return within the range and then taking positions in the opposite direction. For instance, if a stock briefly breaks above resistance but falls back, this could be an opportunity to short the stock.
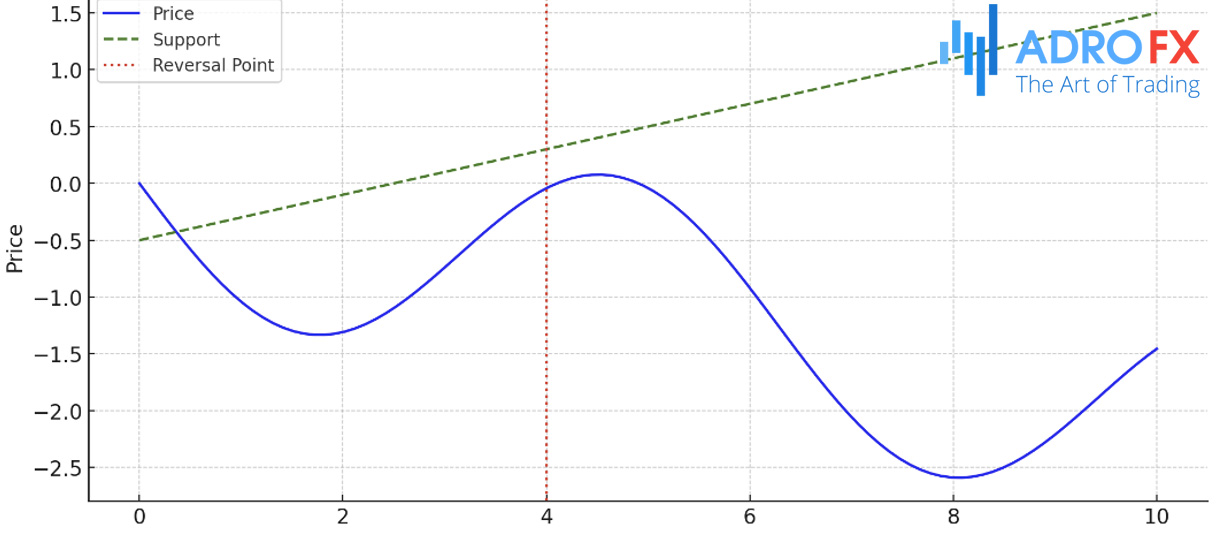
Reversals
Reversal strategies focus on trading when the price changes direction after hitting support or resistance levels. For example, if a stock in a downtrend finds strong support and begins to bounce back, this could indicate the start of a new uptrend. Traders can enter a long position with a Stop Loss just below the support level to capitalize on the reversal.
Combining with Technical Indicators
To enhance decision-making, advanced traders often combine support and resistance strategies with technical indicators like the Relative Strength Index (RSI), Moving Average Convergence Divergence (MACD), or Bollinger Bands. For instance, if a stock is approaching a support level and the RSI signals it’s oversold, it strengthens the case for a potential reversal.
By mastering these advanced strategies and adapting to different market conditions, traders can better navigate the complexities of the market and improve their performance.
Also read: A Deep Dive into 6 Technical Indicators Loved by Professionals for Confident Decision-Making
Conclusion
Mastering support and resistance levels is vital for any trader aiming for long-term success. These concepts are the backbone of technical analysis, guiding traders in making informed decisions about when to enter, exit, and manage risks. By understanding and identifying key support and resistance zones, traders can predict price movements, spot opportunities, and refine their strategies.
Incorporating technical analysis into your trading routine will boost your confidence in navigating the market. Whether you’re a beginner or a seasoned trader, honing your skills with support and resistance can lead to more disciplined and profitable trading.
Ready to elevate your trading game? Put your knowledge of support and resistance to work with AdroFx. Our platform equips you with the tools and insights needed to apply these concepts in real-time market conditions.
Join AdroFx today and start trading with confidence. Whether you're new to trading or looking to refine your strategies, our advanced features and resources are here to help you succeed. Don’t wait - experience the next level of trading with AdroFx now!

About AdroFx
Established in 2018, AdroFx is known for its high technology and its ability to deliver high-quality brokerage services in more than 200 countries around the world. AdroFx makes every effort to keep its customers satisfied and to meet all the trading needs of any trader. With the five types of trading accounts, we have all it takes to fit any traders` needs and styles. The company provides access to 115+ trading instruments, including currencies, metals, stocks, and cryptocurrencies, which make it possible to make the most out of trading on the financial markets. Considering all the above, AdroFx is the perfect variant for anyone who doesn't settle for less than the best.
Related Articles


Latest updates
Latest updates


Technical Analysis
Latest updates


