Mastering the 50-Day Moving Average and Its Applications
Navigating the dynamic realm of financial markets requires a nuanced understanding of various tools and indicators that can provide valuable insights into price trends and potential market movements. Among these tools, the 50-day moving average stands out as a fundamental yet powerful concept. In this article, we delve into the world of the 50-day moving average and its diverse applications in trading and investment strategies. Whether you're a seasoned trader or just embarking on your journey in the world of finance, mastering the intricacies of the 50-day moving average can offer a valuable edge in deciphering market trends and making informed decisions. Join us as we explore the intricacies, benefits, and practical applications of this versatile indicator in today's ever-evolving financial landscape.
What Are Moving Averages?
A moving average is a commonly used statistical calculation in data analysis and time series forecasting. It's a technique that helps smooth out fluctuations and noise in a dataset, making it easier to identify trends and patterns over time.
The basic concept of a moving average involves taking the average of a set of data points within a specified window or interval, and then moving that window along the dataset to calculate averages at different points. This sliding window approach results in a series of average values, which can provide a clearer representation of the underlying trends in the data.
Moving averages are widely used in various fields such as finance, economics, engineering, and data analysis. They are particularly useful for filtering out short-term noise in financial data, identifying trends, and creating indicators for technical analysis. Shorter-term moving averages react more quickly to price changes, while longer-term moving averages provide a smoother view of long-term trends.
Traders and analysts often use crossovers between different moving averages (e.g., the 50-day and 200-day moving averages) as signals for potential trend changes or market entry/exit points. Additionally, moving averages can serve as a foundation for more complex forecasting models and statistical analyses.
Types of Moving Averages
There are several types of moving averages, each with its own characteristics and applications. Here are some of the most common types:
- Simple Moving Average (SMA): This is the basic type of moving average. It calculates the average of a fixed number of data points within a specified time period. Each data point in the window contributes equally to the calculation. SMAs are easy to understand and provide a straightforward representation of trends.
- Exponential Moving Average (EMA): The EMA gives more weight to recent data points compared to older ones. This makes it more responsive to recent price changes and trends. EMAs are commonly used in technical analysis, and they can help traders identify short-term price movements.
- Weighted Moving Average (WMA): In a weighted moving average, different weights are assigned to each data point within the window. The most recent data points usually have higher weights, while older data points have lower weights. This type of moving average aims to provide a balance between the responsiveness of the EMA and the smoothness of the SMA.
- Smoothed Moving Average (SMMA): SMMA is a variation of the simple moving average that applies a smoothing technique to reduce the impact of sudden price changes. It assigns a weight to each data point in the window and calculates the moving average by considering the weighted sum of the data points.
- ● Hull Moving Average (HMA): The Hull Moving Average seeks to reduce lag and noise by using weighted moving averages of different time periods. This results in a smoother moving average that responds more quickly to price changes compared to traditional SMAs or EMAs.
- ● Double Exponential Moving Average (DEMA): DEMA attempts to eliminate lag by applying a double smoothing process to the price data. It combines two exponential moving averages to create a more responsive moving average line.
- ● Triple Exponential Moving Average (TEMA): TEMA further refines the concept of DEMA by applying a triple smoothing process. This type of moving average seeks to provide even more responsiveness and less lag.
- ● Volume Weighted Moving Average (VWMA): VWMA takes into account trading volume in addition to price data. The weights are assigned based on the volume of trades, giving more importance to periods with higher trading activity.
- ● Kaufman's Adaptive Moving Average (KAMA): KAMA adjusts its sensitivity based on market volatility. It aims to provide a moving average that is more responsive during times of high volatility and smoother during periods of low volatility.
These different types of moving averages offer various ways to analyze and interpret data. The choice of which moving average to use depends on the specific goals of analysis, the nature of the data, and the desired balance between responsiveness and smoothness. Traders and analysts often experiment with different types of moving averages to find the one that best suits their needs.

What Is the 50-Day Moving Average?
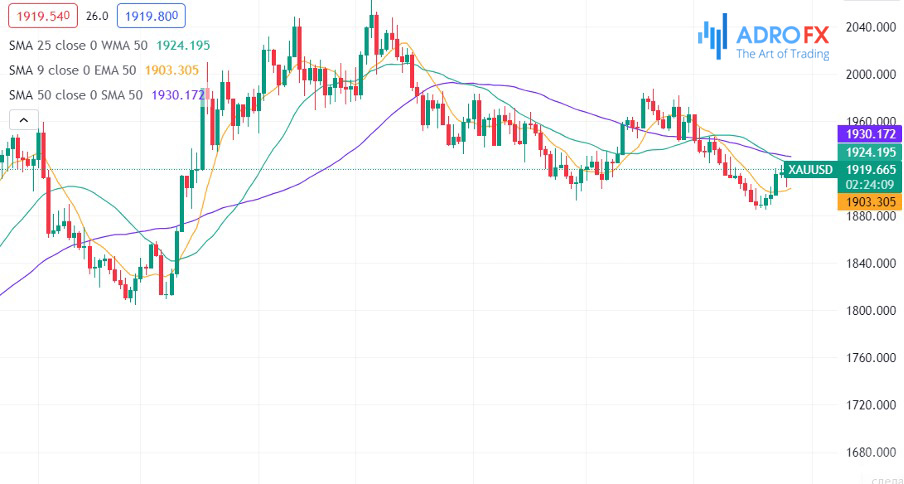
The 50-day moving average (50-day MA) is a specific type of moving average commonly used in technical analysis, especially within the realm of financial markets. It's calculated by taking the average of a security's closing prices over a period of 50 trading days. Each day, the oldest data point is replaced with the most recent day's closing price, and the average is recalculated.
The 50-day moving average is often used as a short- to medium-term trend indicator. Here's how it works:
- Trend Identification: When the current price of a security is above its 50-day moving average, it's often interpreted as an indication of a bullish trend. This suggests that the recent price movement has been generally upward. Conversely, if the price is below the 50-day moving average, it can be seen as a bearish signal, indicating a recent downward price movement.
- Support and Resistance: The 50-day moving average can act as a support level during upward trends and a resistance level during downward trends. When prices approach the 50-day MA from below and find support, it can be seen as a potential buying opportunity. Conversely, when prices approach the 50-day MA from above and face resistance, it can indicate a potential selling opportunity.
- Crossovers: Traders often pay attention to crossovers between the 50-day moving average and longer-term moving averages, such as the 200-day moving average. When the 50-day MA crosses above the 200-day MA, it's known as a "Golden Cross" and can be interpreted as a bullish signal for the overall trend. On the other hand, when the 50-day MA crosses below the 200-day MA, it's called a "Death Cross" and can be seen as a bearish signal.
- Volatility and Momentum: Rapid changes in the price of a security can lead to fluctuations in its 50-day moving average. Sudden price movements can cause the moving average to react quickly, reflecting changes in short-term momentum and volatility.
The choice of the 50-day moving average is somewhat arbitrary and depends on the specific context and time horizon of analysis. Shorter-term moving averages like the 50-day MA respond more quickly to recent price changes, while longer-term moving averages provide a smoother view of longer-term trends. Traders often use the 50-day moving average in combination with other technical indicators and tools to make more informed decisions about trading strategies.

50-Day Moving Average Trading Strategy
The 50-day moving average (50-day MA) trading strategy is a popular approach used by traders to identify trends and potential trading opportunities. This strategy relies on the interaction between the price of an asset and its 50-day moving average. Here's a basic outline of how the strategy works:
1. Identifying the Trend: The first step in the strategy is to determine the direction of the trend. This is usually done by observing whether the price is currently trading above or below the 50-day moving average.
- Bullish Trend: If the price is consistently above the 50-day MA, it's often considered a bullish trend, indicating upward momentum.
- Bearish Trend: If the price is consistently below the 50-day MA, it's often considered a bearish trend, indicating downward momentum.
2. Entry and Exit Signals: The 50-day MA strategy generates entry and exit signals based on crossovers between the price and the moving average. Two common types of crossovers are:
- Golden Cross: This occurs when the price crosses above the 50-day MA, suggesting a potential reversal from a bearish to a bullish trend. Traders often interpret this as a buy signal.
- Death Cross: This occurs when the price crosses below the 50-day MA, suggesting a potential reversal from a bullish to a bearish trend. Traders often interpret this as a sell signal.
3. Setting Stop Loss and Take Profit Levels: To manage risk, traders using this strategy often set Stop Loss and Take Profit levels. A Stop Loss is a predetermined price level at which a trade will be automatically closed to limit potential losses. A Take Profit level is a price target at which a trade will be closed to lock in profits.
4. Risk Management: As with any trading strategy, risk management is crucial. Traders should only risk a small portion of their capital on each trade and avoid overleveraging. Using proper risk-reward ratios and position sizing is essential to long-term success.
5. Backtesting and Analysis: Before using the strategy in live trading, it's important to conduct thorough backtesting on historical data to assess its effectiveness. This helps identify potential strengths and weaknesses of the strategy.
6. Monitoring and Adjustments: Market conditions can change, and strategies may need adjustments over time. Traders should continuously monitor their trades, adapt to changing trends, and refine their strategy as needed.
It's important to note that while the 50-day moving average strategy can be effective, no strategy guarantees profits, and trading involves inherent risks. Traders should consider their risk tolerance, market knowledge, and experience before implementing any trading strategy. Additionally, combining the 50-day MA strategy with other technical indicators or fundamental analysis can provide a more comprehensive approach to decision-making.
Conclusion
In the dynamic world of financial markets, understanding key tools is essential for successful trading. The 50-day moving average is a fundamental concept with wide-ranging applications, providing insights into market trends and aiding decision-making.
Whether you're new to trading or an experienced hand, mastering the 50-day moving average can give you a competitive edge. From identifying trends to spotting entry and exit points, its versatility is evident.
Remember, while the 50-day moving average is a valuable tool, success in trading requires more. Technical analysis, risk management, and market awareness are crucial. By integrating these factors, traders can harness the potential of the 50-day moving average to navigate the complexities of financial markets with greater confidence and precision.

About AdroFx
Established in 2018, AdroFx is known for its high technology and its ability to deliver high-quality brokerage services in more than 200 countries around the world. AdroFx makes every effort to keep its customers satisfied and to meet all the trading needs of any trader. With the five types of trading accounts, we have all it takes to fit any traders` needs and styles. The company provides access to 115+ trading instruments, including currencies, metals, stocks, and cryptocurrencies, which make it possible to make the most out of trading on the financial markets. Considering all the above, AdroFx is the perfect variant for anyone who doesn't settle for less than the best.
Related Articles


Latest updates
Latest updates


Technical Analysis
Latest updates


