Understanding Price Action Patterns: Rails
In addition to the main patterns, which include pin bars and engulfing, there are some secondary patterns. They are somewhat less strong, but they can be found on the charts and if there are strengthening factors, such as support in the form of a level, they can be used as market entry signals. Today we will start with a pattern called Rails.
What Is a Rails Pattern?
The "Rails" pattern is a candlestick analysis pattern that signals the approaching trend reversal or temporary price pullback. This pattern belongs to the Price Action. It is a direction of price movement analysis based on candlestick patterns, strong levels, and other methods of technical analysis. The peculiarity of the Price Action method is that it does not use any indicators or advisors.
To detect this pattern, it is necessary to switch the chart to the Japanese candlesticks display mode. So, what does this pattern look like?
The Rails pattern is represented by two candles of different directions, which follow each other. The length of their bodies should be about the same. The shadows of the candlesticks should be small, no more than 30% of the total length. The points of opening and closing of these candlesticks should be approximately at the same level.
The pattern should consist of two candlesticks, one of which is bullish, and the second - bearish. The appearance of this pattern is reminiscent of the railway tracks, hence the name.
It is very important not to confuse the Rails pattern with an Inside Bar pattern. You can use the Bar Value indicator to find the latter.
The Rails pattern is a reversal pattern, with the order of the candles indicating the direction of the reversal. Let's take a closer look at it:
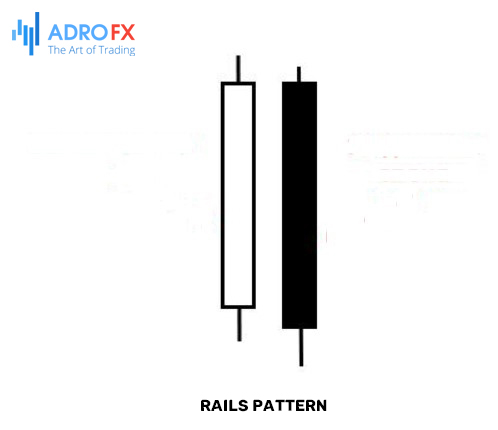
The first candle of the pattern is bullish (white) and the next one is bearish (black). The pattern signals that the price will go down.
The first candle is bearish and the next one is bullish. This pattern is a sign of an upcoming price reversal upwards.
To make it easier to navigate, you should always remember the Rails pattern rule: the direction of the second candle corresponds to the direction of the approaching reversal.
It should be noted that this Price Action pattern is not a strong pattern of technical analysis. For example, one should not judge only by the Rails pattern about the change in the global trend. In this case, it is necessary to look for additional signals of technical analysis or factors that strengthen the influence of this pattern. This pattern is also often used to determine the market movement in stable forex trading systems.
However, Rails may well indicate a change of micro-trends, as well as a slight correction of the price. That is why this pattern is most often used for trading only with pending orders.
Rails Pattern Analogs
Rails patterns can easily be confused with the following reversal candlestick analysis patterns:
Dark Cloud Cover. This pattern indicates that the price will move downwards. It differs from the Rails pattern in that the second candle is always bearish and shifts up a few pips from the previous bullish candle.
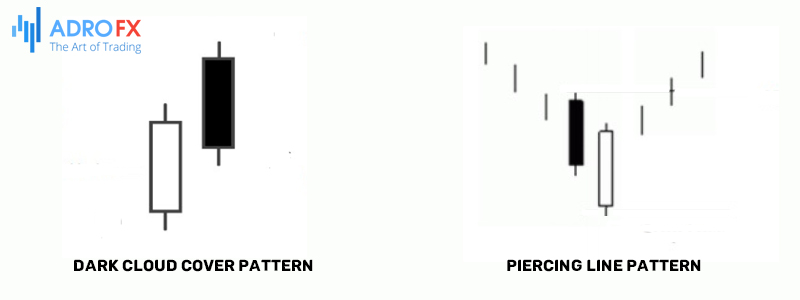
Piercing Line. A pattern, which is the reverse of the previous pattern. In this case, the second candlestick will always be bullish and it will move downwards, relative to the bearish candlestick.
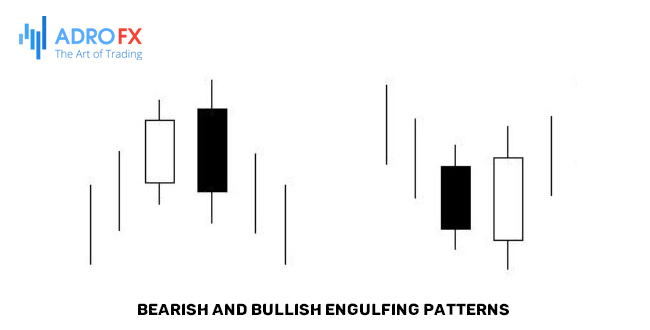
Engulfing (bullish or bearish). This pattern is very similar to Rails and is also a reversal pattern. Its difference is that the second candle must completely absorb the body of the first candle.
However, if you confuse the Rails pattern with one of the above models, no critical error in the forecast will occur.
Rails Pattern: Trading Rules
On its own, this pattern is secondary, that is, its signals alone do not have much weight. Therefore, when searching for an entry point into the market, it is necessary to evaluate the presence of other signals, confirming this reversal pattern. In particular, it is recommended to pay primary attention to the position of Rails relative to strong levels.
Basic trading rules:
- If the pattern was formed within a horizontal price movement (flat), it is not necessary to take it into account. In this case, it doesn't indicate the reversal but just shows us that the forces of bulls and bears are equal and it is still unclear, which of them will pull the market to its side. In such a situation the Rails pattern can be repeated more than once, which speaks of the uncertainty in the market.
- The Rails pattern becomes a strong reversal signal if located near a resistance or support level. In this case, the price will likely reverse, especially if the level has worked itself out more than once.
- The Rails pattern works best when the price correction is over. It means that if the correction is heading toward the end and the last candles on the chart formed this pattern, the price reversal should be expected. The direction of the reversal is determined by the color of the second candle of the pattern.
- If the pattern is formed at the end of a trend movement, then most likely this signal indicates the beginning of price correction. It means that the price will reverse against the trend, but this movement will be short-term (correctional).
- Only pending orders should be used for market entry. The entry point should be set beyond the extremum of the second candle of the pattern. Stop Loss is set at the level of the opposite extremum (for example, if the order is set at the minimum of the second candle, the Stop Loss is set at the level of the maximum, and vice versa).
- Take Profit should be set near the nearest level of resistance or support. Another option is to close the trade manually upon reaching a profit.
Trading Rails pattern usually does not bring excessive profits. However, the advantage of this pattern is that it works out quickly. Therefore, there is no need to keep the position open for several days.
Find Pattern Rails Indicator
Although Rails is one of the simplest candlestick patterns, there is an indicator for finding it on a chart. Since this Price Action pattern is very simple, the indicator will not be difficult to understand.
The settings of the tool:
Shift between the Op and Cl prices. This parameter indicates the difference between the opening and closing prices of the pattern candles. The height of the pattern is taken as one unit.
ATR`s period to calculate CSize. The correlation of candlestick bodies in relation to each other.
All values can be left by default.
The advantage of the indicator is that it finds the Rails pattern on the chart and highlights it with color. It looks something like the figure below.
The tool finds patterns and highlights their candlesticks in a separate color. The indicator draws the level at the close price of the second candle of the pattern. It is this level that we should use as a reference when placing a pending order.
The Find Pattern Rails indicator really facilitates the trader's work, but one should not be completely guided by its signals. The tool simply calculates the ratio between the sizes of candlesticks standing next to each other. When it finds the same size candlesticks, it distinguishes them in a single pattern. The tool doesn't take into consideration:
- The size of candlesticks shadows;
- The size of candlesticks' bodies (the indicator can connect very short candlesticks into a pattern);
- The percentage ratio between the candlesticks' bodies and shadows;
- The direction of price movement before the formation of the pattern.
This way, the tool simply finds the same-sized candlesticks on the chart and joins them into a single pattern. Then the trader has to independently estimate how strong the pattern is and whether it is worth opening a position.
Conclusion
The reversal pattern Rails helps to determine the moment of price pullback, the beginning of the correction, or a change of trend. Usually after it, an impulse spurt of price appears on the chart in the direction of the last candle of the pattern. This impulse, as a rule, is not very strong but still allows making a profit.
It should also be taken into account that the pattern is not included in the set of basic models of Price Action, so it is advisable to use it in combination with other tools of technical analysis. For example, to enter the market only under the condition that the pattern is based on a strong level of support or resistance. Only then you can steadily stay in the black.

About AdroFx
Established in 2018, AdroFx is known for its high technology and its ability to deliver high-quality brokerage services in more than 200 countries around the world. AdroFx makes every effort to keep its customers satisfied and to meet all the trading needs of any trader. With the five types of trading accounts, we have all it takes to fit any traders` needs and styles. The company provides access to 115+ trading instruments, including currencies, metals, stocks, and cryptocurrencies, which make it possible to make the most out of trading on the financial markets. Considering all the above, AdroFx is the perfect variant for anyone who doesn't settle for less than the best.
Related Articles
Latest updates
Latest updates


Technical Analysis
Latest updates


