Learn to Make the Most Out of Reversal Candlestick Patterns: Key Insights and Strategies
Most traders agree that reversal candlestick patterns are paramount tools that traders utilize to recognize potential changes in the current market situation. These patterns become evident as trends approach their peaks or troughs, indicating a possible change in momentum. By identifying these patterns, both seasoned and beginner traders can predict reversals, which are crucial for making strategic decisions that reduce risk and boost profitability. Notable examples of reversal patterns include the hammer, shooting star, bullish engulfing, and dark cloud cover - each presenting important insights into market dynamics.
Understanding Reversal Candlestick Patterns
Reversal candlestick patterns are known as specific formations on price charts that signal a change in market direction. These patterns appear when the momentum of the current trend weakens, suggesting an imminent reversal. Traders depend on these patterns to forecast transitions from bullish to bearish trends or vice versa. By identifying reversal candlestick patterns, traders can strategically position themselves to benefit from upcoming market movements.
Key Characteristics
The primary features of reversal candlestick patterns include:
- Shape and Size
The configuration of the candlestick, encompassing the body and wicks, is crucial in identifying reversal patterns. - Location
These patterns typically manifest at the top or bottom of a trend, indicating a potential change. - Volume
An increase in trading volume usually comes together with these patterns, reinforcing the likelihood of a reversal. - Context
The surrounding candlesticks and overall market conditions also play a role in identifying these patterns.
Also read: Can You Benefit From 1 Single Candlestick?
Common Types of Reversal Candlestick Patterns
Understanding reversal candlestick patterns is crucial for any trader willing to enhance their trading strategy. These patterns are not merely visual indicators on a chart but are critical signals of expected trend reversals, each with unique characteristics and implications. By comprehending the different reversal patterns and their meanings, traders can delve deeper into market trends and enhance their decision-making process. This guide will explore the most common reversal candlestick patterns, divided into bullish and bearish categories, and demonstrate how recognizing these patterns can improve trading accuracy.
Bullish Reversal Patterns
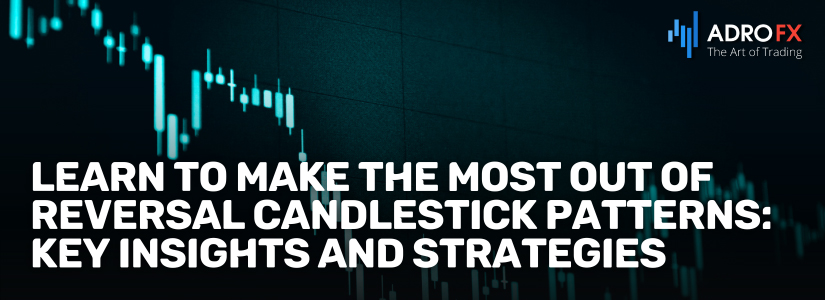
Hammer
At the culmination of a downtrend, the hammer emerges with a compact body near the top and an extended lower shadow. This pattern signifies that, although selling pressure was present, buyers ultimately drove the price upward by the session’s end.
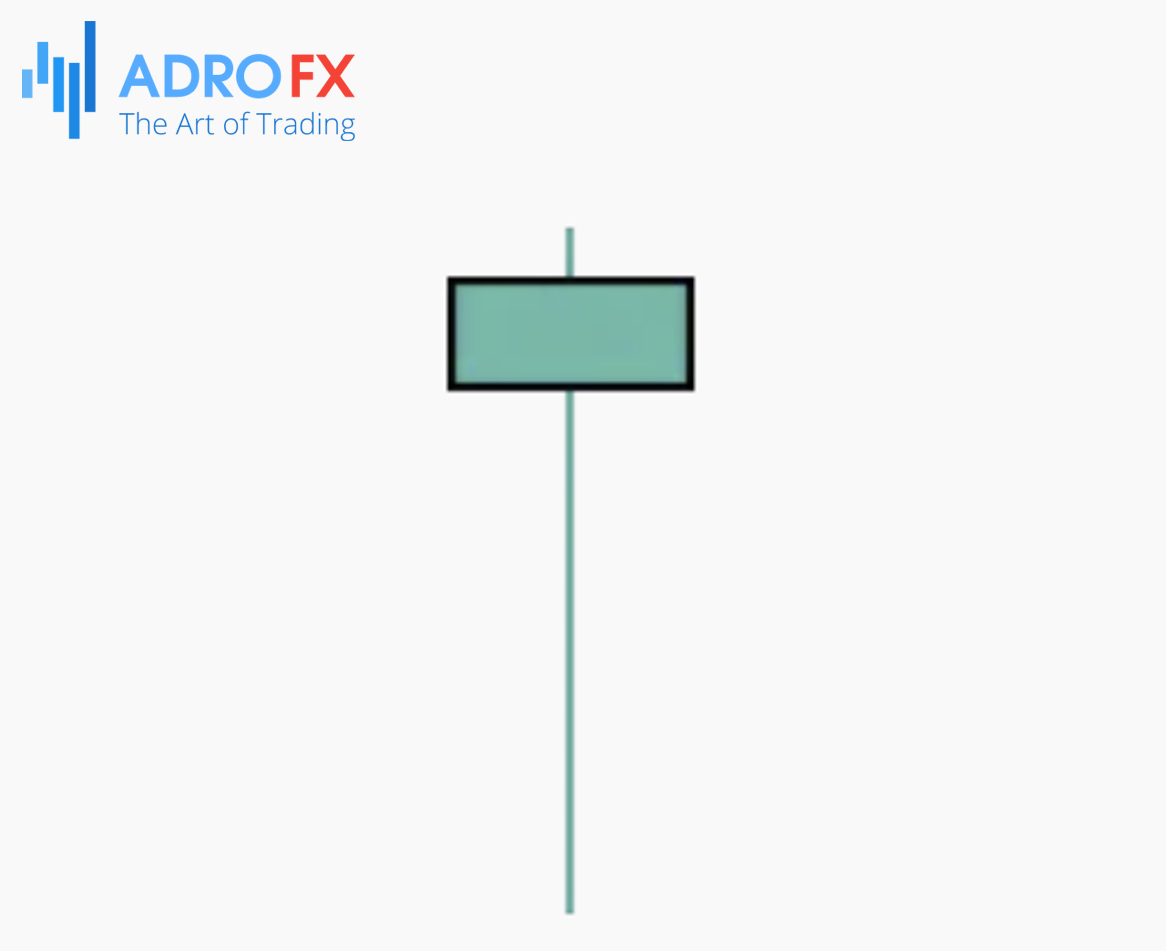
Inverted Hammer
Appearing at the trough of a downtrend, the inverted hammer showcases a small body near the bottom and a long upper shadow. This formation hints at mounting buying pressure, indicating a potential shift in the trend direction.
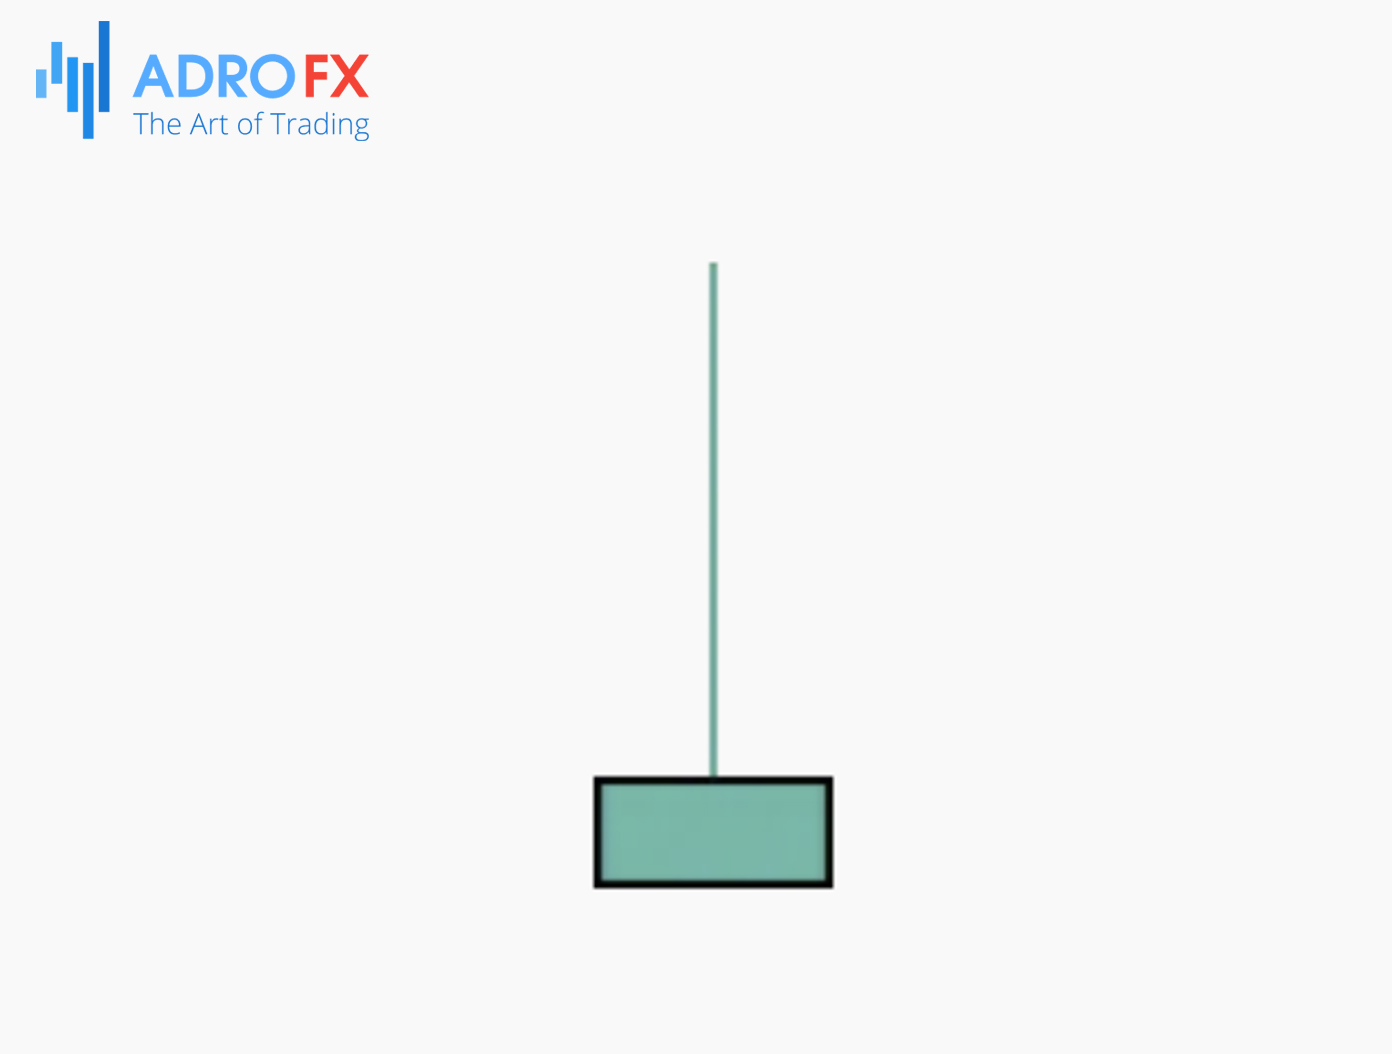
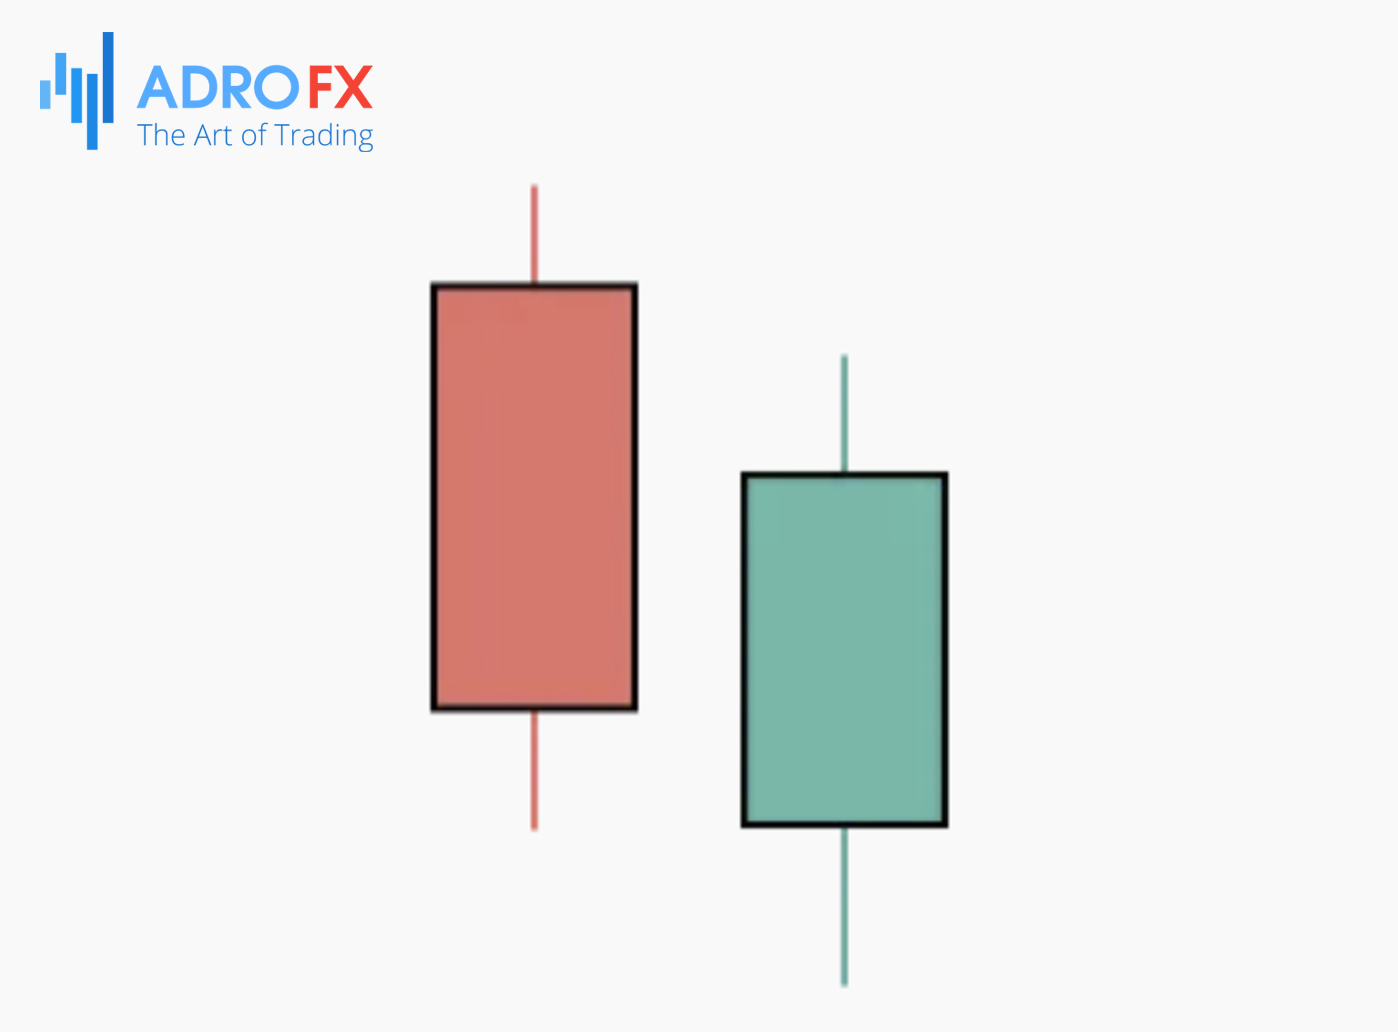
Bullish Engulfing
This two-candle pattern features a small bearish candle followed by a more substantial bullish candle that completely envelops the preceding one. It signals robust buying momentum and suggests a probable move towards an uptrend.
Piercing Line
Characterized by a long bearish candle succeeded by a bullish candle, the piercing line pattern opens below the prior low and closes above its midpoint. This formation suggests a change from selling to buying pressure, hinting at a potential market reversal.
Bearish Reversal Patterns
Shooting Star
Emerging at the apex of an uptrend, the shooting star presents a small body near the bottom and a lengthy upper shadow. This pattern signifies that, despite initial buying efforts, sellers have gained dominance, hinting at a potential market decline.
Hanging Man
Resembling the hammer but occurring at the peak of an uptrend, the hanging man presents a small body at the top with an extended lower shadow. This formation indicates growing selling pressure and suggests a possible reversal of the current trend.
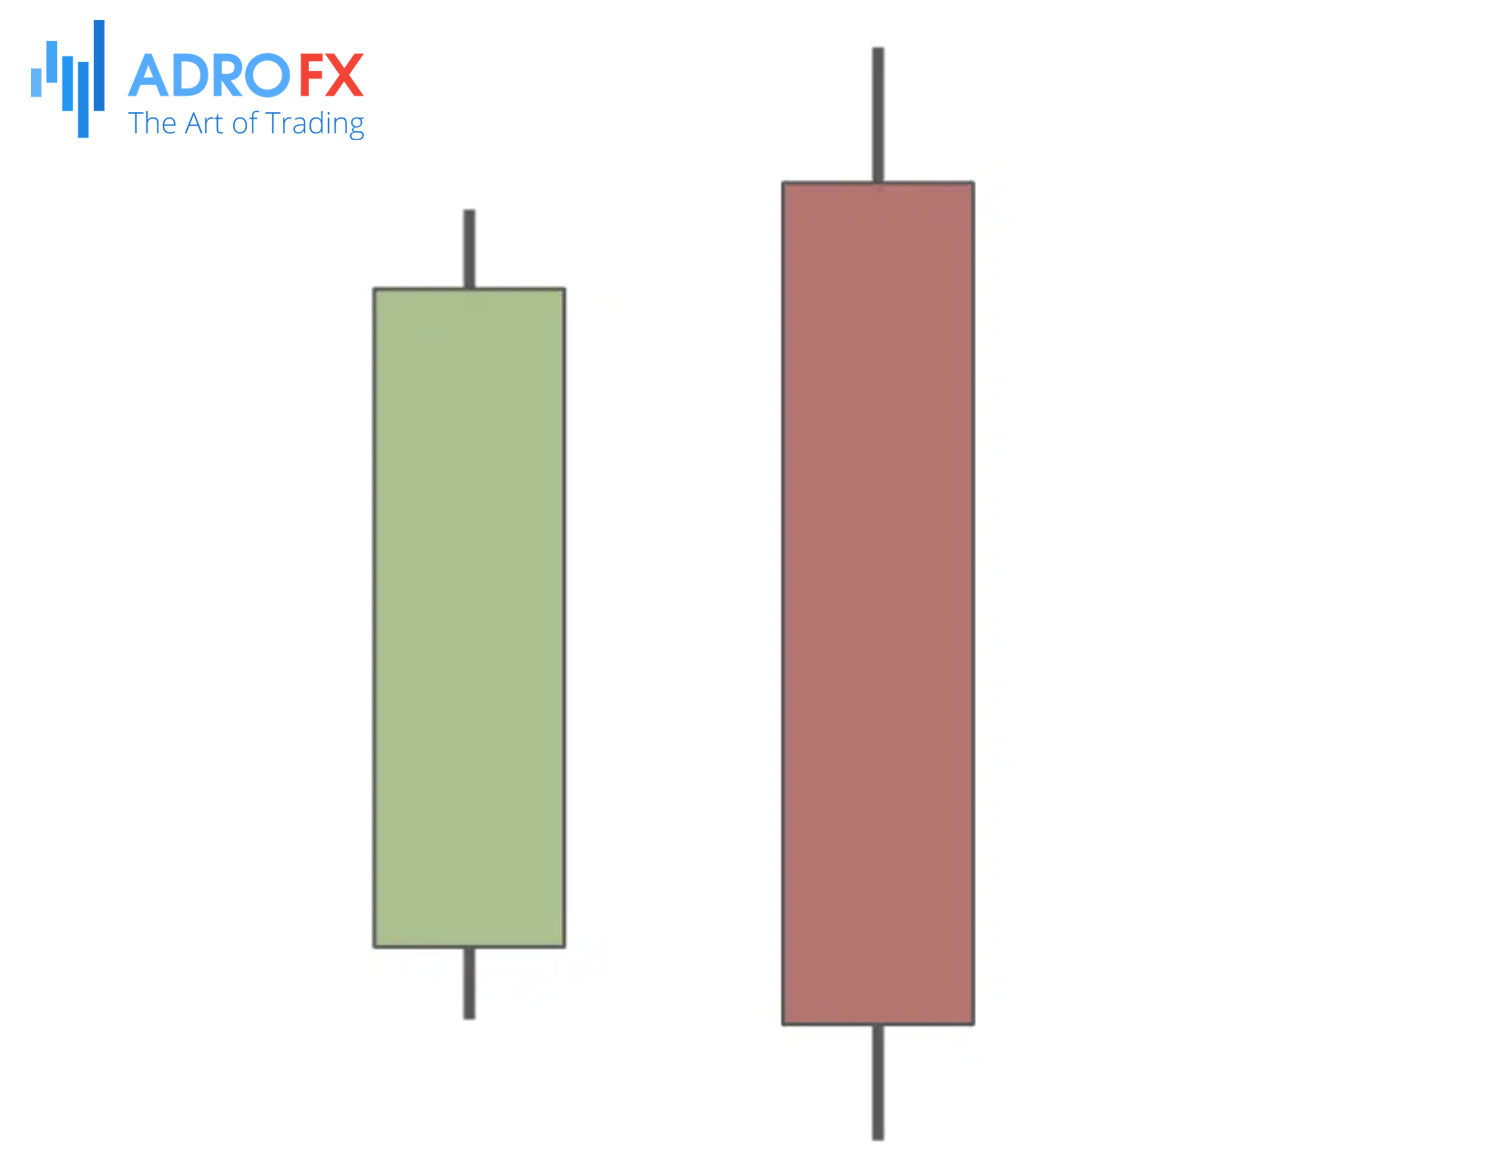
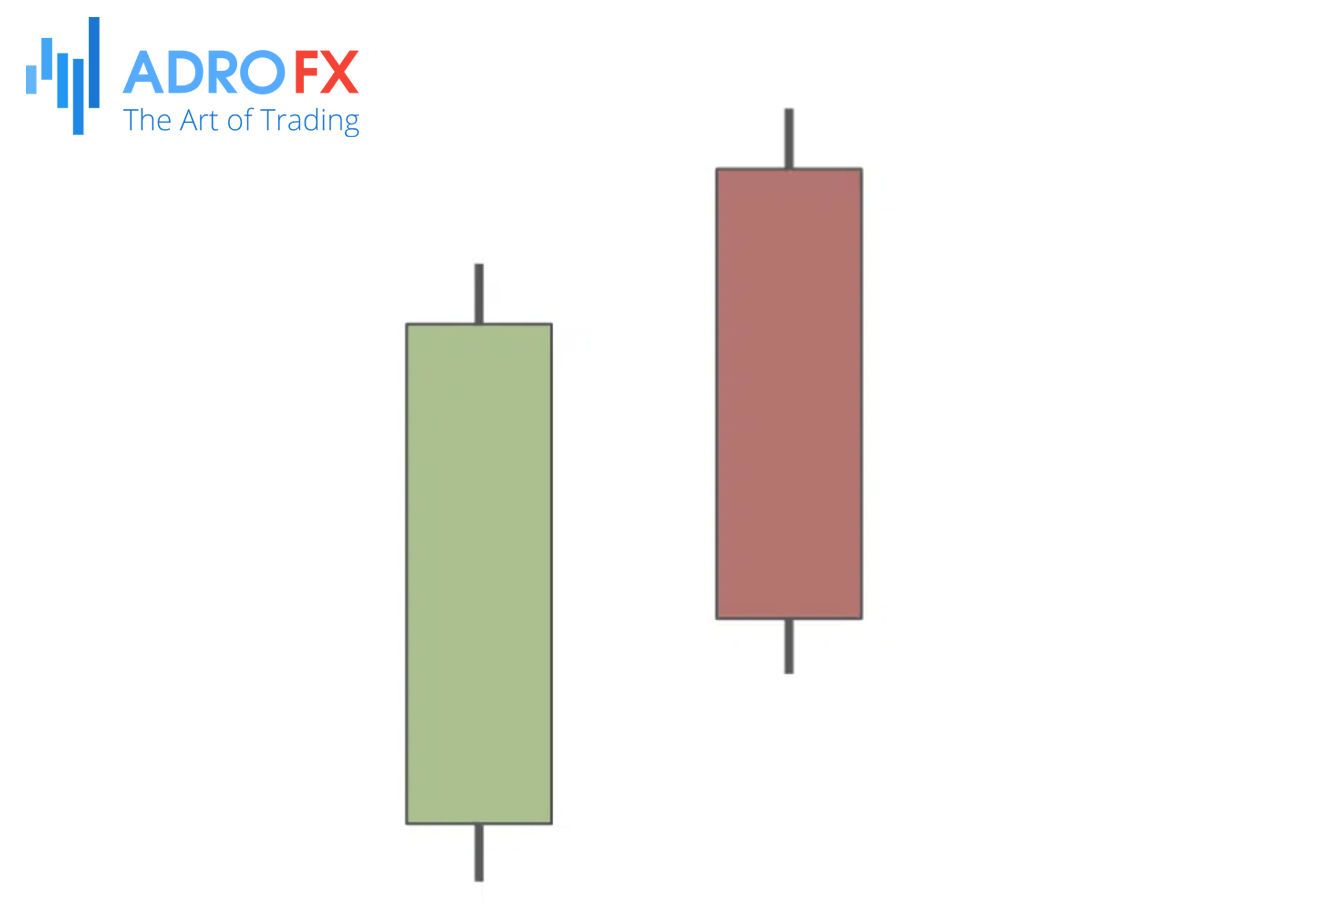
Bearish Engulfing
This two-candle pattern forms when a small bullish candle is overshadowed by a larger bearish candle that completely envelops it. It signals strong selling activity and the likelihood of a downward trend.
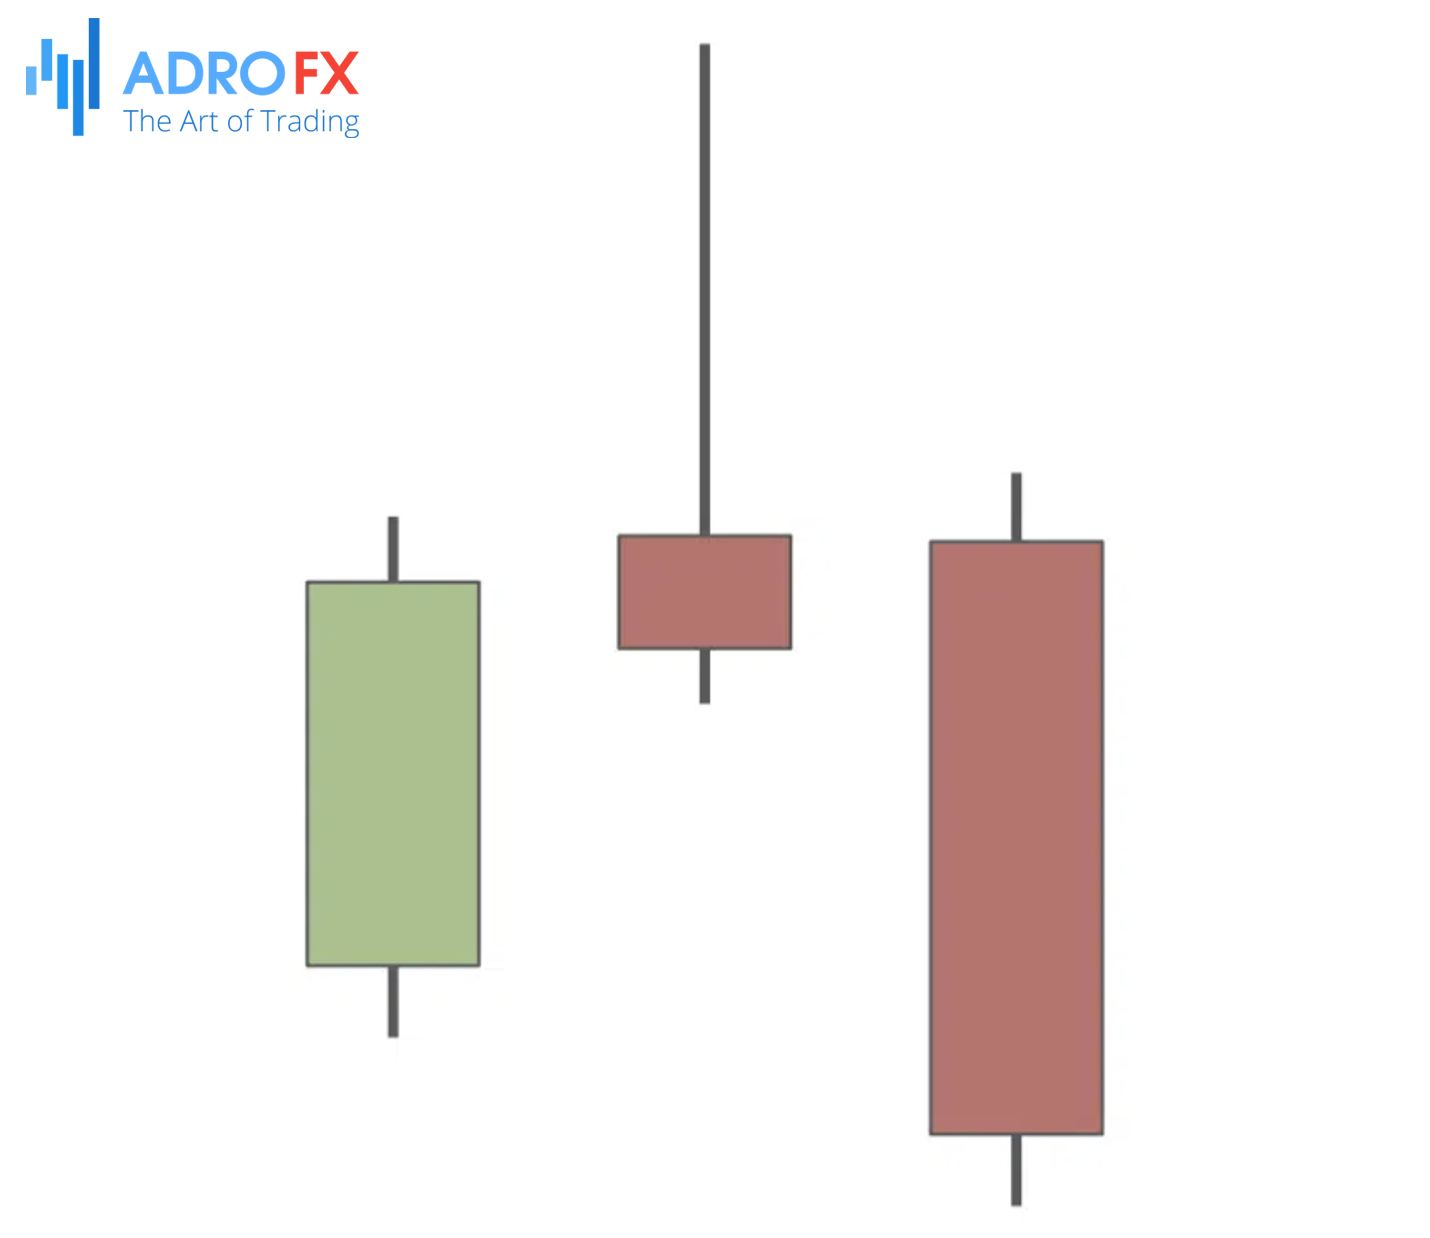
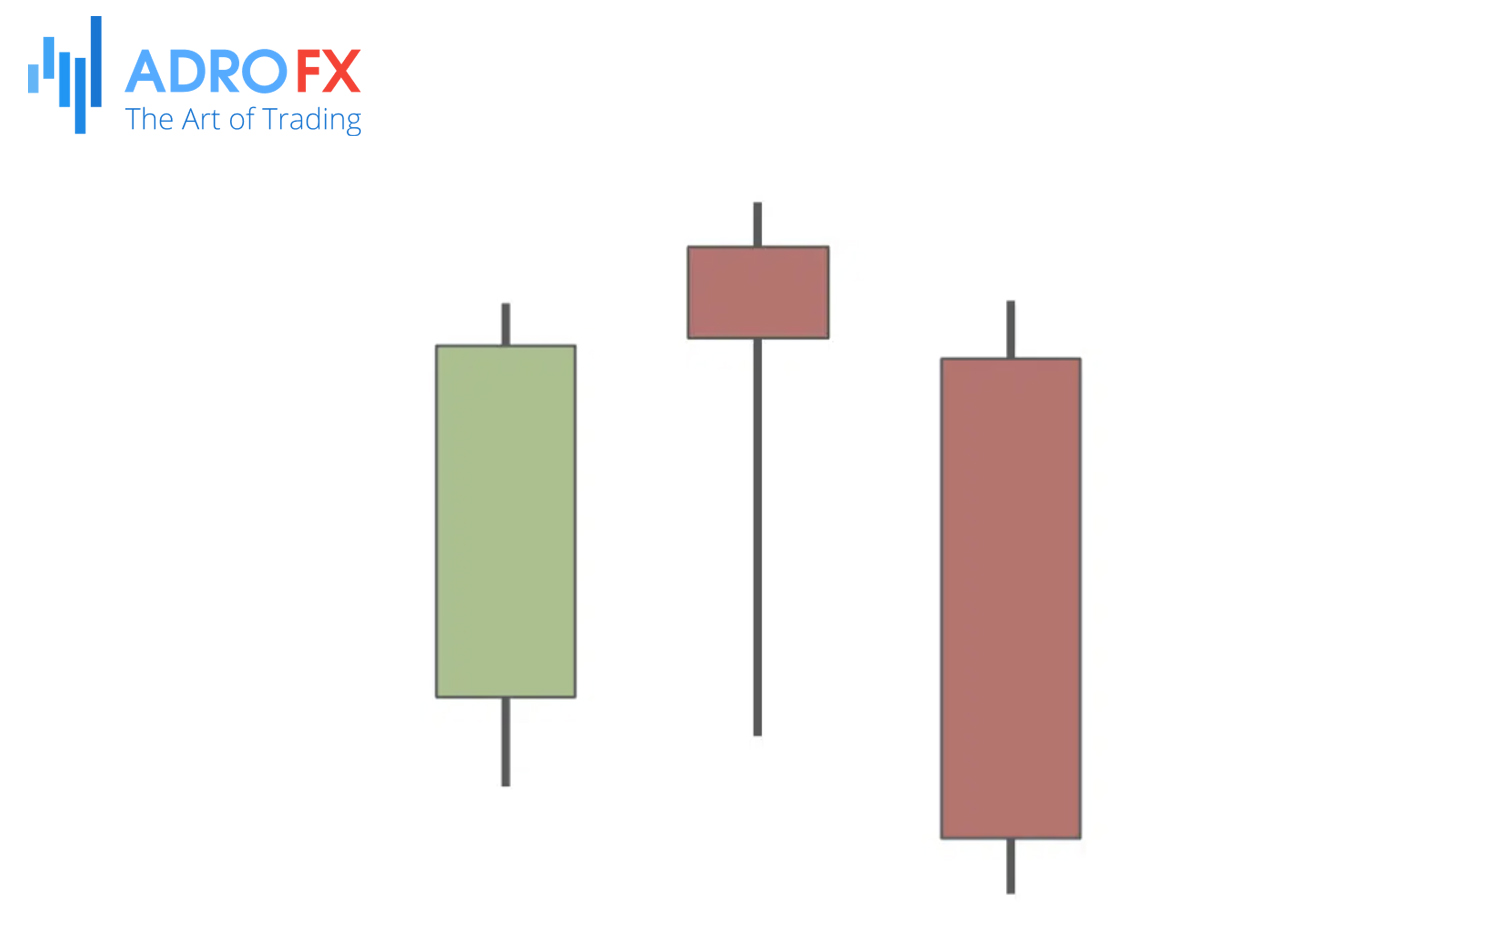
Dark Cloud Cover
Consisting of a long bullish candle followed by a bearish candle that opens above the previous high but closes below its midpoint, the dark cloud cover pattern highlights a transition from buying to selling pressure, indicating a potential downtrend.
Also read: Enhancing Your Candlestick Analysis: 5 Practical Tips For Actionable Improvement
How to Identify Reversal Candlestick Patterns
Identifying reversal candles requires a nuanced approach, as these patterns signal potential changes in current market trends. To accurately spot these patterns and leverage their insights, consider the following aspects:
Visual Indicators
Reversal candles are defined by their distinct visual characteristics that hint at a potential change in the market's trend. When analyzing candlestick charts, focus on the following key visual indicators:
- Shape and Form
Each reversal pattern has a unique shape. For example, a hammer, found at the end of a downtrend, has a small real body at the top with a long lower wick, showing that sellers tried to push the price down, but buyers pushed it back up. On the contrary, a shooting star, which appears at the top of an uptrend, features a small body at the bottom and a long upper wick, indicating that buyers drove the price up temporarily, but sellers eventually took control.
- Pattern Placement
The location of these patterns on the chart is crucial. A hammer at the bottom of a downtrend or a shooting star at the peak of an uptrend are more significant than if these patterns appeared elsewhere. Their position helps in assessing whether they signal a true reversal or a possible continuation of the trend.
- Confirmation Candles
Look for subsequent candlesticks that confirm the reversal. For instance, after spotting a bullish engulfing pattern, where a larger bullish candle completely encompasses a preceding bearish candle, check if the following candles continue to rise. This confirmation is essential to validate the initial reversal signal.
Volume Considerations
Volume is a vital aspect that can enhance the accuracy of reversal candlestick patterns. Here’s why:
- Volume as a Confirmation Tool
A reversal pattern accompanied by high volume generally indicates a stronger conviction behind the potential trend change. For example, a bullish engulfing pattern with increased volume suggests that the buying interest is substantial, reinforcing the likelihood of a bullish reversal.
- Volume Trends
Assessing volume trends helps distinguish between genuine reversals and false signals. Patterns formed during periods of low volume might not be as reliable. For instance, a hammer with low trading volume may not carry the same weight as one formed during high volume, making it less likely to signal a significant reversal.
- Volume Spikes
Sudden spikes in volume can supply additional confirmation. If you notice a substantial increase in volume as a reversal pattern forms, it signals that the market participants are actively engaged, thereby supporting the pattern's validity.
Experience the impact of reversal candlestick patterns firsthand with a risk-free demo account. Test your strategies and gain practical experience without financial commitment. Open a demo account with AdroFx today and explore the potential of your trading strategies in a simulated environment. See how different reversal candlestick patterns play out and refine your skills before moving to live trading.
Trading Strategies Using Reversal Candlesticks
Integrating reversal candlestick patterns into your trading approach demands meticulous planning and execution. Here's how to develop effective strategies using these patterns:
Entry and Exit Points
Accurately recognizing entry and exit points is pivotal to leveraging reversal patterns. Here are some strategic approaches:
Entry Points
Once a reversal candlestick pattern is identified, confirm the signal with additional technical analysis or follow-up candlesticks. For example, after spotting a bullish engulfing pattern, wait for a confirming bullish candle to close above the engulfing candle’s high before entering a trade. This additional confirmation lowers the risk of false signals and aligns your entry with the emerging trend.
Exit Points
Setting exit points involves determining where to take profits or cut losses. Use historical data and pattern performance to set realistic profit targets. For example, if a bullish reversal pattern shows up, you might set a profit target at a recent resistance level. Conversely, a trailing stop can help capture gains as the trend progresses while protecting against sudden reversals.
Stop Loss Orders
Implementing Stop Loss orders helps manage potential losses. Place Stop Loss levels just below the low of a reversal candlestick pattern, such as below the hammer’s tail for a bullish signal. This approach limits your risk if the pattern fails to materialize as expected.
Risk Management
Effective risk management is crucial when trading reversal candlesticks to protect your capital and enhance long-term success:
Position Sizing
Adjust your position size based on the reliability of the pattern and your overall trading strategy. A well-confirmed pattern might justify a larger position, while less certain signals warrant a smaller stake. Proper position sizing helps manage potential losses and ensures that no single trade can significantly impact your overall trading capital.
Risk-Reward Ratio
Employ a favorable risk-reward ratio to ensure that the potential reward justifies the risk. Aim for trades where the expected profit is at least twice the amount you risk. This ratio helps maintain a positive trading outcome even if a portion of your trades result in losses.
Diversification
Avoid concentrating your trades solely on reversal candlestick patterns. Combining these patterns with other technical indicators and analysis methods can provide a more comprehensive view of the market and reduce reliance on a single signal.
Final Thoughts
Mastering reversal candlestick patterns is a vital skill for any trader aiming to navigate market fluctuations effectively. Understanding key reversal candlestick patterns, such as the hammer and dark cloud cover, gives you a significant advantage in predicting potential trend reversals. This knowledge equips you to anticipate market changes, enhancing your trading strategy and decision-making process.
Identifying reversal candles goes beyond recognizing patterns; it requires a keen eye for visual indicators and an analysis of volume trends. The effectiveness of these patterns is often validated by subsequent confirmation candles and significant volume spikes. High-volume confirmation can validate the strength of a reversal, while patterns with low volume might need further scrutiny.
Incorporating reversal candlestick patterns into your trading strategy involves strategic planning. By focusing on precise entry and exit points, setting realistic profit targets, and implementing Stop Loss orders, you can manage risk and maximize returns. Effective risk management - through position sizing, maintaining a favorable risk-reward ratio, and diversifying your trades - further supports your trading success.
Embracing these practices will help you navigate the complexities of the trading world with confidence. Continue refining your skills, staying updated on market trends, and applying your insights to seize profitable opportunities. Mastery of reversal candlestick patterns not only enhances your trading strategy but also prepares you for success in the ever-evolving market landscape.
Ready to put your knowledge of reversal candlestick patterns into action? Elevate your trading strategy with AdroFx, your trusted partner for navigating market trends. With advanced trading tools, competitive spreads, and expert support, AdroFx provides everything you need to maximize your trading success. Start trading with AdroFx today and take control of your financial future. Open an account now and experience the difference with a broker that prioritizes your success. Whether you're looking to implement your reversal candlestick insights or explore new trading strategies, AdroFx is here to help you achieve your goals.

About AdroFx
Established in 2018, AdroFx is known for its high technology and its ability to deliver high-quality brokerage services in more than 200 countries around the world. AdroFx makes every effort to keep its customers satisfied and to meet all the trading needs of any trader. With the five types of trading accounts, we have all it takes to fit any traders` needs and styles. The company provides access to 115+ trading instruments, including currencies, metals, stocks, and cryptocurrencies, which make it possible to make the most out of trading on the financial markets. Considering all the above, AdroFx is the perfect variant for anyone who doesn't settle for less than the best.
Related Articles

Latest updates
Latest updates


Technical Analysis
Latest updates


