Can You Benefit From 1 Single Candlestick?
Candlestick patterns play a vital role in the trading world, offering insights into market sentiment and potential price movements. While there are intricate multi-candle patterns, this article focuses on the simplicity of single-candlestick patterns. We explore the characteristics of these solitary candles and discuss their reliability in guiding trading decisions. From the classic Doji to the Hammer and Shooting Star, these patterns are versatile tools that traders across various asset classes can leverage for improved decision-making.
What Is a Single Candlestick?
A single candlestick represents a pattern formed by a solitary candle, in contrast to more complex patterns that require multiple candles over a longer time frame.
Examples of patterns involving two or more candlesticks include:
- Engulfing
- Three Dark Crows
- Three White Soldiers
- Bullish and Bearish Block Reversal
- Piercing
- Matching Low
- Pin Bar
- ...and various others.
Candlesticks vs. Chart Patterns
Traders often inquire about the distinction between candlestick patterns and chart patterns. Candlestick patterns are typically formed by either one or two candles, offering insights into market sentiment during short time intervals.
Chart patterns, on the other hand, develop over a specific period and are generally categorized as continuation or reversal patterns. Continuation patterns include formations like ascending and descending triangles, cup and handle, and bullish and bearish pennants and flags.
Reversal patterns, such as wedges, double and triple tops, and head and shoulders formations, often indicate a forthcoming change in the asset's price trend.
Examples of Single Candlesticks
There are several single candlestick patterns that traders can apply across various asset classes, including stocks, forex, commodities, and exchange-traded funds (ETFs). Here are some commonly observed single-candle patterns:
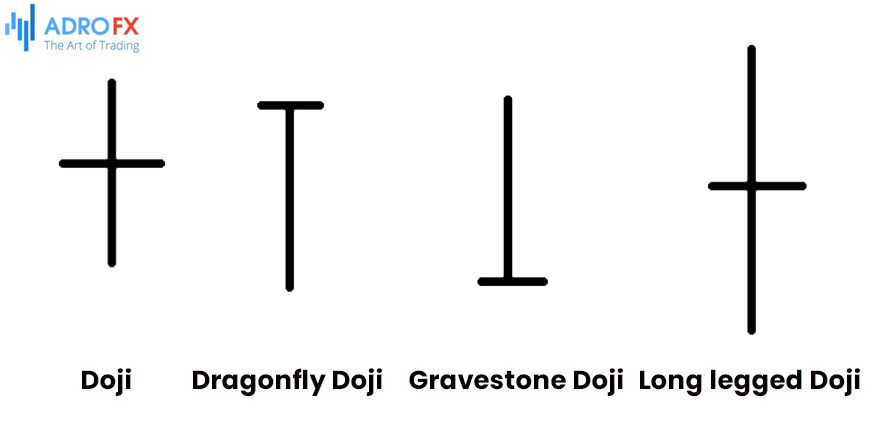
Doji
A doji occurs when the asset's closing price equals its opening price, resulting in a plus-sign-like candle.
Variations include gravestone, long-legged, and dragonfly dojis.
- Gravestone Doji: Features a small lower shadow and an extended upper shadow with a tiny body.
- Long-Legged Doji: Exhibits long upper and lower shadows.
- Dragonfly Doji: Has a minimal upper shadow and a lengthy lower shadow.
Doji patterns often signal potential reversals. In an uptrend, they may suggest a bearish reversal, while in a bullish trend, they could imply a shift toward a bearish sentiment.
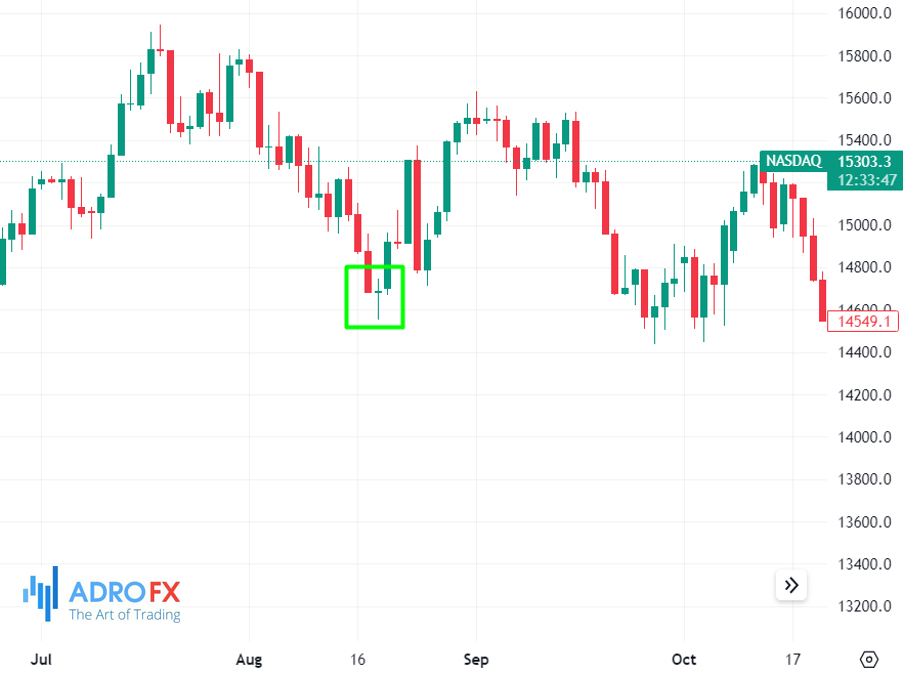
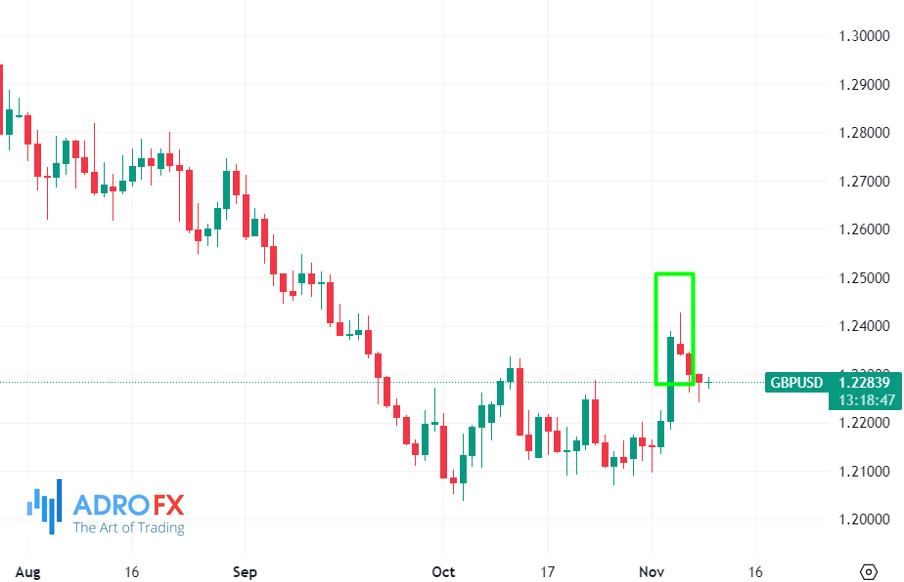
Hammer
A hammer pattern resembles the shape of an actual hammer and consists of a small body with an extended lower shadow. Typically, the candle is bearish, often appearing red in color.
Hammers tend to form during a downward trend when the asset opens significantly lower and then closes slightly higher than the opening price. It is relatively straightforward to trade the hammer pattern by placing a buy stop just above the upper end of the hammer and setting a Stop Loss below the lower end.
The example below illustrates a hammer pattern in action:
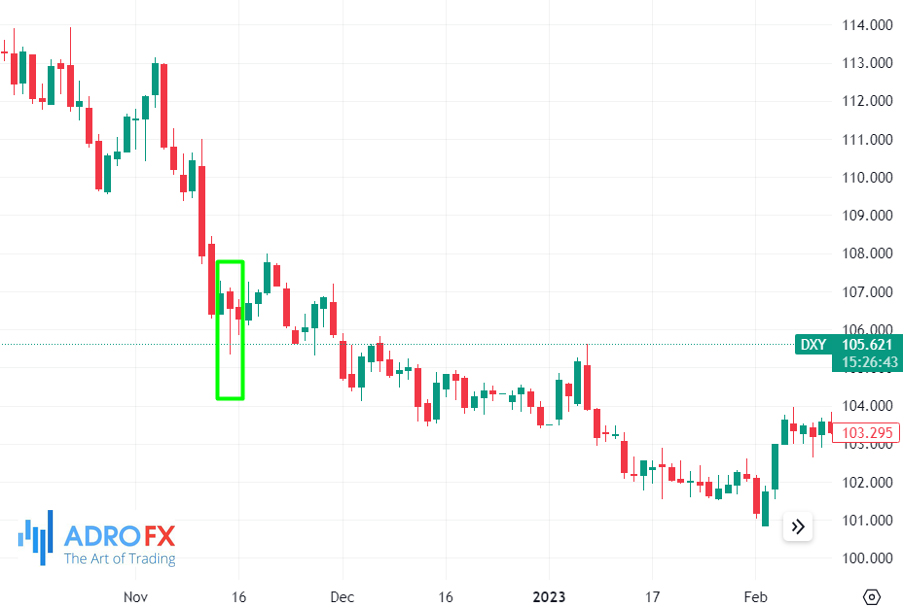
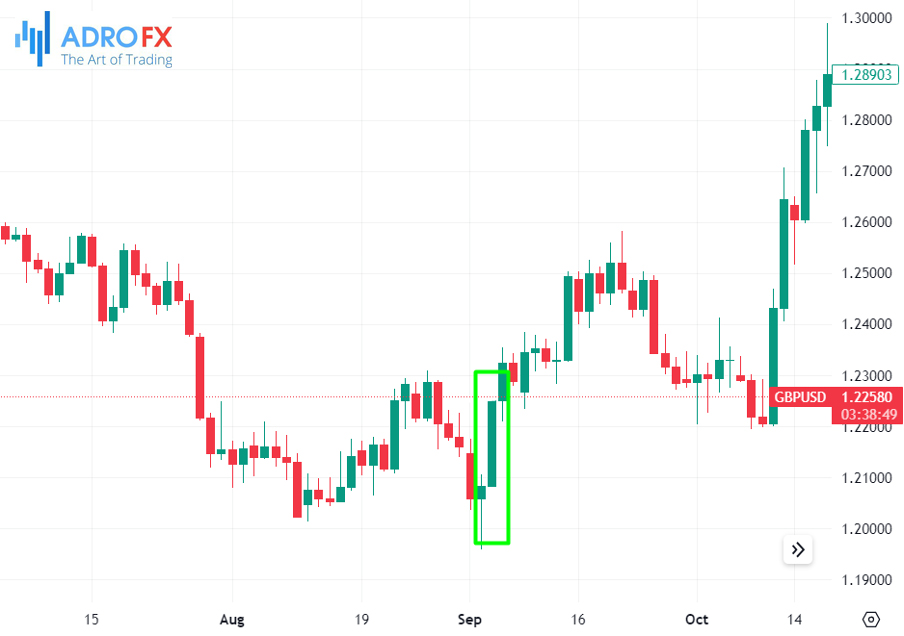
Inverted Hammer
An inverted hammer pattern is the converse of a hammer pattern. It takes shape when an asset's price forms a small body and an elongated upper shadow, typically during a downward trend. Its emergence often signals a potential reversal of the bearish trend. See the chart below for a visual example:
Marubozu
The Marubozu is another single candlestick pattern characterized by the absence of both upper and lower shadows, resembling a solid block. There are three primary variations: Marubozu open, Marubozu close, and Marubozu full, each represented in the chart below. Marubozu patterns can be challenging to trade, as they often lack a clear bullish or bearish bias.
The prudent approach when identifying this pattern is to wait and observe how it evolves. Subsequently, you can place buy-stop and sell-stop orders, one above and one below the candle, to capture potential market movements.
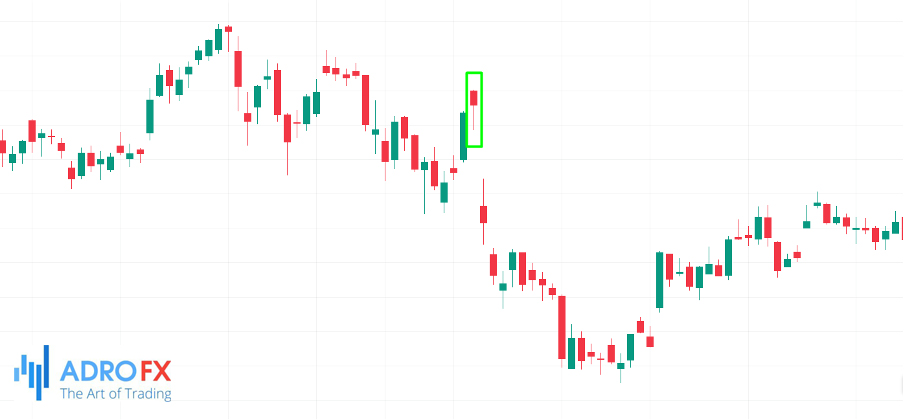
Hanging Man
A hanging man candlestick is essentially the opposite of a hammer pattern and typically materializes in a bullish trend. It features a small body and a lengthy shadow. Trading the hanging man mirrors the strategy employed for the hammer pattern. You can position a sell-stop order beneath the lower extremity of the hanging man and a stop-loss order above its upper body. The sell-stop can initiate a downward movement when triggered, as depicted in the chart below.
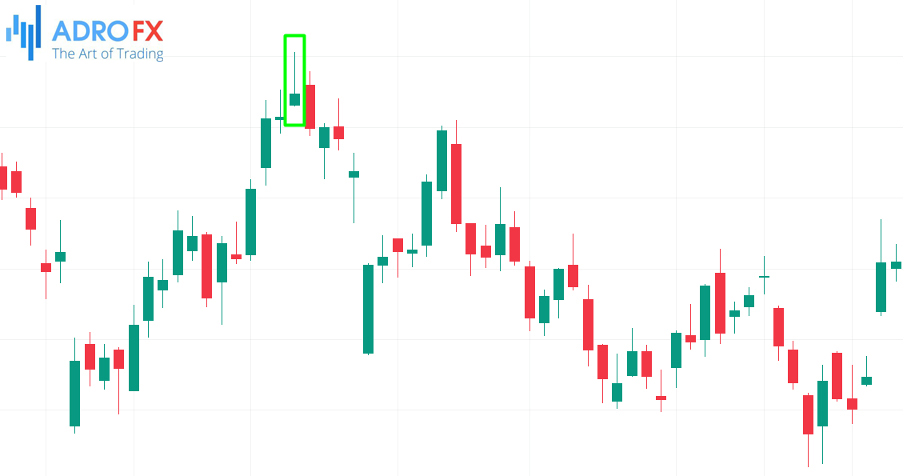
Shooting Star Pattern
The shooting star pattern serves as the counterpart to the hanging man pattern, characterized by a small body and an extended upper shadow during an uptrend. In most cases, the shooting star pattern emerges within an uptrend and foreshadows a subsequent bearish trend. When it materializes, the asset commonly experiences a decline, as illustrated in the chart below.
Are Single Candlestick Patterns Reliable?
A common inquiry pertains to the reliability of single candlestick patterns. The fact of the matter is that most of these patterns, particularly the hammer, doji, and shooting star patterns, are known for their high degree of accuracy. Nevertheless, it's essential to acknowledge that these patterns do not invariably guarantee the anticipated continuations or reversals discussed earlier.
Hence, it is advisable to exercise prudence by emphasizing the importance of testing and awaiting confirmation before executing a trade. For instance, when a hammer pattern emerges, it's prudent to exercise patience before engaging in a bullish trade.
Furthermore, we recommend incorporating a multi-timeframe analysis in conjunction with technical indicators to enhance the precision of your trading decisions. This comprehensive approach enables you to make more informed choices regarding whether to buy or sell a particular asset, taking into account a broader context of market data and trends.
Conclusion
In the dynamic landscape of financial markets, single candlestick patterns serve as valuable indicators of potential price shifts and reversals. These patterns, such as the Doji, Hammer, and Shooting Star, are known for their accuracy, yet they do not guarantee specific outcomes. To trade with confidence, patience, and prudence are key. It is advisable to await confirmation and supplement your analysis with a multiple time frame approach and technical indicators. This holistic strategy empowers traders to make well-informed decisions, leveraging the power of single candlestick patterns alongside a broader understanding of market dynamics.

About AdroFx
Established in 2018, AdroFx is known for its high technology and its ability to deliver high-quality brokerage services in more than 200 countries around the world. AdroFx makes every effort to keep its customers satisfied and to meet all the trading needs of any trader. With the five types of trading accounts, we have all it takes to fit any traders` needs and styles. The company provides access to 115+ trading instruments, including currencies, metals, stocks, and cryptocurrencies, which make it possible to make the most out of trading on the financial markets. Considering all the above, AdroFx is the perfect variant for anyone who doesn't settle for less than the best.
Related Articles
Latest updates
Latest updates


Technical Analysis
Latest updates


