Fibonacci Precision: Using the Gartley Pattern to Predict Forex Trends

Chart patterns play a crucial role in forex trading, serving as a visual representation of market psychology and helping traders make informed decisions. These patterns, derived from historical price data, can indicate potential future price movements, offering valuable insights into market trends and reversal points. By recognizing and interpreting these patterns, traders can develop strategies to capitalize on market opportunities and mitigate risks.
One of the most significant and widely recognized chart patterns in forex trading is the Gartley Pattern. Named after H.M. Gartley, who first introduced it in his 1935 book "Profits in the Stock Market," the Gartley Pattern is a harmonic chart pattern that helps traders identify potential reversal points. Its unique structure and reliance on Fibonacci ratios make it a powerful tool for traders seeking to predict market movements with a high degree of accuracy. Understanding and utilizing the Gartley Pattern can enhance a trader's ability to make strategic decisions in the dynamic forex market.
What Is the Gartley Pattern?
The Gartley Pattern is a harmonic chart pattern that consists of five points (X, A, B, C, and D) forming a distinct M or W shape on a price chart. This pattern helps traders identify potential reversal points by leveraging specific Fibonacci ratios, which indicate areas of support and resistance.
Historical Background
The Gartley Pattern was introduced by H.M. Gartley in his seminal work "Profits in the Stock Market" published in 1935. Gartley's discovery was rooted in his observation that certain price movements followed a consistent pattern, which could be used to predict future price reversals. His work laid the foundation for harmonic trading, a methodology that uses Fibonacci sequences to identify precise turning points in financial markets.
Fitting into Harmonic Trading Patterns
Harmonic trading patterns, including the Gartley Pattern, rely on Fibonacci ratios to determine key levels of support and resistance. These patterns are characterized by their adherence to specific geometric shapes and Fibonacci measurements, which distinguish them from other chart patterns. The Gartley Pattern, in particular, is notable for its precise structure:
- XA Leg: The initial price move.
- AB Retracement: A retracement of the XA leg, typically around 61.8% of XA.
- BC Extension: A move in the opposite direction of AB, usually retracing 38.2% to 88.6% of AB.
- CD Leg: The final move, ideally 127.2% to 161.8% of the BC leg, completing the pattern.
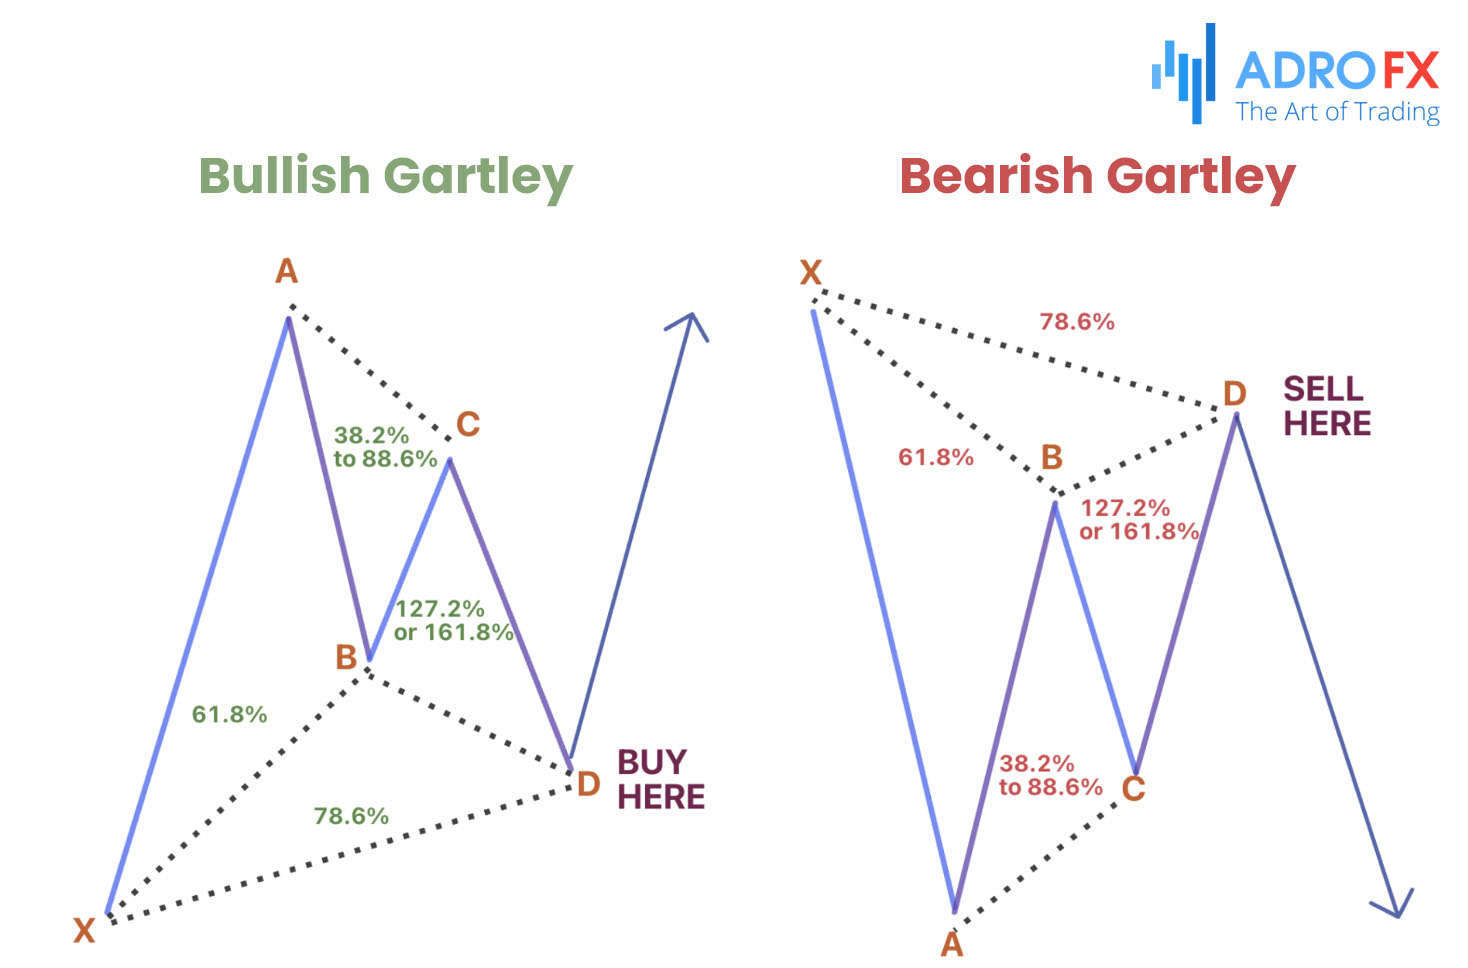
By fitting into the broader category of harmonic trading patterns, the Gartley Pattern provides traders with a methodical approach to identifying potential reversal points with a higher probability of success. Its reliance on Fibonacci ratios not only aids in pinpointing these key levels but also adds a level of precision and reliability to trading strategies. Understanding and applying the Gartley Pattern can significantly enhance a trader's toolkit, offering a structured method to navigate the complexities of the forex market. The Gartley Pattern is a sophisticated tool in technical analysis, characterized by its distinctive M or W shape on price charts. Comprised of five critical points - X, A, B, C, and D - it provides a structured framework for identifying potential trend reversals with precision.
At its core, the pattern begins with point X, representing the initial price movement that sets the pattern in motion. From there, the market retraces to point A, marking the first significant reversal after X. This establishes the baseline for subsequent movements.
Point B then retraces a portion of the initial XA move, forming the AB leg. This retracement typically adheres closely to the 61.8% Fibonacci ratio, a key level that signifies the correct proportionality within the pattern. It's at this stage that traders keenly observe the retracement depth to confirm the pattern's validity.
Following AB, point C extends the pattern further, forming the BC leg. The extension from B to C typically ranges between 38.2% and 88.6% of the AB leg. This extension's exact level is critical; it must fall within this range to maintain the pattern's structural integrity.
The final point, D, completes the Gartley Pattern with the CD leg. This leg extends from point C and is crucially measured against Fibonacci extensions. Point D typically reaches between 127.2% and 161.8% of the BC leg, marking a potential reversal zone where traders anticipate significant market reactions.
In summary, the Gartley Pattern's effectiveness lies in its adherence to Fibonacci ratios and precise price movements, making it a valuable tool for traders seeking to identify favorable entry and exit points in the financial markets. Understanding each point's role and the ratios involved enhances its application in technical analysis strategies.

Identifying the Gartley Pattern
Spotting the Gartley Pattern on forex charts requires attention to detail and an understanding of the specific Fibonacci ratios that define the pattern. The process begins with identifying the initial XA leg, a significant price move that forms the foundation of the pattern. Following this, the next step is to locate the AB retracement. This involves looking for a retracement that forms the AB leg, with the B point lying at a 61.8% Fibonacci retracement of the XA leg.
After identifying the AB retracement, the focus shifts to spotting the BC retracement. This entails looking for an extension in the opposite direction of the AB leg to form the BC leg, with the C point falling between 38.2% and 88.6% retracement of the AB leg. Finally, the CD extension completes the pattern. This involves looking for the extension from the C point to form the CD leg, with the D point lying between 127.2% and 161.8% extension of the BC leg.
Visual aids and diagrams are incredibly helpful in illustrating the Gartley Pattern. These should clearly show the M or W shape of the pattern, highlighting the key points (X, A, B, C, and D) and their corresponding Fibonacci ratios. Utilizing such visual aids can make it easier to understand the structure of the pattern and improve accuracy in identifying it on real charts.
Using technical analysis tools can significantly aid in identifying the Gartley Pattern. Fibonacci retracement and extension tools are essential for accurately measuring the retracement and extension levels for each leg of the pattern. Advanced charting software that offers harmonic pattern recognition features can help automate the identification process. Regular practice on historical data can enhance your ability to recognize the pattern in real-time trading. Combining the Gartley Pattern with other technical indicators, such as moving averages or the RSI, can also help confirm potential reversal points and improve the reliability of your trades. By following these steps and utilizing the right tools, you can effectively identify the Gartley Pattern on forex charts and use it to inform your trading decisions.
Trading the Gartley Pattern
Trading the Gartley Pattern involves identifying strategic entry, Stop Loss, and take-profit points. To enter a trade based on the Gartley Pattern, one should initiate a buy or sell position at the D point, which is formed by the CD extension. This point represents the potential reversal zone. The entry is typically placed slightly above or below the D point to confirm the reversal.
Setting appropriate Stop Loss orders is crucial for managing risk. The Stop Loss level should be placed beyond the X point, as this ensures that the trade is exited if the price moves significantly against the expected direction. This placement helps to minimize losses in case the pattern fails.
Determining Take Profit targets involves identifying key levels where the price is likely to face resistance or support. Commonly, the Take Profit targets are set at the retracement levels of the AD leg, such as the 61.8% or 100% retracement levels. These targets allow traders to maximize profits while adhering to the pattern's expected price movement.

Advantages of the Gartley Pattern
The Gartley Pattern is known for its reliability and relatively high success rate, making it a favored tool among traders. Its precision in defining potential reversal points based on Fibonacci ratios enhances its credibility. Successful trades using the Gartley Pattern often showcase its effectiveness, with historical examples demonstrating consistent performance in predicting market reversals.
When compared to other harmonic patterns, the Gartley Pattern stands out due to its early identification of potential reversals and clear criteria for entry and exit points. This pattern's ability to provide traders with a structured approach to trading enhances its appeal, especially when integrated with other technical analysis tools. Its distinctiveness lies in its specific Fibonacci retracement and extension levels, which offer a higher degree of accuracy in forecasting price movements.
Overall, the Gartley Pattern's advantages make it a valuable addition to a trader's toolkit, providing a robust framework for making informed trading decisions and managing risk effectively.
Limitations and Risks
While the Gartley Pattern is a powerful tool in forex trading, it comes with its share of limitations and risks. One potential pitfall is the occurrence of false signals, where the pattern appears to form correctly but fails to result in a successful trade. This can happen due to market noise or sudden changes in market sentiment.
The Gartley Pattern might not work well in certain market conditions, particularly in highly volatile or trending markets where price movements do not conform to the pattern's retracement and extension levels. In such scenarios, the precision of the Gartley Pattern diminishes, making it harder to predict reversals accurately.
To mitigate potential losses, traders should employ robust risk management strategies. This includes setting strict Stop Loss levels beyond the X point to limit downside risk. Additionally, using other technical indicators or analysis methods to confirm the pattern's signals can reduce the likelihood of entering false trades. Diversifying trades and not relying solely on the Gartley Pattern for trading decisions can also help manage risk more effectively.
Practical Applications and Examples
The practical application of the Gartley Pattern in forex trading is best illustrated through real-world examples. By analyzing historical data, traders can see how the pattern has played out in various market scenarios. For instance, reviewing a past instance where the Gartley Pattern successfully predicted a market reversal can showcase its effectiveness and provide insights into its application.
Case studies of recent forex market scenarios involving the Gartley Pattern can further highlight its utility. These studies typically examine specific trades where the pattern was identified, detailing the entry and exit points, the market conditions at the time, and the outcome of the trade. Such examples can serve as valuable learning tools, demonstrating the pattern's practical use and helping traders understand how to apply it in their trading strategies.

Top Tips for Trading the Gartley Pattern
Trading the Gartley Pattern requires a clear strategy and disciplined approach to maximize its effectiveness. First, focus on identifying the D point accurately, as this marks the potential reversal zone and is critical for deciding entry points. A common strategy is to wait for a confirmation signal, such as a candlestick pattern indicating a reversal or a bullish/bearish divergence in the RSI, before entering the trade. This reduces the risk of entering on a false signal.
Setting Stop Loss orders is essential to manage risk effectively. Place your Stop Loss just beyond the X point to protect against significant adverse price movements. This approach ensures that your risk is contained if the trade does not go as expected. Additionally, consider using a trailing Stop Loss once the trade moves in your favor to lock in profits while allowing for further gains if the trend continues.
For Take Profit targets, use the Fibonacci retracement levels of the AD leg. Common targets include the 61.8% and 100% retracement levels, which align with the pattern's expected price movement. This strategy helps you capitalize on the price's likely reaction to these key levels. Splitting your Take Profit targets can also be beneficial; take partial profits at the first target and let the rest run to the next level to balance risk and reward.
Another tip is to integrate the Gartley Pattern with other technical analysis tools to confirm your trades. Indicators like moving averages, trend lines, and volume analysis can provide additional context and increase the probability of a successful trade. For instance, if the Gartley Pattern aligns with a long-term trend line or a significant support/resistance level, it strengthens the trade's potential.
Lastly, practice patience and discipline. Not all price movements will form a perfect Gartley Pattern, and forcing trades in the absence of clear signals can lead to losses. By waiting for the right setups and adhering to your trading plan, you can effectively use the Gartley Pattern to enhance your forex trading strategy.
Conclusion
In conclusion, the Gartley Pattern is a pivotal tool in forex trading, offering a structured approach to pinpoint potential reversal points with Fibonacci precision. By leveraging historical data and technical indicators, traders can confidently interpret market movements and make informed trading decisions. While acknowledging its strengths and limitations, integrating the Gartley Pattern into a comprehensive strategy enhances trading effectiveness, enabling traders to manage risks and optimize profitability in dynamic market conditions.

About AdroFx
Established in 2018, AdroFx is known for its high technology and its ability to deliver high-quality brokerage services in more than 200 countries around the world. AdroFx makes every effort to keep its customers satisfied and to meet all the trading needs of any trader. With the five types of trading accounts, we have all it takes to fit any traders` needs and styles. The company provides access to 115+ trading instruments, including currencies, metals, stocks, and cryptocurrencies, which make it possible to make the most out of trading on the financial markets. Considering all the above, AdroFx is the perfect variant for anyone who doesn't settle for less than the best.
Related Articles


Latest updates
Latest updates


Technical Analysis
Latest updates


