An Ultimate Guide to Reversal Candlestick Patterns: Hammer, Inverted Hammer, Shooting Star & Hanging Man
The group of candlestick patterns stands out such reversal patterns, which have only one candle in their structure. This trading technique was invented originally for the stock market, but soon it successfully proved itself in currency trading as well.
Different unusual names can be found in trading, such as Shooting Star, Hanging Star, Hammer, and Inverted Hammer. These words are called single candlestick patterns, which are able to change the picture of the market. They are very similar to each other, for which some traders have the figurative name chameleons.
Major Forex Trend Reversal Candlestick Patterns
These patterns are reversal patterns consisting of a single Japanese candle. It is important to be able to distinguish them from each other because trading tactics will differ depending on the type of pattern.
It is possible to identify the following common features of these patterns:
- These patterns signal a change in the trend, that is, they are typical reversal patterns, along with pin bars, Harami;
- They consist of just one candle;
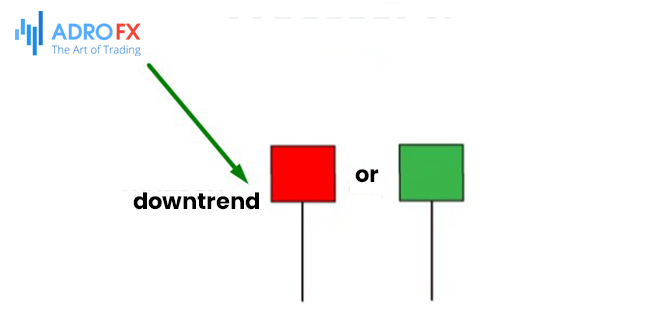
- The body of the candle looks short. This is explained by the fact that the opening and closing prices are not much different;
- The color in these patterns is not important, but still plays a role in determining the strength of the signal they provide.
The main differences are as follows:
- The key role in pattern identification belongs to its tails;
- The patterns indicate different trends: some are ascending, and others are descending.
Learning how to identify and trade these patterns is very important, so it's imperative to look at all the nuances of each one. Let us consider each of them separately so you grasp all the details at a glance.
Hammer Candlestick
The Hammer is a bullish candle, which is formed in a downtrend, that is, it is an indicator of an existing minimum price level.
Thus, the logic of the formation of the Hammer is opposite to the Shooting Star, so it will be quite difficult to confuse them.
Ideal Hammer parameters are:
- The best body proportions are square;
- A large lower shadow stands out, but there is almost no long upper tail - a pointer to the bulls' attempts to win back the trend in their direction. There is a change of trend from a downtrend to an uptrend;
- It is desirable that the candle, which closed before the hammer, has a small range. Thus, a slight difference between the opening and closing prices is fixed on the chart;
- The white (green) hammer is the most successful.
During the formation of the hammer, the instability of quotes is noticeable, which is indicated by the exceeding of the pattern size concerning the other candles. It also signals the struggle between buyers and sellers.
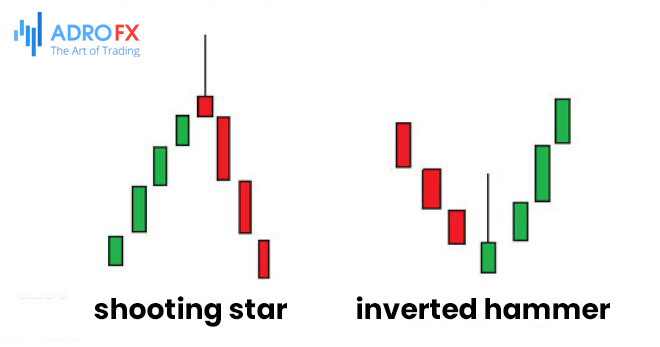
Inverted Hammer vs Shooting Star
An inverted hammer is an inverse model for the hammer pattern. By analogy with the usual hammer in a stable downtrend due to the inclusion of the bulls an upper shadow appears, but still by the time of closing the bears return to the lost positions. Further movement remains unclear until the next trading day.
Upon this pattern the low price changes in the direction of increasing. It is formed under the conditions of the sellers' price decrease. Thus, the main difference between the inverted hammer and the usual one is that the price jump reflected in the length of the tail was not able to fix immediately at the closing of the candle.
The inverted hammer is characterized by the following:
- It has a long upper tail, otherwise does not differ from the hammer, so it looks like a hammer upside down. Thus, all the difference is in the tail, in the trace of the bears' wagging positions;
- The inverted hammer is similar to the shooting star, the difference is in the nature of the change in the price trend;
- The shooting star is a bearish pattern, which marks the change from a rising trend to a falling trend - it's the name implies that the price was at the peak but suddenly began to "fall";
- At this time there are significant changes in the market. The bulls prevail, who due to their high purchasing activity bring the price to a minimum at an initial uptrend. The bulls' forces weaken and the trend reverses.
The key graphical characteristics of the shooting star are:
- The absence of a lower shadow and the presence of a long upper end is a clear sign of bearish activity;
- The color can be any color, but black is considered to be the strongest pattern.
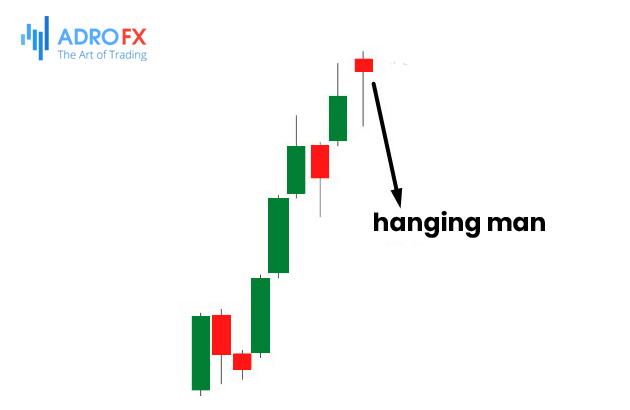
The Hanging Man Candlestick
The hanging man appears at the end of an uptrend when the buyers are rapidly closing their positions.
The appearance of the hanging man can be logically explained as a struggle between the bulls and the bears for the price when at the peak of the uptrend the bears are trying to win back, but then the leading positions are returned to the bulls. So, a long bottom shadow and a short body are formed on the chart. As you can see from the description of the hanging man formation, it is the opposite of the inverted hammer.
The geometry of the hanging man is quite simple:
- The pattern was formed at the end point of a price rise;
- The pattern has a lower long tail in accordance with the ideal parameters for the figure (the tail is 2-3 times larger than the body). Indicates the change from the uptrend to the downtrend;
- Similar to the hammer, but the difference is in the market reversal direction.
Graphical Characteristics of Patterns
You can discover the following geometric features that indicate the perfect shooting star, hammer, hanging, and inverted hammer patterns:
Small candle body. Shows how the struggle between bulls and bears ends. The most harmonious combination of the body and the long shadow is approximately 2-3 units. Other parameters reflect a completely different market situation, and therefore focusing on the false signs of the figure can lead to losses.
The candlestick is single, unlike the Rails, Engulfing, and other patterns.
One shadow is long (about 300% of the body size), and the other is short (10% of the size). It is these proportions that are pointers to the ideal figure.
These signs vary for each of the four patterns.
These patterns, like many others, can easily be confused with different figures. It will be useful for a trader to learn about the false signs of these patterns in order not to incur losses because of an error. The following patterns are very similar to the shooting star:
Gravestone Doji - their similarity is the small size of the candle, the difference is that the gravestone has no body at all, and the shooting star has a small body. It is generally accepted that gravestone is a type of shooting star pattern.
Morning/Evening Star - Despite the similar names, their role in the market and geometry are different. Shooting star consists of one candle (some traders think it consists of two since the second candle confirms a change in the trend), while morning and evening stars consist of three candles.
A high candle with short tails before the shooting star shows that the trend will continue to go up, and the trader's calculations about the price change will be wrong.
The shooting star crossing the resistance boundary is a bad sign for the trader, you should not take this pattern as a true shooting star, the movement of which is subject to certain rules.
Head and shoulders is another pattern, visually similar to the star. The difference is that head and shoulders is a composite pattern indicating a change of trend while shooting star is a one-star pattern. Also, with the head and shoulders, the price goes up, but then goes down a little, forming an elevation in the center and almost identical levels of tails on the sides. If a trader faces a "starfall", the picture is a bit different: equilateral extrema are not always formed as the main geometric indication of a shooting star is still the moment (point) of trend reversal after which there is no strict price movement, the trend direction changes but reaching of any peaks is not obligatory.
As for the hammer, we can note the following:
- This pattern can sometimes be mistaken for a pin bar. The similarities can be found in the long shadow size and the difference is that the hammer lies on a downward price line while the pin bar can be on any trend.
- A hammer with a small tail should not be taken as a strong signal. It is more likely to indicate only short-term changes like a flat.
- Too short body and a very long tail is a sign of an impulse price spike, which is rarely profitable for trading.
Regarding the inverted hammer, you can notice that due to the opposite of the standard hammer, the false signs will be similar:
- Also, a small tail is an indicator of minor changes;
- A squat body with a rising long tail is a signal sign of a sharp jump, which does not change the trend.
Regarding the false hanging man, it is worth noting:
- This candle has similarities to the Dragonfly Doji pattern, which is a type of hanging man, but it lacks a body;
- A situation where the long tail is more than 3 times long is a clear indication of an unstable trend and is likely to be short-term;
- A dangerous sign for the trader is the Marubozu, which appeared next to the hanging man. Such a mysterious figure with a long body and missing tails does not bode well, or rather, indicates an incredibly strong position of one of the market kings - bulls or bears. In this case, the trading tactics will be much different than in the case of the hanging man;
- When the body is on the resistance line, it is better not to trade.
How to Trade Reversal Candlestick Patterns
The basic sequence of actions for working with these figures is almost no different from the general one for all patterns:
- Technical analysis, which includes the consideration of the location of candles in the area of the pattern and the proportions of the pattern formed, as well as the study of the relationship to various levels when applying the main indicators.
- The use of various indicators to facilitate the trading process: Fibonacci retracement, Color MACD, Stochastic, Shooting indicator, Ozymandias.
- The choice of the market and taking into account its characteristics for trading with these patterns will be described below.
- Focusing on a suitable time frame, allows you to make sufficient profits.
- Trading by taking into account the characteristics of the patterns - the application of knowledge about the anatomy of the patterns in action.
- Setting Stop Loss and Take Profit, which minimizes the risks.
Markets
When using these patterns, it is possible to trade on both the foreign exchange and stock markets. But trading will differ depending on the type:
Gaps between candles are common in the stock market. The process of formation of such gaps is due to some news. For stock markets, it is characteristic of the gap at the end of the trend, that is, at the end of the trend.
In the currency market, this situation is rare and usually occurs at the end of the trading week (Friday-Sunday).
You can learn to manage the situation in the market when gaps are formed. You have to learn to predict the disappearance of gaps (that usually happens at the opening of the exchange in Tokyo, when the market is alive), as well as the nature of the reversal. Trading gaps is complex and involves a lot of risks.
Time Frames
It is strongly not recommended for beginners to trade in low time frames, because instead of profit you can get considerable losses. Traditionally the high time frame is considered the safest one. Within a relatively high time frame, there will be fewer false fluctuations and market noise.
It is worth telling about one useful detail which will allow increasing the profit. It's possible (and even necessary) to analyze the market using different time frames simultaneously - large and small. Thus, with the help of a higher time frame you can determine the general trend, and looking at the lower trading period you can find the ideal point to enter the market.
You can set both standard and non-standard time frames for trading.
The Main Trading Rules
Trading the shooting star candlestick, you should be guided by these simple rules:
- If a shooting star is on the market, it's time to short, it's time to sell;
- The pattern should have a perfect shape, which was mentioned earlier. The reinforcing sign - a bearish candle after the pattern;
- It is worth realizing that not always a good shape can go to the trader and often the trend does not change for a certain period of time, so there is no need to rush to Stop Losses;
- It is necessary to use the levels of strengthening, and resistance;
- It is possible to enter by a closed candlestick, a Sell Stop order (set just below the Low of the candlestick), or a Sell Limit order (at 38.2-50% of the star);
- Stop Loss should be set at a recent high;
Upon the hammer candle, consider the following tips:
- Just as with all patterns, it is important for the trader to be mindful of the false and perfect signs of the pattern.
- When a hammer appears, you can open a trade (the so-called buy signal).
- It is possible to enter the market by the closing price, by Buy Stop (with an allowance of 4-5 points from the highest point), or by a limit order (50% to the level of the hammer).
You should take into account only the hammer, which was formed at the end of the trend, otherwise, it may not mean a change in market direction, but the passing impulses.
It is advisable not to trade when bearish patterns appear before the hammer.
The Stop Loss should be placed at the low of the price.
Regarding the hanging man, it can be noted that the rules are similar to those for trading the hammer, taking into account that the bullish strategy is changed into a bearish one. But the risks are still greater than with the hammer due to the weakness of the signals. Also, you should look for ideal patterns and beware of bullish candlestick patterns ahead.
By thoroughly studying the features of these figures, it is possible to reach the level of virtuoso mastery of these market tools. Then the profit will be as simple as the reversal candlesticks themselves.

About AdroFx
Established in 2018, AdroFx is known for its high technology and its ability to deliver high-quality brokerage services in more than 200 countries around the world. AdroFx makes every effort to keep its customers satisfied and to meet all the trading needs of any trader. With the five types of trading accounts, we have all it takes to fit any traders` needs and styles. The company provides access to 115+ trading instruments, including currencies, metals, stocks, and cryptocurrencies, which make it possible to make the most out of trading on the financial markets. Considering all the above, AdroFx is the perfect variant for anyone who doesn't settle for less than the best.
Related Articles
Latest updates
Latest updates


Technical Analysis
Latest updates


