What Is Fibonacci Retracement? Definition & How to Use It
Setting the support and resistance levels is usually a problem for traders. It is especially inconvenient when trying to figure out from the beginning where to place them on the chart: one may think there are no good points to be plotted and it may be better to choose another time frame. Then the chart begins to change direction - and the support that has just been plotted becomes resistance.
Immediately the question arises: "Where to build new support and how long to wait for it?"
Eventually, a breakout occurs: the trader begins to clearly see two chart peaks and two maximum declines, clearly building horizontal levels. The next revelation is understanding the principle of their operation when the price really pushes back from them and breaks up and down.
The next stage of learning strong trading lines is getting acquainted with the Fibonacci retracement. It consists of several horizontal levels which, if correctly drawn, show stages of price rise and fall in real-time mode. It means they help to determine how far the price is ready to go, up to what point it can pull back, and from what level it can continue moving in the initial direction.
Thus, it is possible to learn in one fell swoop to set several levels on the chart at once, between which it will move.
The Golden Ratio in Fibonacci Numbers
Fibonacci retracement is a grid of horizontal levels drawn on a chart in one movement.
The basis for the indicator was found 9 centuries ago. You must have heard about the golden ratio principle. Well, this is what is used as a mathematical formula for the indicator and allows you to use Fibonacci numbers in trading.
The theory was developed by the mathematician Leonardo of Pisa. Initially, he tried to solve the problem about rabbits: "If you put one pair in a closed room, how many pairs of rabbits will be born in 12 months?"
The resulting answer turned out to be a phenomenal sequence of numbers: 1, 1, 2, 3, 5, 8, 13, 21, 34, 55, 89, 144, 233, 377, 610, 987. Each next number in the chain is equal to the sum of the previous two.
Fibonacci numbers in trading have some quite curious properties, which just confirms that Leonardo has really found something legendary.
So, if we divide each of the numbers by the previous one, the result will always be equal to 1.618 - the golden ratio (Phi number). For example, 610 divided by 377 would be 1.618. Test it yourself!
Is it necessary to mention that everything in nature, as it turned out, is based on the golden ratio principle!
How to Read Fibonacci Retracement?
The main characteristic of Fibonacci retracement is the demonstration of the strength of directed price movement. That is, it must be a pronounced trend: sideways, flat movement is not suitable for this indicator.
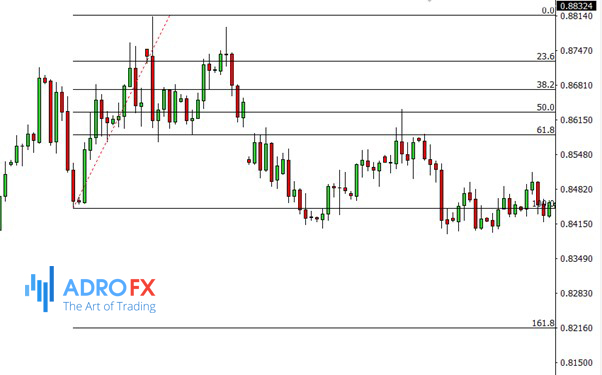
Each of the six levels included in the standard Fibonacci retracement on your trading platform has its own features and characteristics. If constructed correctly, these lines will help you interpret the signals you receive and determine the most appropriate moment to enter the trade.
Level 1: 23.6%
This is the lower Fibonacci line. Near it, the price chart may begin to slow down and move along the trend not so actively. As a result, a slight pullback may occur on the chart. According to the observations of experienced traders, in most cases, this coefficient is not a significant obstacle to the price, and soon the trend will continue. This level can be used as an indicator that the grid is correct. It is too early to open positions because it is unclear how the price will behave, so far there are no strong confirmations.
Level 2: 38.2%
In the zone of this Fibonacci retracement, as a rule, trades in the direction of the trend begin to be opened. Let us assume that the price has passed the first level and has not reversed. It shows the strength of the trend and helps traders to conclude that the chart will probably pass at least two more following levels, the second and the third, in the chosen direction. Just be sure to wait until the chart reaches the 38.2% Fibonacci line and crosses it. This is considered a reasonable signal for placing orders. Be sure to set the Take Profit around the 50% level and the Stop Loss around 76.4%. Please note that the Fibonacci retracement does not always work out. No trading strategy guarantees you a profit.
Level 3: 50%
If the trend wasn't strong enough, once it reaches the third level, it won't be able to break it out, making a resistance level here. Traders watch this level most attentively, for if the price reverses from it, two options are possible: either the chart movement in the channel between the first and the third level or Fibonacci retracement and subsequent movement in the direction of the trend. Then it will already secure its status as a strong one.
Level 4: 61.8%
Even when a strong trend reaches this level, it has a good chance of reversing. However, if it manages to hold and break out the fourth Fibonacci line, it means it is possible to place trades in the direction of the general movement. Most likely, the reasons for such a confident trend lie in the big players who came to the market. Or - one by one the fundamental news comes out, spurring this movement and confirming it.
Level 5: 76.4%
This is one of the most frequent marks for setting the Stop Loss and Take Profit. Accordingly, we should be prepared for the fact that when the price reaches this level, a large number of trades will be closed, and a noticeable price pullback may follow. However, if the trend does manage to survive this correction, then, judging by historical data, it has a good chance to go further and conquer the 100% level.
Level 6: 100%
If the trend is so confident that it has reached the last level of the Fibonacci retracement, then we can already count on the reversal and a new trend in the opposite direction. Perhaps not immediately, but after some time the price usually reverses. Potentially, a pending order in the opposite direction can trigger. Of course, be sure to accompany it with Stop Loss and Take Profit levels.
Experienced traders who have repeatedly used the sequence of Fibonacci numbers in their trading, begin to build horizontal lines by themselves, by hand, placing them "by eye". Traders argue that the market is a living structure and theoretical levels do not always reflect the whole picture and do not work out very well.
This is a controversial point: not the fact that the hand-drawn Fibonacci retracement will be more accurate than the principles of the golden ratio.
This method has its fierce opponents, who do not get any effect from trading along the Fibonacci retracement, preferring the support and resistance levels. They are not just imposed on the chart, and specifically drawn on the two upper and lower sides of the Japanese candlesticks. That is, they take into account the current picture and the balance of power.
If it seems to you that the stretched Fibonacci retracement is detached, and the real chart is located separately, and they do not correlate with each other in any way, there can be several reasons:
- You have drawn the retracement incorrectly;
- There is no trend on the chart at the moment (and this is a trend indicator);
- The trend is present, but its strength, as well as the strength of the market volatility, is not enough to obtain results.
Try to replace the Fibonacci indicator this time with support and resistance levels or other indicators such as SMA and Stochastic.
How to Draw Fibonacci Retracement?
First of all, we need to understand the essence of this indicator. Fibonacci retracement is also called price correction levels. It means that the chart goes through them, reaches a certain level, collides with it, and pulls back a bit (either to the previous level or not reaching it).
So, experienced traders do not recommend opening trades against the current trend, on a pullback, precisely because the depth of each correction is completely unpredictable and depends solely on the momentary supply and demand in the market. And getting specific trend continuation signals through a breakout of the Fibonacci retracement is a clearer reason to open a position. Let us repeat that no trading strategy guarantees a result.
And so, to begin with, you determine what the trend on the chart: sideways, upward, or downward. Only the last two options are suitable for the placement of the Fibonacci retracement.
If you are facing an uptrend, you look for the minimum point on the chart from which the price went up. If the trend is descending, you look for the maximum point from which the chart is headed downward. It is from the extreme side of the selected Japanese candle that you will pull the Fibonacci retracement.
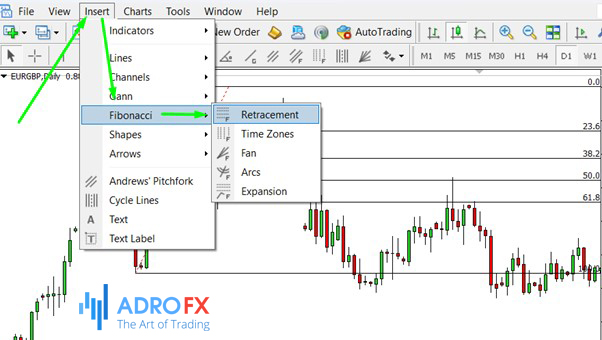
You will find the indicator in the top menu of the toolbar: Insert - Fibonacci - Retracement. Now, hold down the left mouse button and pull out the grid to the price reversal level (the moment of correction). The 100% level will be located there. Focusing on internal Fibonacci levels, you can build a forecast of what moment the price will decide to reverse again and continue the trend. It is recommended to work with this indicator in two time frames at once: lower (M30 or H1) and higher (for example, H4).
If you are facing a downtrend, you must find the maximum price level and stretch the grid, holding down the left mouse button, until the correction of the chart.
It may happen that you will immediately, with the naked eye, see a few moments when the price has already pulled back, and then regained strength and continued to follow the direction of the trend.
Then the Fibonacci retracement can be set differently: the mark of the first price pullback is 23.6%; the second - 38.2%; the third - 50%. The other levels will be set automatically.
It is critical not to open a position immediately after the price has touched a level, or even more so when it starts to move away from it in the opposite direction. There is a very thin line here when the arrogance of the trader cannot resist the pressure of the market and unpredictable supply and demand.
The main helpers confirming the Fibonacci retracement signals are support and resistance levels, as well as reversal and trend continuation candlestick patterns.
You can open four chart windows of the same asset on your trading platform. The first window will be a lower time frame with the Fibonacci retracement. The second window will have a higher time frame with a grid, and the two charts below them are exactly the same, but without indicators (except for the support/resistance levels). On these, you will be able to look at the candlestick patterns with your fresh eyes: this is more comfortable because the indicators will not overlap you in the overall picture. That way you can make more informed and confident decisions about the continuation of the trend. Be sure to test such a strategic combination on a demo account.

How to Trade Fibonacci Retracement?
Experienced traders believe it's extremely presumptuous to use the Fibonacci retracement without considering the market context. This is why they look for so-called swings on the chart: combinations of three Japanese candles, in which the candles on the right and left are the highs of the chart (in the case of an up trend), or the candles on the right and left are the lows (in the case of a downtrend). This additionally indicates a reversal of the current trend.
On an uptrend
The use of Fibonacci retracement on an uptrend assumes that you will stretch the grid from bottom to top: 0 on the bottom and 100 on the top. The price will reach the lined levels, correct down to the previous Fibonacci line, rebound from it, and continue its way further in the direction of the trend.
Until the swing reversal pattern is formed:
- from the candle, which reached its maximum level;
- the second of any candle;
- and another high.
Such a swing will most likely occur near one of the Fibonacci levels: 50%, 61.8%, 78.6%, or 100%. It's as if the price is trying to break out of an invisible ceiling, but it fails. The next red candle may be a signal for a global reversal of the chart.
On a downtrend
An opposite mirror situation with a downtrend. According to the recommendations, the use of Fibonacci retracement on a downtrend assumes that you will stretch the grid from top to bottom: 0 at the top, and 100 at the bottom.
You should wait for the formation of a three-candle swing pattern:
- the one that will be the low of the chart;
- the second any;
- and the third, which will also test the low.

About AdroFx
Established in 2018, AdroFx is known for its high technology and its ability to deliver high-quality brokerage services in more than 200 countries around the world. AdroFx makes every effort to keep its customers satisfied and to meet all the trading needs of any trader. With the five types of trading accounts, we have all it takes to fit any traders` needs and styles. The company provides access to 115+ trading instruments, including currencies, metals, stocks, and cryptocurrencies, which make it possible to make the most out of trading on the financial markets. Considering all the above, AdroFx is the perfect variant for anyone who doesn't settle for less than the best.
Related Articles


Latest updates
Latest updates


Technical Analysis
Latest updates


