What Is a Doji Candle Pattern, and What Does It Tell You?
Candlestick analysis, as part of forex technical analysis, offers a wide range of different patterns for determining the continuation of a trend or market reversal. A special place in it is occupied by the Doji candlestick. But it has many different variants, and each has its own definition in the market. Today we will look at all types of Doji candles and learn some helpful tips for their application in forex trading.
What Is a Doji Candle Pattern?
The original Japanese candlestick patterns were developed from the 1600s for the rice commodity exchange of that era.
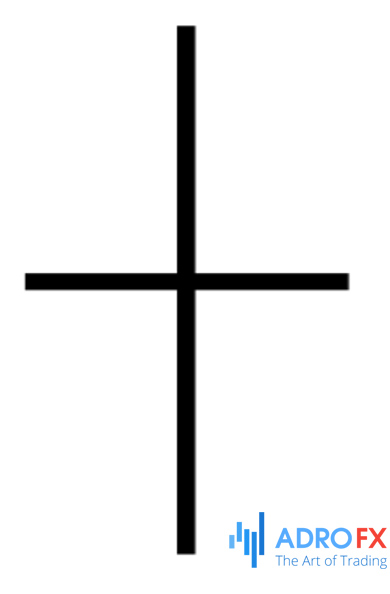
Doji candlesticks are elements of technical analysis, which can be useful in finding the tops and bottoms of the trading channel. The candlestick looks like this:
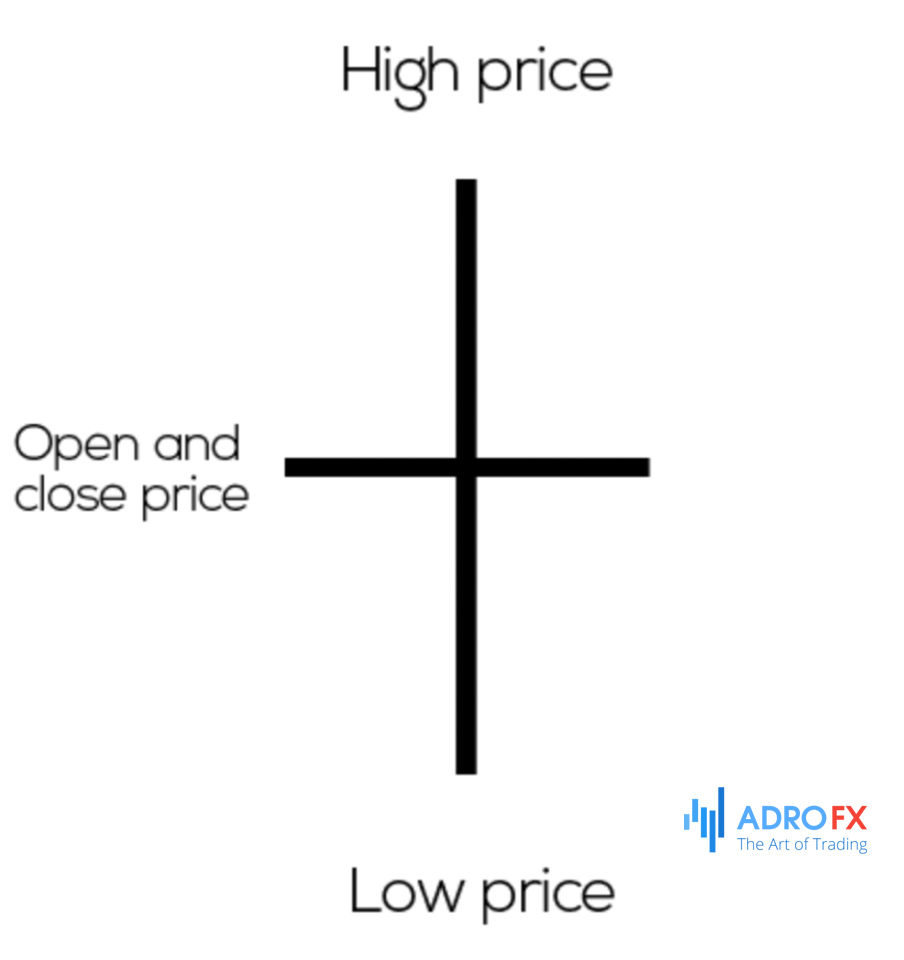
The Doji candlestick is an uncertainty pattern. Its distinctive feature is the fact that the closing price completely coincides with the opening price (or almost completely, the variants, in which the closing price is very close to the opening one, are also considered).
Unlike most candlestick patterns, Dodji does not belong to any particular class of patterns. They can be either reversal patterns or indications of the continuation of a trend.
If this candlestick pattern appears at the end of a bullish trend, it can mean that the bulls are losing strength.
Peculiarities of Trading Doji Candle Pattern
Unlike many other candlestick patterns, it is very important to pay attention to the candlesticks that precede and follow this pattern. For example, if Doji is surrounded by similar candlesticks with long shadows and a short body, you should not pay much attention to them. In this case, the market is likely to be in a consolidation stage and can stay in it for some time.
If the Doji appears after a candlestick with a long body, and it is also followed by a candlestick with a long body, the pattern can be worth paying attention to. Especially if it is located at the support or resistance level.
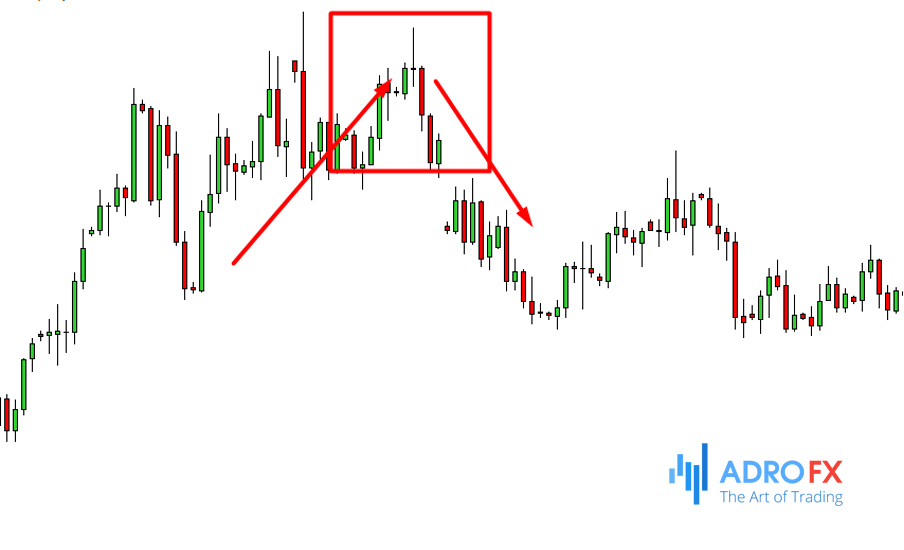
The screenshot above shows an example, which perfectly reflects the essence of working with the Doji pattern. The price has been rising for some time and reaches a local maximum. It shows a Doji candlestick with long shadows, which tells us that the market is uncertainty. The long shadow up tells us that the buyers made an attempt to break higher, but it was unsuccessful.
Sellers also tried to go lower at this level, but they failed. Next, we look at the next candlestick. It is bearish, which clearly indicates a rebound from the local high at the resistance level. Consequently, we can open a trade with the expectation of making a profit from a further downward movement. As we can see in the example, the price is in fact continuing to decline and reaches the support level.
How may this situation be explained?
The fact is that the trend starts to form and then develops when there is a difference between the supply and demand for the asset. For example, if it is an uptrend, it is accompanied by the appearance of candlesticks with a long body. An imbalance in the demand side pushes the value of the asset up. But at a certain part of the chart demand and supply find a balance. This is where the Doji appears. But this candle itself does not indicate that in the future, the balance will shift to the supply side, that is, the uptrend will be broken out, and the reversal will begin.
It is important to pay attention to exactly where the Doji is forming. It is best if it will be a resistance or support level. Moreover, the shadow of this candle may go beyond the level. It is important to wait for the close of the candle to make any decisions.
Types of Doji Candle Pattern
Let's take a closer look at each of them.
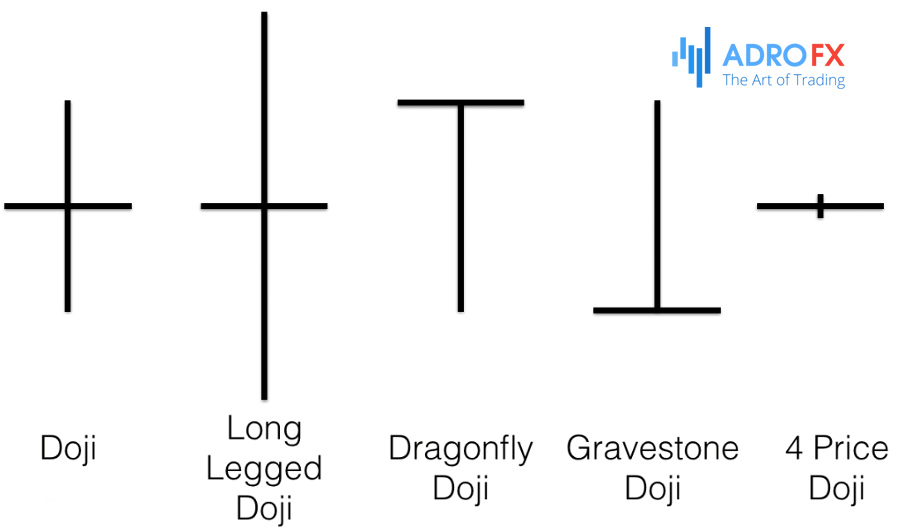
Different Doji candlestick patterns
The Long-Legged Doji
A long-legged Doji or rickshaw is a candle with very long shadows and a very short body or a horizontal line instead of a body. The example shows just such a pattern. As noted above, the pattern is not a reversal one and by itself does not indicate a continuation of the trend. It only works in conjunction with other candlesticks.
We can clearly see from the experience that the Doji does not reverse the trend, but its appearance precedes the start of a corrective movement of the asset.
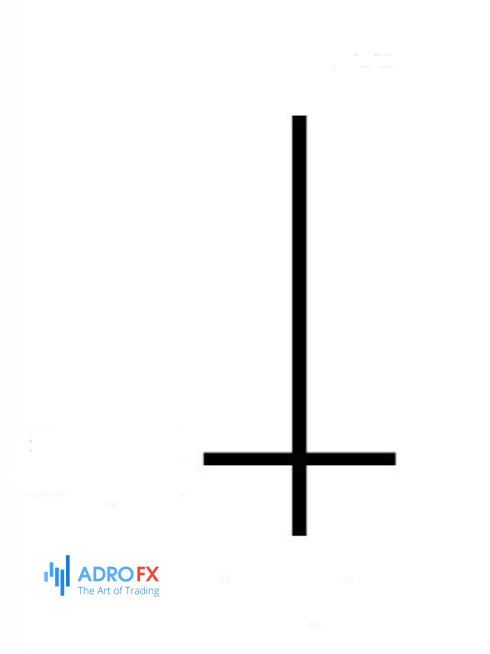
Dragonfly
The Dragonfly Doji candlestick is a very interesting and very rare pattern in any market. The pattern appears usually at the level of support. Its unusual nature lies in the fact that the opening, closing, and maximum prices coincide here. That is, the sellers are unable to gain an advantage and cannot continue the downward trend.
The dragonfly clearly indicates that the downtrend is coming to an end, and either a correction or a market reversal may start. By the way, the same candle can also appear at resistance levels.
Gravestone
This pattern is the complete opposite of the dragonfly. It is most often found at the top of an uptrend. Its essence is that buyers are attempting to break out an important level, but they don't succeed. As a result, they pull back, and the trend reverses.
Four Price Doji
This pattern is very rare on a chart. It is formed when all 4 prices (open, close, minimum, and maximum) coincide.
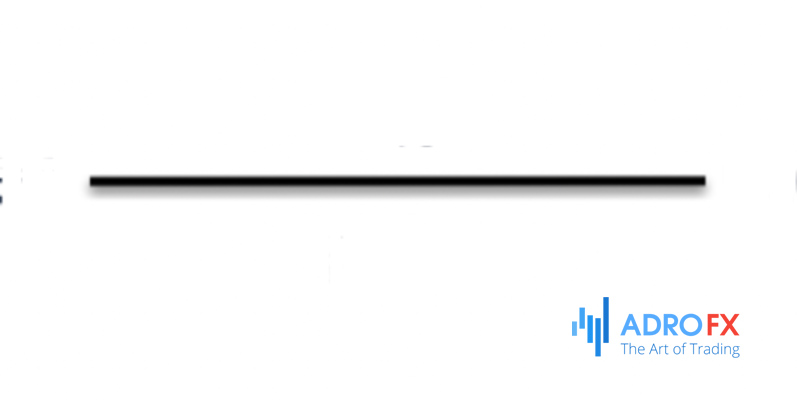
This happens either at very low-liquid assets or when the liquid market volumes drop, for example, during holidays or after the session closes. This candle is quite often seen in the minute time frames, but it is not recommended to analyze it there.
Tips for Trading Doji Candle Patterns
Let's summarize what you should pay attention to when working with Doji:
- it should be located near an important support/resistance level;
- the presence of a preceding trend, after which the market finds a balance between supply and demand in the form of a Doji candle;
- it is necessary to wait for confirmation in the form of a candle, which will be the opposite of the previous trend;
- in the absence of a clear trend, Doji is not worth considering;
- the Doji candlestick must be the only one, in the case of the accumulation of such patterns, it is not worth considering the situation.
The ability to read the signals of these patterns can make trading much more successful, and reduce the risk of opening losing trades. Traders in Japan believe that candlestick analysis is a very valuable signal for actions aimed at saving the deposit or increasing it. Those who know how to analyze Doji will always be able to earn with the help of these signals.

About AdroFx
Established in 2018, AdroFx is known for its high technology and its ability to deliver high-quality brokerage services in more than 200 countries around the world. AdroFx makes every effort to keep its customers satisfied and to meet all the trading needs of any trader. With the five types of trading accounts, we have all it takes to fit any traders` needs and styles. The company provides access to 115+ trading instruments, including currencies, metals, stocks, and cryptocurrencies, which make it possible to make the most out of trading on the financial markets. Considering all the above, AdroFx is the perfect variant for anyone who doesn't settle for less than the best.
Related Articles

Latest updates
Latest updates


Technical Analysis
Latest updates


