Understanding Balance of Power Indicator

In the dynamic realm of financial markets, where the interplay between buyers and sellers is akin to an intricate dance, traders and analysts wield an array of tools to navigate these complexities. Among these tools, the Balance of Power (BOP) Indicator emerges as a pivotal component of technical analysis. This article endeavors to illuminate the nuances of the Balance of Power Indicator, including its calculation, significance in assessing market dynamics, applications, strategies, and considerations. As we delve into its intricacies, traders will gain valuable insights, equipping them for more informed decision-making in the ever-evolving world of trading.
What Is the Balance of Power Indicator?
The Balance of Power Indicator stands as a technical analysis tool integral to financial markets, offering a lens through which traders and analysts gauge the strength of buyers and sellers within a given market. Calculated using the formula:

Here:
- Close is the closing price of the period.
- Open is the opening price of the period.
- High is the highest price reached during the period.
- Low is the lowest price reached during the period.
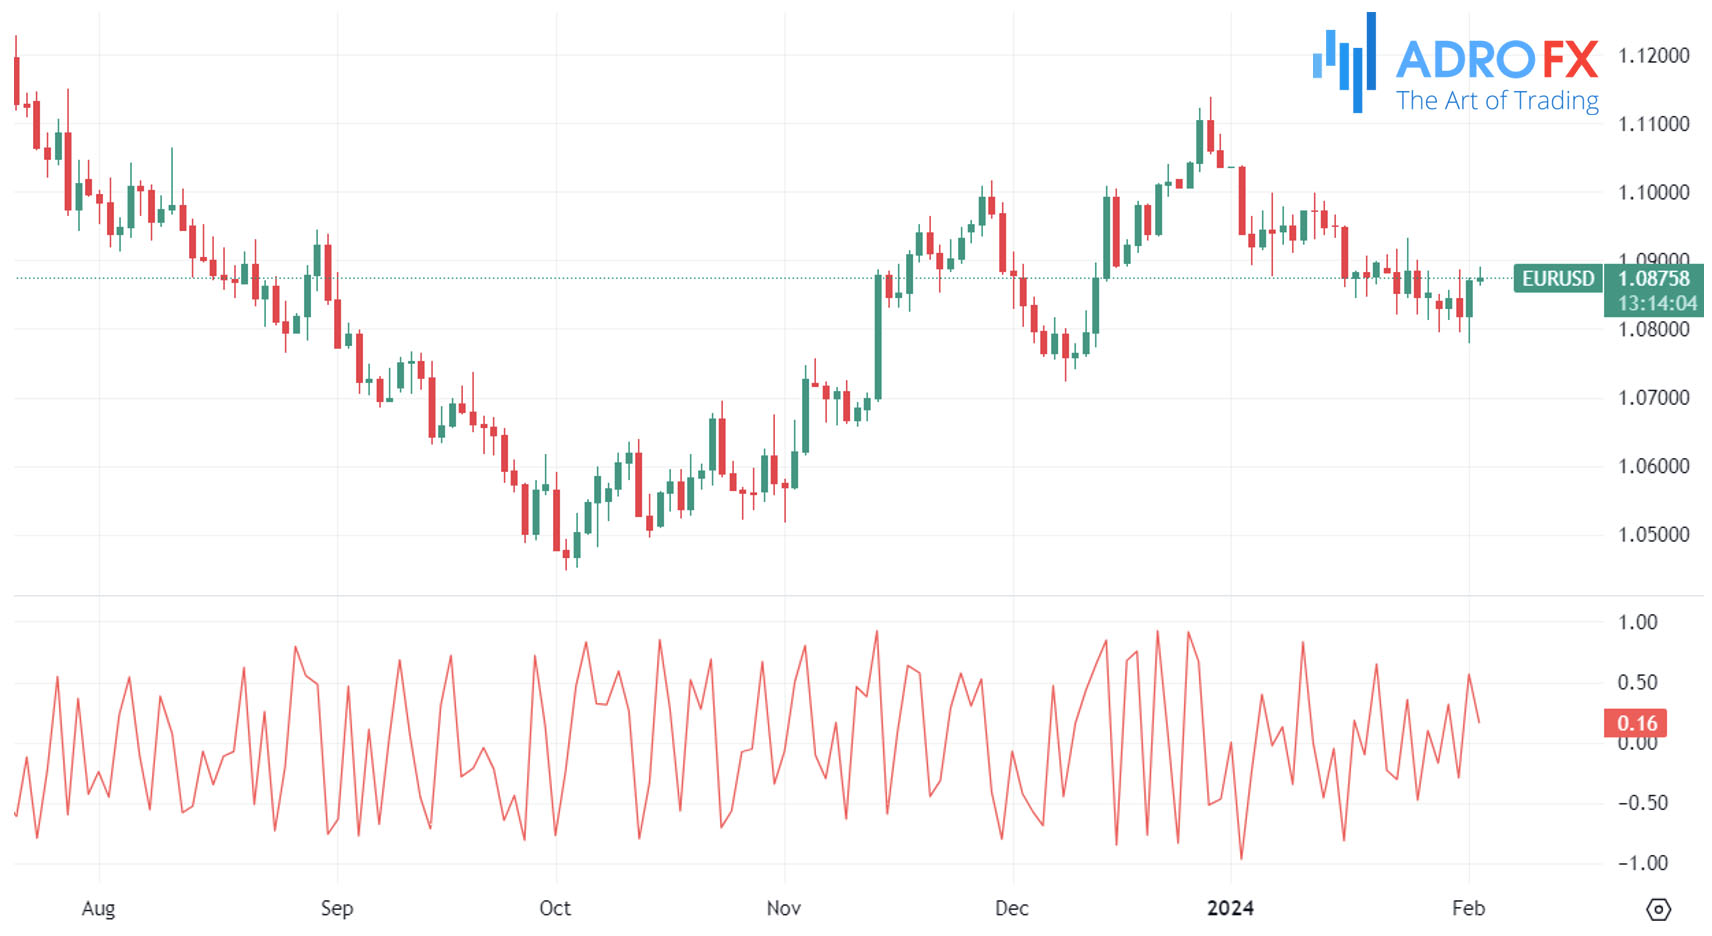
Resulting values can range from -1 to 1, portraying the dominance of either buyers or sellers. A positive BOP signifies buyer control, while a negative BOP suggests seller dominance. The proximity of the BOP value to 1 indicates robust buying pressure and proximity to -1 signifies formidable selling pressure. Traders often deploy the Balance of Power Indicator to validate trends or anticipate potential reversals. However, its effective use mandates a consistent approach with other analytical tools to ensure a comprehensive assessment of market conditions.
Here is how it looks on the chart:
How to Use the Balance of Power Indicator
The BOP Indicator serves as a compass for traders and analysts, providing insights into the strength of buyers and sellers within a market. A consistent approach involves:
- Understanding Trends
Positive BOP values confirm uptrends, while negative values validate downtrends. Traders often integrate BOP with other trend indicators for a more comprehensive analysis.
- Spotting Reversals
Significant divergences between price and BOP can signal potential reversals. For instance, a rising price with a falling BOP during an uptrend may indicate weakening buying pressure and an impending reversal.
- Confirming Breakouts
BOP confirms the strength of breakouts. Rising BOP during an upside breakout or falling BOP during a downside breakout may indicate the sustainability of the new trend.
- Divergence Analysis
Traders scrutinize divergences between price movements and BOP. Positive divergence may suggest weakening selling pressure, while negative divergence might imply weakening buying pressure.
- Volume Confirmation
Combining BOP with volume analysis provides additional confirmation. High positive BOP with increasing volume during an uptrend or high negative BOP with increasing volume during a downtrend reinforces buying or selling interest, respectively.
- Use with Other Indicators
BOP achieves optimal effectiveness when used alongside other technical indicators and chart patterns. Integrating it with moving averages, support/resistance levels, and other indicators offers a more comprehensive view of market conditions.
It is crucial to note that while the BOP Indicator is a valuable tool, no single indicator guarantees infallible predictions. Traders should consider multiple factors, practice in a demo or paper trading environment, and thoroughly understand the BOP Indicator's behavior across various market conditions before implementing it in live trading.

Balance of Power Strategies
The Balance of Power plays a pivotal role in diverse trading strategies, assisting traders in identifying trends, potential reversals, and assessing the overall strength of market movements. Consistent terminology usage is crucial for clarity and coherence. Key strategies include:
- Trend Confirmation
Observing the consistency of BOP values to confirm uptrends (consistently positive BOP) or downtrends (consistently negative BOP). Additional technical tools should be employed to validate identified trends.
- Identifying Trend Reversals
Traders seek divergences between price and BOP to identify potential reversals. Divergences signal weakening buying or selling pressure, necessitating confirmation from other indicators or price action before making reversal trades.
- Confirming Breakout Strength
Checking if BOP aligns with price movements during breakouts enhances the reliability of breakout signals. Combining this with volume analysis reinforces the strength of the breakout.
- Overbought/Oversold Conditions
Extreme BOP values may suggest overbought or oversold conditions. However, caution is advised, and combining BOP with other indicators helps avoid false signals.
- Price Divergences Confirmation
Assessing if BOP confirms divergences observed in other indicators. While powerful, divergence confirmation should be exercised cautiously and in conjunction with other analysis methods.
- Combining with Moving Averages
Integrating BOP with moving averages helps smooth out signals, facilitating the identification of stronger trends.
- Volume-Backed Price Movements
Using BOP alongside volume analysis to confirm price movements. Strong BOP moves, when corroborated by increasing volume, instill higher confidence in the validity of the price movement.
It is paramount to reiterate that no single indicator ensures success. Traders should deploy the BOP Indicator in tandem with other technical analysis tools, consider the overall market context, and implement thorough backtesting and risk management in their trading strategies.

Pros and Cons of Using Balance of Power
Pros of utilizing the Balance of Power Indicator include its simplicity in interpretation, providing a swift means to identify buying and selling pressure. It effectively confirms trends, aids in recognizing potential reversals, and can be integrated with volume analysis for enhanced insights. Moreover, its compatibility with various technical indicators contributes to a comprehensive market analysis.
On the flip side, the cons involve BOP's sensitivity to price movements, potentially leading to false signals in choppy or ranging markets. The lack of universally defined threshold levels for overbought or oversold conditions introduces subjectivity in interpretation. BOP is not a standalone tool and is most effective when used alongside other indicators and chart patterns. Its absence of a specific price scale limits its ability to provide exact entry or exit points. Historical data analysis may be less effective with BOP, primarily focusing on recent price movements. Lastly, like any technical indicator, BOP is not foolproof and may produce inaccurate signals, necessitating a comprehensive approach to trading decisions. Traders should carefully weigh these factors based on their trading style, preferences, and risk tolerance when incorporating the Balance of Power Indicator into their strategies.
Conclusion
In the ever-evolving landscape of financial markets, the Balance of Power Indicator emerges as a valuable ally for traders seeking to navigate the complexities of buyer-seller dynamics. Its role in confirming trends, identifying potential reversals, and gauging the strength of market movements is underscored by its simplicity and compatibility with other technical tools. However, like any tool, the Balance of Power Indicator is not without its challenges. Sensitivity to market fluctuations, subjectivity in interpretation, and the absence of precise entry and exit points call for a cautious approach. As traders embark on incorporating the Balance of Power into their strategies, it is imperative to remember that success lies in a holistic approach, combining various indicators and prudent risk management practices for a well-rounded trading journey. To maximize the benefits of the Balance of Power Indicator, traders are encouraged to apply their newfound knowledge actively, transforming theoretical insights into actionable strategies that can elevate their overall trading performance.

About AdroFx
Established in 2018, AdroFx is known for its high technology and its ability to deliver high-quality brokerage services in more than 200 countries around the world. AdroFx makes every effort to keep its customers satisfied and to meet all the trading needs of any trader. With the five types of trading accounts, we have all it takes to fit any traders` needs and styles. The company provides access to 115+ trading instruments, including currencies, metals, stocks, and cryptocurrencies, which make it possible to make the most out of trading on the financial markets. Considering all the above, AdroFx is the perfect variant for anyone who doesn't settle for less than the best.
Related Articles


Latest updates
Latest updates


Technical Analysis
Latest updates


