Bollinger Bands Explained: The Ultimate Guide to the Best Trading Indicator
Welcome to our comprehensive guide on Bollinger Bands, a renowned and widely utilized trading indicator in technical analysis. Created by John Bollinger in the 1980s, this adaptable tool assists traders in assessing market volatility and pinpointing potential buying and selling opportunities. Whether you are involved in forex, stocks, or cryptocurrencies, mastering the use of Bollinger Bands can significantly improve your trading approach.
In this article, we will explore the intricacies of Bollinger Bands, examine various trading strategies, and offer practical advice on how to incorporate them into your trading routine. Join us as we uncover how Bollinger Bands can elevate your trading strategy to new heights!
Bollinger Bands Description
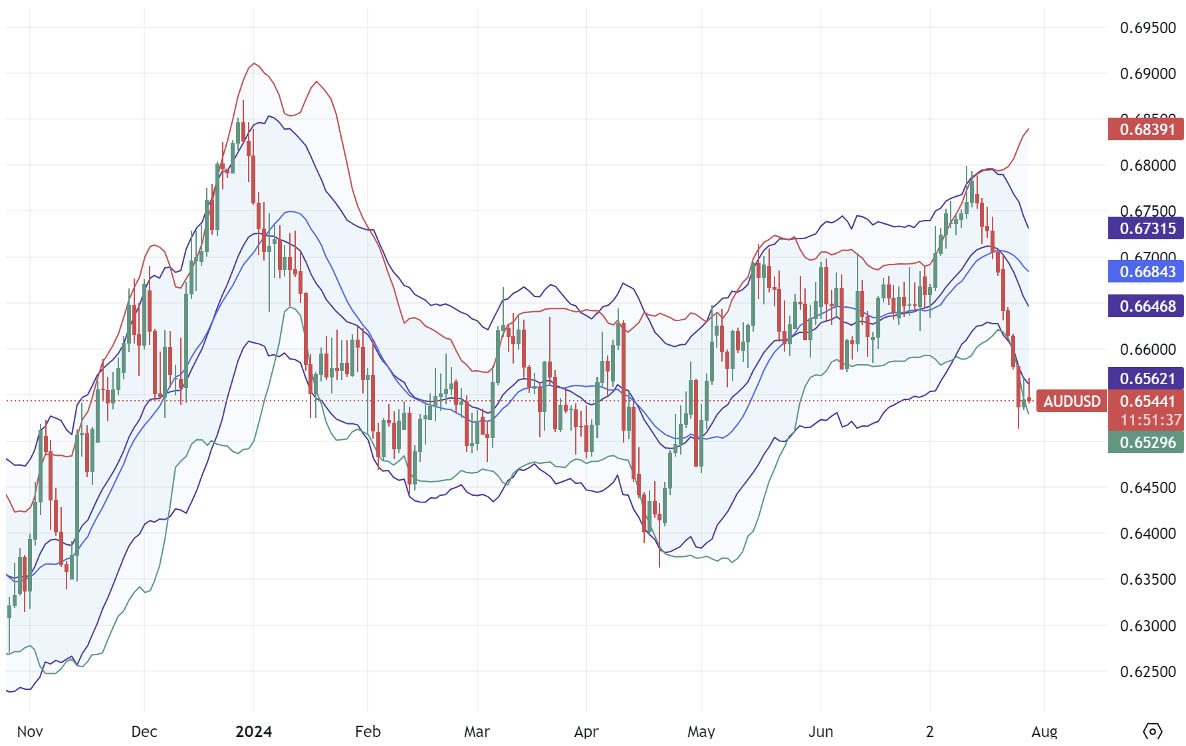
Bollinger Bands are a widely-used trend indicator known for their simplicity and effectiveness. They help determine the price location on a chart and indicate its volatility.
Created over 30 years ago, Bollinger Bands remain a relevant and accurate tool for traders of all levels. This indicator forms a corridor around price movements, providing clear signals about market conditions and potential entry points. The bands adjust their width based on volatility, expanding in stable conditions.
The indicator consists of three lines:
- Middle Line (SMA)
A Simple Moving Average, typically over the last 20 candles. - Upper and Lower Bands
These show the standard deviation from the SMA.
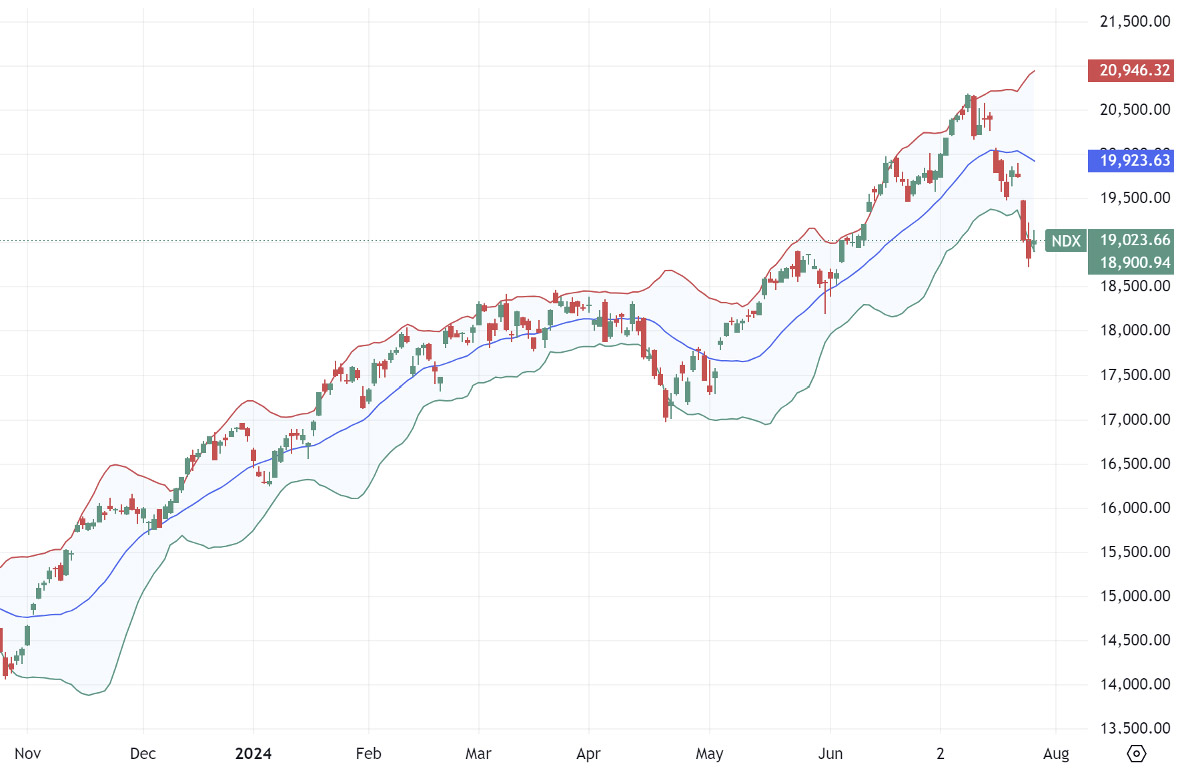
The more volatile the SMA, the wider the bands. Conversely, less volatility results in narrower bands. For stronger signals, use a longer SMA period, like 100 instead of 20, but note that longer periods generate fewer signals. The choice between the number of trading signals and their "quality" is up to you.
How To Set Up The Bollinger Bands Indicator?
Adjusting the settings of Bollinger Bands can yield significantly different outcomes. Typically, the indicator is configured using daily candlesticks, where a 20-period Simple Moving Average (SMA) corresponds to roughly a month of trading, considering that traditional markets operate for 5 days each week.
For cryptocurrency traders, it's important to note that crypto markets are open 24/7. Consequently, to accurately reflect a month of daily candlesticks, you should use a 28-period or 30-period SMA rather than the standard 20-period SMA. Therefore, adjusting the Bollinger Bands settings to align with the continuous nature of crypto trading will provide more precise results.
Also read: The Simple Moving Average Indicator Guide
Additionally, keep in mind that using a shorter SMA period will generate more trading signals, though these signals may be less reliable. Conversely, a longer SMA period will produce fewer signals, but these will be of higher quality. The standard setting for deviation in most platforms is 2, which means the Bollinger Bands are set to reflect 2 standard deviations from the SMA. Increasing the deviation number will widen the bands, reduce the number of trading signals, but make the remaining signals more robust and reliable.
Advantages of the Bollinger Bands
Bollinger Bands are a widely favored channel indicator among traders due to their simplicity and effectiveness. They don't require extensive forex knowledge to interpret; their readings are straightforward and directly related to the price movements within the bands. Suitable for various time frames and trading instruments, Bollinger Bands are accessible for beginners but are particularly popular among seasoned traders.
Similar to Envelopes, Bollinger Bands operate on the premise that prices stay within a defined channel. By analyzing the price's position relative to this channel, traders can gauge market sentiment and identify profitable trading opportunities. The Bands can signal trends during periods of volatility when the channel widens or contracts. Key features include tracking value changes after low volatility phases, assessing market sentiment when prices are outside the channel, and spotting reversals when price extremes occur outside the channel followed by corrections within it. Additionally, the channel can act as support or resistance levels.
However, like the traditional Moving Average, Bollinger Bands have a lagging nature, which becomes more pronounced with longer periods. Despite this, many traders successfully integrate Bollinger Bands into their strategies by mitigating its weaknesses and leveraging its strengths.
When used correctly, Bollinger Bands offer valuable insights into market trends, their formation, potential reversals, and flat market conditions. Testing the Bands on a demo account before trading with real money is advisable to understand their dynamics and apply them effectively.
Bollinger Bands Readings
To assess the market phase using the indicator, check the band width. A narrow range suggests a flat market with potential for a strong move when it breaks. Use other tools to confirm direction. Typically, prices move between the upper and lower bands, so if near one, the opposite is likely the target. Confirm with other indicators before entering a trade.
The lower band serves as support and the upper band as resistance. If these levels align with horizontal support/resistance, the signal is stronger. Reversals can be signaled by two local highs/lows at trend extremes, with the first outside the Bollinger range and the second inside. This indicates trend weakness.
For continuation signals, a candle closing below the upper band (uptrend) or above the lower band (downtrend) suggests the trend will persist. Enter trades after price moves beyond the bands, with riskier counter-trend trades requiring caution. Reversals may be signaled by candles closing beyond the bands in the opposite direction.
Trading strategies include placing pending orders outside narrow channels or trading between borders, ideally with confirmation from oscillators like MACD or Stochastic.
How to Understand if the Market is Trending or Ranging?
The market is in a range when the price does not cross the upper and lower Bollinger bands within a certain period. In this case, the upper Bollinger band becomes a local resistance level and the lower Bollinger band becomes a support level.
- If the price is constantly above the SMA and reaches the upper band for a long period of time - the market is in an uptrend. If the price remains below the SMA and reaches the lower band - the market is in a downtrend.
How to Use Bollinger Bands?
Trading with Bollinger Bands requires first determining whether the market is trending or ranging. It’s important to note that Bollinger Bands are rarely used in isolation. John Bollinger himself recommends combining this indicator with others such as the Relative Strength Index (RSI), the Moving Average Convergence Divergence (MACD), or the On-Balance Volume (OBV) to enhance its effectiveness.
For additional clarity, the Bollinger Band Width oscillator can be useful. This tool helps visualize the trend in price volatility, providing a clearer view of market dynamics.
Bollinger Bands for Range Trading
Bollinger Bands are particularly effective for range trading, especially over shorter time frames like those used in scalping. The indicator defines a range with upper and lower bands, allowing traders to make buy or sell decisions when the price touches these bands. When scalping, it is common to take profits as the price nears the Simple Moving Average (SMA) rather than waiting for the price to reach the opposite band. Placing the Take Profit level at or near the SMA line, or at the opposite band for a more aggressive strategy, can increase confidence and simplify trading in a range.
Bollinger Bands for Breakout Trading
In breakout trading, Bollinger Bands are valuable for assessing market volatility. When the market has been range-bound for an extended period, volatility typically decreases, causing the bands to narrow. This "compression" often precedes a significant price movement, or breakout.
The strategy here is to buy when the price breaks above the upper band and sell when it breaks below the lower band. However, professional traders often wait for confirmation before acting. A more reliable bullish breakout is identified when at least three consecutive candlesticks close above the upper band.
For managing risk, placing a Stop Loss at the 20-period SMA is recommended. If the price moves favorably, consider taking profits when the candlestick closes below the 20 SMA or when volatility seems to peak. This approach helps to secure gains and adapt to changing market conditions.
Also read: How To Read Forex Charts: Graphical Analysis Of The Market
Bollinger Bands + Heiken Ashi
An intriguing and highly effective system that can significantly enhance trading efficiency and profitability involves leveraging classic, robust tools. This approach utilizes the renowned Bollinger Waves in conjunction with the Heiken Ashi chart to provide clear and precise data, minimizing the impact of minor price fluctuations. This system is particularly suited for wave trading, and its performance is notably improved when combined with Bollinger Bands.
To initiate short positions, the system signals that the price should be at the upper edge of the Bollinger Bands. Once the price touches or exceeds this upper boundary and then returns within the bands, a red Heiken Ashi candle crossing the middle channel line indicates the potential entry point. You can place a trade when the candle in the lower half of the Bands closes. For long positions, the procedure is reversed, following a similar pattern but in the opposite direction.
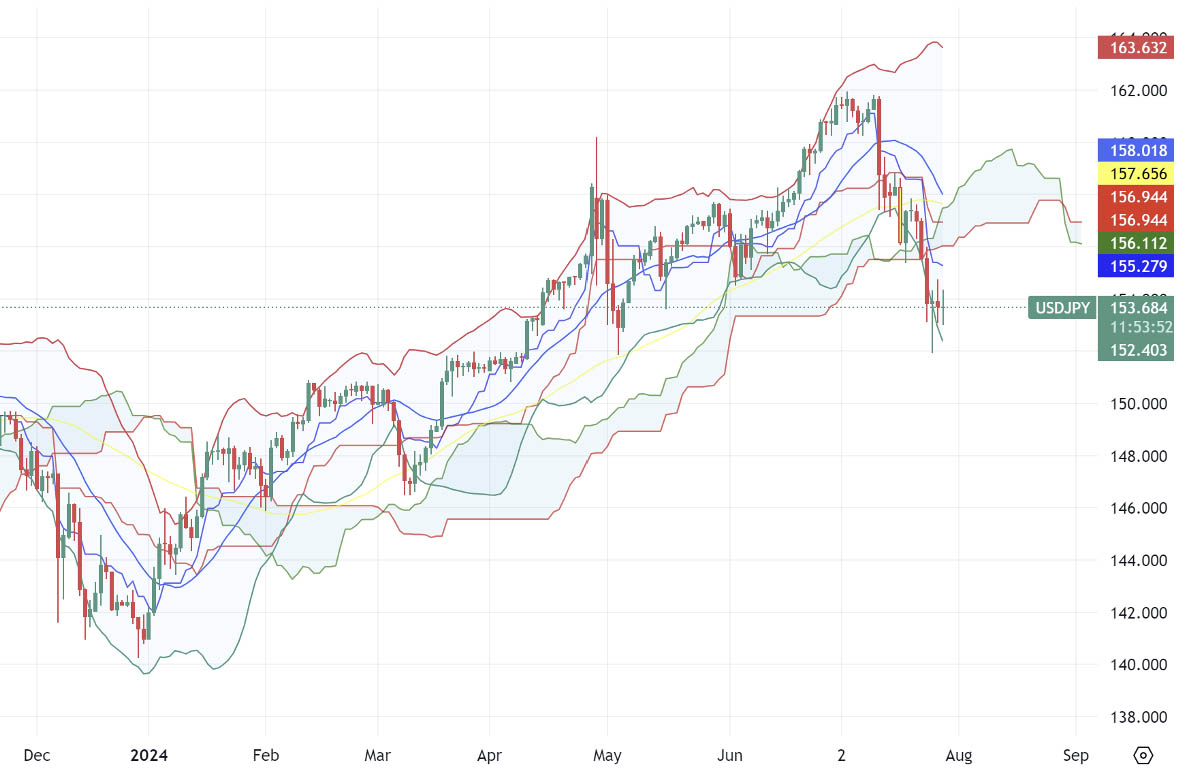
Bollinger Bands + Keltner Channel
The Keltner Channel is a technical indicator that, while similar to Bollinger Bands, offers a distinct approach to measuring market volatility. Many traders use both indicators together to enhance their market analysis and obtain more reliable trading signals. Despite their common goal of assessing volatility, the Keltner Channel and Bollinger Bands differ in their calculation methods.
Unlike Bollinger Bands, which are more sensitive to price fluctuations, the Keltner Channel responds more gradually to changes. This indicator features three lines, with the central line based on the Average True Range (ATR) instead of a Simple Moving Average (SMA). The ATR is calculated by taking the difference between the highest and lowest prices over a designated period, often set to 20 periods.
The upper and lower bands of the Keltner Channel are established by multiplying the ATR by a factor, usually 2, and then adding or subtracting this value from the central line. This method creates a more stable range compared to Bollinger Bands.
For optimal use of both Bollinger Bands and the Keltner Channel, it is important to align their settings. Integrating these indicators can provide a fuller perspective on market conditions, leading to more informed and precise trading decisions.
Conclusion
Bollinger Bands are a dynamic and versatile tool for traders aiming to enhance their market analysis and refine their trading strategies. They are particularly valuable for measuring volatility and spotting potential trading opportunities, making them indispensable for both beginner and experienced traders. Mastering the setup and interpretation of Bollinger Bands allows you to gain a clearer understanding of market trends, volatility, and possible entry and exit points.
Whether you're employing range trading, breakout strategies, or combining Bollinger Bands with other indicators like Heiken Ashi or Keltner Channels, they offer a solid framework for making well-informed trading decisions. While Bollinger Bands are a powerful asset, it’s important to use them alongside other analytical techniques and maintain disciplined risk management practices to maximize their effectiveness.
Ready to take your trading to the next level? Start applying Bollinger Bands to your trading strategy today and see the difference for yourself. If you're new to trading, consider opening a demo account to practice without risk. For more in-depth articles and expert trading tips, subscribe to our newsletter and stay updated with the latest trends and strategies in the trading world. Happy trading!

About AdroFx
Established in 2018, AdroFx is known for its high technology and its ability to deliver high-quality brokerage services in more than 200 countries around the world. AdroFx makes every effort to keep its customers satisfied and to meet all the trading needs of any trader. With the five types of trading accounts, we have all it takes to fit any traders` needs and styles. The company provides access to 115+ trading instruments, including currencies, metals, stocks, and cryptocurrencies, which make it possible to make the most out of trading on the financial markets. Considering all the above, AdroFx is the perfect variant for anyone who doesn't settle for less than the best.
Related Articles

Latest updates
Latest updates


Technical Analysis
Latest updates


