Best Forex Fundamental Indicators Explained
Economic indicators are reports that include financial and economic data that are published by government agencies and private entities regularly. These data help market observers track the current state of the economy and make their predictions, which most financial market participants will then rely on.
Because many people tend to react to the same information in similar ways, economic indicators have enormous potential to generate trading volume and influence prices. At first glance, it would seem that to interpret all of these indicators correctly, one would need to have a degree in economics. In reality, however, forex traders should only adhere to a few simple principles to make good trading decisions based on this data.
In this article, we will talk about the most important economic indicators, learn how to track the data releases, and will get acquainted with some of the theoretical methods.
The Best Forex Fundamental Indicators
The value of a currency neither increases nor decreases indiscriminately. It depends directly on the economic potential of a country and the confidence it generates. Specific key indicators are used to assess this potential. When placing orders in the forex market, it is necessary to constantly monitor these indicators, because any change in them entails a change in the price of the currency. The currency acts as an authorized representative of the state and allows to analyze of the economic potential of this state.
The release of fundamental indicators is becoming more and more of a market engine. If we focus on the influence that economic data has on forex prices, then some indicators that are tracked most closely due to their potential to drive forex prices will come into the foreground.
The market is most influenced by the following indicators:
- Indicators of the general economic condition of the country (GDP and GNI, consumer and producer price indices, inflation rate, interest rate, balance of trade);
- Employment indicators (unemployment rate, applications for unemployment benefits);
- Industrial production indicators (business and industrial production index, Non-Farm Payroll, new home construction, and durable goods orders);
- Indicators of the general economic condition of the country.
The main indicator is the gross domestic product. All other data are interpreted in terms of whether there are problems in the economy and what impact they will have on production levels. GDP is published every quarter, and forecasts of its dynamics are updated every month. Gross Domestic Product is the number of goods produced in a country's territory over a certain period. One of the most famous ways of calculating GDP is by expenditures. According to it, GDP is the sum of consumer sector spending, government spending, investment, and net exports (the difference between exports and imports). This structure makes it clear that GDP growth should not always be interpreted positively. When it rises due to an increase in government spending, the exchange rate can easily go down. This is because the list of such expenditures includes the military, which in the long term can destabilize the economy in the country.
Gross national income is considered less frequently than GDP, but it is representative of the volume of production by residents of a given country only. Comparison of GNP with GDP allows us to clearly see who earns more: residents of a given country, working outside the country, or non-residents, whose enterprises operate within the country.
The level of inflation in the country and, accordingly, the degree of depreciation of the national currency can be tracked using several indicators: the consumer price index CPI, the producer price index PPI and the inflation rate.
CPI reflects the cost of the consumer basket, which includes the most essential goods and services. The producer price index (or industry price index), unlike the CPI, does not include retail markups, as well as prices of imported goods. Each month, this indicator reflects the increase in prices for semi-finished goods, components, and finished goods.
The interest rate set by the central bank is an indicator of the economic situation in the country.
If an increase in inflation is accompanied by an increase in interest rates, it can be assumed that the country's economy has medium or long-term problems which cannot be resolved by market forces. From the investors' point of view, an increase in the rate leads to an appreciation of the national currency, while a decrease leads to its depreciation.
A country's trade balance reflects the ratio of foreign goods imported into the country to the volume of goods imported.
If a country's exports exceed imports, its national currency appreciates and vice versa. You can analyze the dynamics of the trade balance. Sometimes the dynamics of import and export prices and the current account deficit are also used for analysis.
Labor Market and Employment
When analyzing a country's economy, one cannot ignore the unemployment rate and the number of applications for unemployment benefits. Even though these indicators are lagging, they allow a more complete picture of the state of the economy. The unemployment rate is calculated as the ratio of the number of unemployed to the total working-age population (which in turn includes only people who are interested in looking for work, excluding those who are studying, those who are not working, etc.). The weekly publication of the number of applications for unemployment benefits makes it possible to quickly assess the employment rate of the population in dynamics. It should be remembered that this indicator is subject to seasonal fluctuations, so it is most often used as a reference and does not cause strong fluctuations in the market.
The labor market is traditionally a sphere in which supply and demand for labor resources - labor power, workers - are formed. And modern labor markets tend to develop on the principles of free competition. Free competition is determined and protected by economic principles - from the political structure of the country to the assessment of the environmental situation in the region.
A thriving labor market indicates a bullish trend for the national currency.
A weak labor market, unemployment, and rising benefits indicate a bearish trend.
The most famous and significant indicator, which is used as a basis for some news trading strategies, is Non-Farm Payrolls - the number of people employed in the non-farm sector.
The indicator covers more than ¾ of all jobs created in the U.S. but does not include those employed in agriculture, government, private households, and the unsuccessful sector. The indicator is representative because an increase in employment leads to an increase in personal income and, consequently, consumption expenditures, which are reflected in GDP.
Indicators of Industrial Production
The backbone of the economy of any country is its industrial sector. Both objective quantitative data (PPI - industrial production index) and subjective survey data (PMI - business activity index) can be used to assess it.
The index of industrial production shows the aggregate volume of goods produced by enterprises of the industrial sector.
The index of industrial production shows the total volume of goods produced by enterprises of the industrial sector. This indicator is often used as a leading indicator for GDP: forecasts concerning the dynamics of the gross domestic product are made based on it.
The business activity index is formed based on surveys of purchasing managers who answer questions about the number of new orders, the level of production and employment, the volume of supply, and stocks of materials. Answer options are: "better", "no change", "worse". The sum of the answers is translated into a scale from 0 to 100. A positive dynamic of the index relative to previous periods are interpreted by the markets as positive, while a negative one is interpreted by the markets as negative.
The indices of industrial production can be indirectly attributed to: the dynamics of retail sales, new home construction, and orders for durable goods.
The interpretation of all three indicators is identical: the more consumers are willing to spend now, the higher their spending is. In addition, increased spending means that consumers are positive about the outlook and plan to only get better in the future.
The Stock Market and Business Activity
Despite forex traders' dislike of traditional asset classes, devoting time to analyzing major stock market events is a must. Stock market data reflects its overall capitalization and liquidity, which are tied to the rate of inflation and Central Bank monetary policy.
A rising stock market indicates a bullish trend for the currency, reflecting the ability of producers of goods and services to borrow at higher interest rates. Central banks, in turn, see this as an opportunity to tighten monetary policy.
The weakening labor market is forcing the central bank to stimulate productive activity in the country by lowering the rates at which commercial banks borrow.
You can watch stock indices fall on days when the currency pegged to them leads the growth against other competing currencies. Demand for currencies drives up the cost of goods and services, undermining consumer activity and the competitiveness of companies in the markets.
Political Conjuncture and Other Factors
It is almost impossible to characterize and even take into account all the factors influencing exchange rates - the world of economic interrelations is so thin and indistinguishable. However, recent events have given us an interesting example to analyze with Trump's victory in the U.S. elections. Despite the polls, Hillary Clinton lost to the representative of the Republican Party. However, the markets were able to adapt very quickly to Trump's victory, despite the subverted expectations. For example, the European financial sector, as well as cyclical stocks, rose to six-month highs in a matter of days. This suggests that, in fact, any bearish trend for a currency most often entails a bullish one among other assets: a weak currency provides an influx of investment in traditional asset classes, making producer goods cheaper and therefore more competitive.
But if we go back to the migration crisis in Europe or, say, the Brexit referendum in Britain, which pushed sterling to 30-year lows, we can see a cyclical decline in all areas. The catastrophic state of the economy discourages investor interest in both government bonds and shares of private companies. And only the biggest players, which are essentially individual states, can benefit from such events.
A separate topic deserves a separate topic of natural factors, like cataclysms, falling passenger planes, terrorist attacks, and other risks. It is simply impossible to take them all into account, but they are only a small part of events among the many regular and regular economic processes.
These are key indicators of global economic activity. By relying on them, you can always stay informed about the latest developments in the financial markets. So don't forget to check the economic calendar and make long-term predictions about major competitive currencies.
The USA Fundamental Indicators
These are the most powerful tools of the currency market, and they affect all of the currencies in the world, whether you like it or not. If news broke out and the American dollar began to move, it would certainly affect the state of other currencies. In working out these indicators, of course, the best option would be to use a currency pair with USD. But not every currency pair is suitable here.
Let's consider the effect of the American indicators on currency pairs.
GBP/USD. At the moment of the American indicators release, the American trading session is already raging, but here's trouble. The European session is not over yet. Although it is in its final stage, its impact on the respective currencies is still palpable. It would be good if they will play along with the American indicators at this moment, but experience shows that this happens very rarely. In addition, the British Pound is one of the oldest currencies in the world and it has its character.
USD/CAD. When American indicators are released, the data in Canada is often released at the same time. This often causes various conflicts resulting in the appearance of spikes on the chart and this, in turn, triggers a pending order followed by a pullback of the price to a Stop-Loss.
AUD/USD and NZD/USD. Although they should be best suited to the American indicators because Australia and New Zealand are still sleeping, these currencies are always very volatile, and working with them requires some knowledge and skills. They have some of the biggest spreads and slippages.
USD/JPY. If the JPY starts its movement, it almost always goes straight ahead without any unwanted gimmicks. If you look at the chart of USD/JPY, you will notice that 80% of all strong movements of the pair are made during the American trading session.
In the same way, you can use the American indicators for the EUR/USD currency pair. Unlike the British Pound, the Euro is a very young currency, and during the American trading session, it is highly dependent on the dollar. In addition, it has the smallest spreads.
Best Forex Fundamental Indicators Explained: Economic Calendar
Each broker's website has an Economic Calendar. In this calendar, you can find:
- the day and time of the release of a particular economic indicator,
- region and currency, which refers to a particular indicator,
- the importance degree of the indicator,
- the name of the economic indicator,
- its description and statistics of its previous releases.
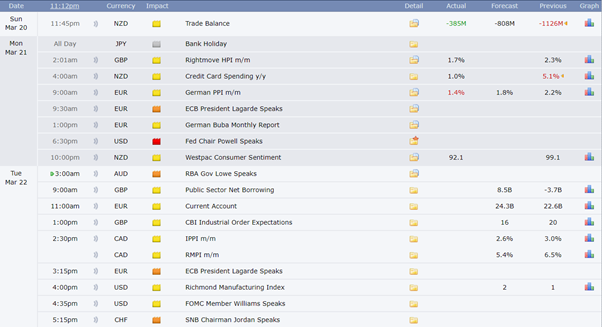
In addition, three values are indicated, which can be displayed both numerically and in percentage terms, depending on the type of news.
The previous value is a value of the previous release of the indicator, which was registered at that moment based on the National Bureau of Statistics data.
Forecasted value - these data are formed based on the processing of already available data by major analytical agencies. Using data from past releases, as well as the general economic component of the region, analysts determine this indicator.
The actual value - this data appears in the calendar immediately after the release of data on the economic indicator. Despite the abundance of varieties of economic calendars, they are similar. However, they are either not very user-friendly, the importance of the indicator is not displayed correctly, or the statistical data can be heavily distorted. The most accurate economic calendar can be found at the Forex Factory. In addition to accuracy, this calendar is very easy to use and has a lot of useful settings, which allows you to adjust the calendar individually for each trader.
How Does the Publication of Economic Indicators Affect the Market?
Based on the economic calendar we will analyze how impulse price movements occur and what the strength of the impulse itself depends on. Above we discussed indicators such as the Predicted and Actual value of the indicator. They determine in which direction the price will go and how far it will go. In fact, the greater the difference between them, the stronger the price impulse. That is, the more analysts are wrong, the stronger and farther the price will move. For example, we will take the Primary Quarterly Estimate of the UK Gross Domestic Product (Prelim GDP q/q). The economic calendar shows that analysts were forecasting a decline in GDP from Prelim = 0.6%, to 0.4%.
The release of the data showed that the analysts were wrong in their calculations by as much as 0.2%. This is a significant difference for the country's GDP, and it was enough for the price of GBP/USD to increase by 50 pips.
If we compare it with another similar release of the same indicator, we can see that this time, the analysts' error is only 0.1% (= Forecast 0.6% minus the Fact 0.5%). For the country's economy, a GDP value of 0.1% is also a serious figure, but it was only 29 points already.
As you have already realized, the divergence between the analytical forecasts and the actual data of the economic indicators releases is the very catalyst to which the price of the currency pair reacts. But if you watch the price at the time of such a release, you will see that the momentum is often heterogeneous. The price makes pullbacks, which can cause Spikes to appear on the chart.
The first to enter the market are the big players (market makers and consortia), who for the most part move the market. They use specialized software and large amounts of funds injections to create the basic price movements. While pursuing certain goals, they take a certain amount of points of price movement and leave the market. All this takes the first few seconds of the price impulse. Smaller market players, as well as the crowd, enter the market next. After the large players have taken their positions and closed them, due to the outflow of large amounts of capital from the market, there is a strong pullback of prices. Thanks to such a rollback, small players can get out of protective orders (Stop-Losses) and, as a consequence, make losses.
At the moments of release of the important economic indicators data of other less important indicators are released in parallel, but they, in turn, also affect the movement of the main price impulse. If the data turns out to be the opposite, there may be a so-called conflict of indicators and as a consequence the price rollback. But if the data of both types of indicators work in the same direction, respectively, it will give the price impulse new strength.
Peculiarities of the Analysis of Economic Indicators in the Forex Market
The analysis of economic indicators on the currency market is advisable for several reasons, regardless of the type of traders to which the investor considers himself.
Classification of indicators by significance level allows us to predict the potential of rate movement - rate leap after the publication of an updated indicator may reach 200 points and more within just a few hours.
The news background has a direct influence on the rate dynamics and often comes into contradiction with technical indicators. Such imbalance can lead to avoidable losses.
Understanding economic processes gives you a better sense of the market.
It should be remembered that traders, reacting to the publication of economic indicators, process secondary information, which is provided by news companies, which receive it from specialized agencies, calculating the major indicators. Not always after the publication of such news the market changes the direction of the movement, but in fact, the market always rallies.
As a rule, economic indicators are watched for those currencies, which are included in the trader's trading portfolio. It almost always includes the U.S. dollar, the euro, the Japanese yen, and the pound sterling. All of the most important indicators are presented in the forex economic calendar, which greatly simplifies the work of a trader.
Best Forex Fundamental Indicators Explained: Trading Approaches
When formulating your trading plan for the week, you need to consider what economic events will affect the quotes. Macroeconomic indicators of different countries are published daily, but really strong news is released several times a month. It is important to understand that the dollar news affects not only the USD but all other currencies as well as gold and oil. Macroeconomic indicators of the Euro influence only the EUR. Statistics on other currencies are not that strong, so if you do not trade these pairs, you can ignore the news on them.
Let's say a strong indicator is expected to be published next Friday. If you:
Trading on the news, this is your clue - use multidirectional pending orders with small stops set 3-5 minutes before the publication of the indicator;
If you are trading intraday, then it is best to close all your open positions 20 minutes before the news releases, and place new orders 20 minutes later when the market storm has calmed down;
Engaged in position trading and holding a position for several weeks, then increase the size of Stop-Loss h to survive the market turmoil or close the trade if you believe that the news can reverse the trend.
Under ideal conditions, the following happens: if the value of the macroeconomic indicator is better than forecasted, then the quotes go up, if worse - they go down. However, it is not always the news release that guarantees the rise or fall of quotations. Experienced traders can determine the approximate value of the indicator according to the previous data of the related indicators. For example, the direction of the Non-Farm Payrolls indicator can be predicted by analyzing the indicators related to the unemployment rate and the number of jobs. As a result, the market may either not react to the news at all, or the reaction will be very weak. A storm of emotions and stop orders will hit the market only in case the forecasted value is very different from what traders and analysts predicted.
Theoretical Methods That Tie Forex Fundamental Indicators Together
There are a great many theories of exchange rate determination. As a rule, they have little effect on a trader's daily activities, it is necessary to have an idea of the key ideas underlying these theories.
The main economic theories dealing with the exchange rate are related to the concept of parity and arbitrage. Parity is the economic justification for the exchange rate of one currency against another, and it can be based on factors such as inflation or interest rates.
According to economic theories, if parity is not maintained, the possibility of arbitrage arises for market participants. However, as in other situations, the market quickly becomes aware of this, and the opportunity ceases to exist so that the private investor does not have time to take advantage of the arbitrage transaction.
Arbitrage is a transaction involving the purchase or sale of a currency and a corresponding counter-transaction; its purpose is to benefit from differences in exchange rates in different markets (spatial currency arbitrage) or over some time (temporary currency arbitrage).
Other theories take into account economic factors such as trade, capital turnover, and the economic policies of a particular country. Below we briefly review all of these theories.
Purchasing Power Parity (PPP)
The purchasing power parity theory states that the same amount of funds converted into national currencies at the current exchange rate, can be used to buy the same goods in different countries. This theory is based on the idea that the same goods should have the same price all over the world. If, however, after recalculation at the current exchange rate, the price of the same good in two countries differs significantly, the possibility of arbitrage arises, because the goods will be bought in the country where they are cheaper.
Interest Rate Parity (IRP)
The theory says that the difference in exchange rates will be proportional to the difference between the exchange rate now and the exchange rate for transactions that are negotiated now but completed later. If the theory is correct, it means that it may be possible to benefit when these proportions differ. Some economic theories challenge the existence of interest rate parity.
There are three key variables in interest rate parity theory. One is the risk-free interest rate in each country. Since the risk-free rate is hypothetical, the calculation can work with either the central bank lending rate or the rate offered on government bonds. Both should be close enough to the guaranteed interest payment at the guaranteed rate for the theory.
The second variable is the spot exchange rate. This is the current market exchange rate between the currencies of the two countries. The third variable is the future rate. This is the prevailing market rate for currency futures contracts at which two investors agree to exchange currencies in the future at a fixed price. This rate will vary depending on how the two investors predict that the spot rate will change over time.
International Fisher Effect (IFE)
The International Fisher Effect (IFE) states that the difference between nominal interest rates in two countries is directly proportional to changes in the exchange rates of their currencies at any given time. The theory was developed by Irving Fisher, an economist from the United States.
The International Fisher Effect is based on current and future nominal interest rates and is used to predict spot and future exchange rate fluctuations. The IFE differs from other methods that use net inflation to try to predict and understand exchange rate movements.
Balance of Payments Theory (BOP)
Following the balance of payments theory, the exchange rates of a particular state must be at a level that stabilizes the current balance of payments of that state. In countries with a trade deficit, there is an increased demand for foreign currency because exporters have to sell the importer's national currency to obtain payment. If there is a low exchange rate in this situation, the value of exported goods on world markets decreases accordingly, and this factor stimulates an increase in their volume and leads to a stabilization of the balance of payments. The key objective of the theories of balance of payments is to develop methods and techniques of regulating the country's foreign settlements.
Asset Market Model
The basic idea behind this model is that the flow of finances into a country's other financial assets, such as bonds and securities, increases the demand for its currency and vice-versa. As proof, the proponents of this theory claim that the amount of funds directed toward investment products such as bonds and stocks are currently much higher than the number of funds exchanged for transactions in goods and services for export and import.
In general terms, asset market theory is the opposite of balance of payments theory, because it takes into account a country's capital instead of its current account.
Monetary Model
The monetary model is a way of describing the monetary side of the economy: the interaction between people's spending and the currency supply that the government creates. Policymakers use these models to understand the impact that their choices will have on the economy. These models are especially relevant in predicting exchange rate fluctuations as a result of monetary policy.
Monetary policy is one tool that governments have. Another is fiscal policy, which uses government spending in various sectors to stimulate economic growth. When the government uses monetary policy, it targets either a certain level of currency supply or a certain interest rate. Policymakers use a monetary model to assess the impact of changes in monetary policy on other economic variables.
Conclusion
Thereby, keeping track of important economic indicators will help you avoid unnecessary losses and earn solid returns. Even if you are an exceptional "technician" you need to be aware of the events that will affect the movement of currency pairs.
Related Articles


Latest updates
Latest updates


Technical Analysis
Latest updates


