Top Technical Analysis Tools for Forex Traders

Lately, forex trading with the use of fundamental analysis tools has significantly lost its effectiveness, so the increasing popularity of technical analysis tools. Exactly the analysis is the number one method of studying the situation on the market, and the data obtained are used to make forecasts.
Tools for technical analysis are all that help to carry out its implementation. It includes indicators and oscillators, price patterns, as well as the key levels of support and resistance.
In this article, we will learn more about technical analysis, the pros, and cons of technical analysis, and discuss the most popular tools for market analysis.
Technical Analysis and its Main Tenets
Technical analysis assumes that by examining price changes in the past, it is possible to predict future price changes. Since the forex market operates 24 hours a day, there is a huge variety of data. It can be used to calculate future price changes, thereby increasing the statistical accuracy of the forecast. It makes the forex market an ideal place for traders who prefer to use technical analysis tools.
All technical analysis comes down to answering the question of when to buy and when to sell. To do so, it is simply a matter of looking at a chart. When you skillfully use technical analysis tools, you can get fairly accurate predictions about price movements.
Some may be wondering if technical analysis really works. Some become ardent fans of the analysis and rely solely on its methods in their work, while others, on the contrary, deny it. The point is that to answer this question, it is important to understand how the analysis works. It is based on information about quotes. The correct interpretation of this information will allow predicting their movement with a high degree of probability.
The price is the result of all traders' expectations. If it rises, they open long positions, thus provoking its further growth or a bullish trend. If it falls, respectively, bears prevail on the market, and the downtrend continues. That is, in similar circumstances, people almost always behave the same way. It can be repeated, but not with 100% accuracy. This pattern is the basis of technical analysis.
It has been used in trading for hundreds of years. During this time, it has proved its efficiency. Its effectiveness is not one hundred percent, but it is regularly updated with new methods and tools. Knowing how to use them properly has enriched millions of people working on forex and other markets.
The basic idea here is cyclicality and repetition. Take a look at any currency pair chart, and you will see that quotes fluctuations repeat after certain time intervals and after similar events. Let's look at the three main principles of technical analysis that underlie its philosophy.
The market discounts everything
The price is influenced by various factors. This includes the political situation in the world, economics, and even the psychological attitude of traders. All these factors are a priori considered by the price, so it does not need them to estimate its movement. It will give us all the necessary information to estimate its movement.
Prices move in trends
The price movement is in a strict direction, which is called a trend. There are only three such trends on the market: uptrend (bullish), downtrend (bearish), and sideways. The quotes are not characterized by chaotic fluctuations - if the price went in a certain direction, then weighty events must occur for it to change.
History tends to repeat itself
The situation in the financial markets is always changing, unlike the laws of physics, economics, and psychology. These laws will always act, which means that history will always repeat itself.
Key Chart Trading Levels
It should be noted that support and resistance levels, as one of the important basic trading tools, are the basis of almost all trading robots and strategies. For forex to become a stable source of income, one should understand the psychology of the market and the behavior of its participants. The support and resistance levels help to determine the mood and activity of players, their influence on price movement. Levels are a powerful tool for technical analysis. When joining the world of forex, everyone begins to work in the terminal by identifying trend lines and levels.
When people speak about support and resistance levels, they mean two straight lines, which pass through the two highest and two lowest price extremums. The first ones are near the upper levels of the chart curve, the second ones are near its minimums.
The support level is looked for by the lowest price levels - troughs.
The resistance level is found by its highest values, i.e., peaks.
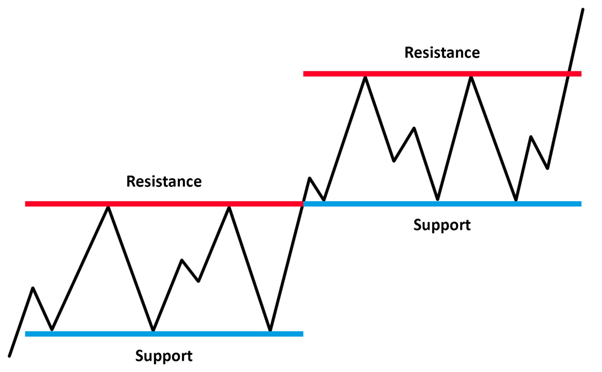
All of the minimum points on the chart cannot belong to the same straight line, as well as all of the maximum points. They stay in a certain range of values, where the price moves with the amplitude of units or tens of points. The accumulation of such marks in some price range is called price level.
The market price moves irregularly. Therefore, the curve of the chart can be directed sideways, downward, or upward. Draw two straight lines through 2-3 extrema from below and above the curve - these will be the trend lines. On a chart, they clearly determine the direction of the price movement - the trend. The price itself moves according to the laws of supply/demand.
The line drawn through the top 2 or 3 extrema is called the resistance line.
The line passing through the lower extrema is called the support line.
The first ones pass through 2-3 points of maximum/minimum price. The second ones cover points of the whole price range. In addition, trend lines can have a slope, while support and resistance levels are always plotted horizontally. The former show the trend direction, while the latter show current price levels.
Now we can formulate the rules:
- The resistance level is a horizontal line, which passes through the minimum price extremums, and indicates the dominant position of sellers over buyers.
- The support level is also a horizontal line, but it passes through the maximum extrema. In its price range, the buyers dictate their conditions to the sellers.
It is necessary to understand levels as hypothetical lines, to which the price has risen or fallen more than once, treading indecisively in place. Its "stomping" within the limits of one level is connected with the opposition of bulls (buyers) and bears (sellers). If the bulls win near the level of support, the price turns and goes to the winner's side - to the resistance line. If the bears win, the price continues to move past the support line.
It should be noted that breakouts of trend lines can be false and real. In the case of a real breakout, the trend changes, and the breakout line changes its quality. For example, if the breakout is fixed on the resistance line, it turns into support. If the price breaks out the support line, it changes into a resistance line.
So, as the price moves within the range, the chart curve comes to the resistance/support line. It may then move within the range of support and resistance levels, not breaking through trend lines, but bouncing off them and coming back to them again. Or it may break through the trend line and, having consolidated, go deeper in the current direction.
To be sure of the trend change and predict the price direction, it is necessary to use additional tools. To do this, it is also essential to identify characteristic patterns and figures of technical analysis. There are many tools to confirm that the price is likely to change its direction. Keep on reading to learn more.
For many traders, knowing how to trade support and resistance levels is enough to be successful. It is an informative and reliable tool that helps you keep track of crucial market signals. The ability to see these signals, recognize them and differentiate them is a trader's skill. Support and resistance levels can help a beginner to identify the trend. The ability to analyze it correctly and open winning positions in time is up to the individual.
Technical Indicators
Technical analysis indicators are scripts or graphical constructions, calculated with the help of mathematical formulas, the initial data for which are price charts. In other words, to create a specific indicator, the information about the price of a particular currency pair is taken, substituted in one of the formulas, after which the calculation result is automatically applied to the chart. Due to this, the trader can clearly see the direction of the asset movement, get a signal to enter or exit the market, understand what is happening with the currency pair and learn other useful information.
The main feature of modern indicators is automation in their calculations, instantly processing a large array of data. There are several classifications of technical indicators, which include:
- trend indicators;
- oscillators;
- level indicators;
- informative indicators;
- market analyzers, etc.
The most famous and popular are trend indicators and oscillators. The first ones are used to determine the current trend in the price movement so that it becomes clear in what direction it is better to open a position: to buy or sell. Trend indicators, as a rule, are displayed on the chart and move in parallel with the price. They allow timely identification of changes in the direction of price movement, thus minimizing the likelihood of capital losses.
In trading practice, different trend indicators are used, among them:
- Moving Averages;
- Bollinger Bands;
- Ichimoku indicator;
- Donchian Channels;
- Price Channel;
- Cumulative Fluctuation Index, etc.
The second large group of technical indicators is oscillators or leading indicators. These indicators are usually displayed in a separate window from the chart and are used to display the speed of price change over a certain period. The Latin word "oscillo" is translated as "oscillating". It gave the name to this group of indicators because the value of oscillators fluctuates in a certain range. Most often it is from 0 to 100 or from -100 to +100. For this reason, oscillators are often called channel indicators.
The most popular types of oscillators are:
- Stochastic;
- Relative Strength Index;
- MACD;
- Commodity Channel Index, etc.
Each technical indicator has its own peculiarities of application. To understand them, it is necessary to carefully study the description of the indicator and the mechanism of its work. Before downloading indicators, you should make sure that they are compatible with your trading terminal. Mostly they are suitable for the MetaTrader terminal, so it is one of the most convenient for work.
You might be surprised, but choosing the right indicator is only half the battle. For two different traders, the same indicator may show completely different signals. It all comes down to its settings.
It is worth noting right away that there are no ideal settings for any indicator. They depend on the currency pair, time frame, and much more. Someone is trying to take advantage of the default settings, someone is looking for advice on forex forums, but in fact, the optimal settings of a technical indicator can and should be chosen independently.
To find the optimal settings of a technical indicator, it is necessary to:
- Understand exactly what the indicator should show (the trend strength, direction, support/resistance levels, divergence, and so on),
- Determine the time frame in which the indicator will be used, and it depends on the trading strategy:
- See how the indicator works on the history and identify its regularities,
- Determine whether the signals given by the indicator are lagging or leading;
- Choose the parameters of the indicator, achieving the optimum quality of signals. You will not get a perfect picture, the main thing is to determine the parameters according to which the indicator will give the signals with the necessary frequency,
- To test the indicator with the selected parameters in trading on a demo or micro account.
No indicator is perfect and does not give 100% correct signals. False signals will be given by any indicator - this is normal. Such false signals can be filtered out by other indicators while loss-making trades should be closed in time.
Also, keep in mind that the currency market is not constant. Optimal indicator parameters depend on the state of the market now. If the number of Stop-Losses has increased - this is a reason to reconsider the parameters of the used indicators.
Many traders prefer working without indicators, but correctly adjusted indicators greatly simplify the analysis of the market situation and allow to make accurate entries into the market, extracting the maximum returns.
Chart Patterns
So, here we are with the technical analysis patterns. This is an interesting subject; each figure can be discussed in a separate article. But in this one, we will focus only on the main ones.
All chart patterns are divided into two main types: continuation and reversal patterns. Trend continuation patterns indicate that the current trend will continue its movement.
The reversal patterns imply a change in the direction of the trend. Everyone who wants to trade successfully should be able to see them. It is not difficult to trade in the course of a trend, but it is a skill to detect the moment of a change in its direction. All reversal patterns are characterized by such features:
- There must be a clear trend for a forex reversal pattern to form.
- The longer the pattern is formed, and the larger its size, the more significant will be the change of the quote.
- Patterns at the top of the chart are characterized by greater variability and time of formation than at the bottom of the market.
Detecting patterns takes practice, and blindly trusting them is a straightforward way to lose your deposit, especially for beginners. Even though formations give a correct prediction only in half of the cases, it is still recommended to draw them. Because a chart with a pattern always gives a better idea of the anticipated price movement than a chart without a pattern. It means that we should not trade only on patterns. But they can be used for a more precise estimation of the market situation and to make correct decisions based on patterns.
Now let's look at some most popular chart patterns.
Head and Shoulders
It is the main reversal pattern in forex. It can occur both at the top of the market and its base. The central peak looks like a head, and the two side peaks look like shoulders. The support line connecting the shoulders is called a neck. Its breakout will be a signal of reversal.
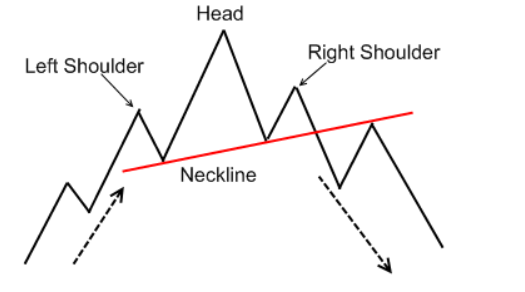
The support line connecting the shoulders is called a neck. Its breakdown will be a signal of reversal.
Sometimes this line can be drawn when the left shoulder is formed. But it's better to do it after the end of the formation of the head. The right shoulder tries to repeat the shape of the left shoulder. The appearance of the head in the forex showed the slowing of the growth dynamics, and the right shoulder formed the first peak below the previous one. Only a breakout of the neckline will complete the pattern formation.
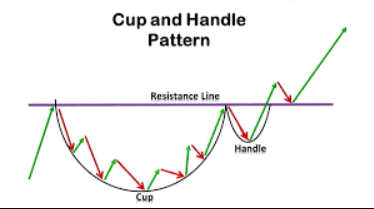
Cup and Handle
It occurs rather seldom. At the market bottom the transition from increasing to decreasing is so smooth, without any sharp peaks, that the graph looks like a cup with a handle.
Double Top
This pattern can be often found on the charts of currency rates. Here is how it looks like on the chart:
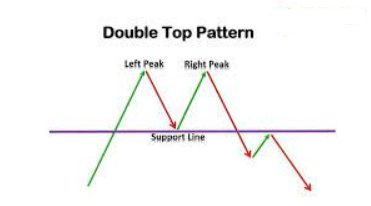
The essence of this pattern is that when the uptrend meets a strong resistance level, which it cannot break out, it tests it twice and then reverses and becomes a downtrend. Of course, this is only one of the possible outcomes. Generally, a pattern is considered to be formed when the price has made two consecutive maximums and has crossed the level of the minimum located between them.
If the minimum level is broken-out when the market volume increases, the model becomes more reliable.
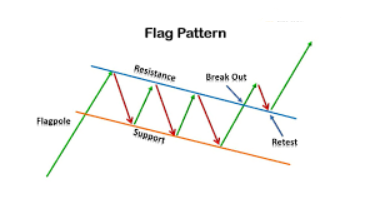
Flag
After a sharp rise, the price pulls back to resume its movement with renewed vigor. It looks like a small correction in the form of a channel and looks a lot like a flag on a flagpole. Breaking out the resistance line is an excellent signal for entering a bullish market.
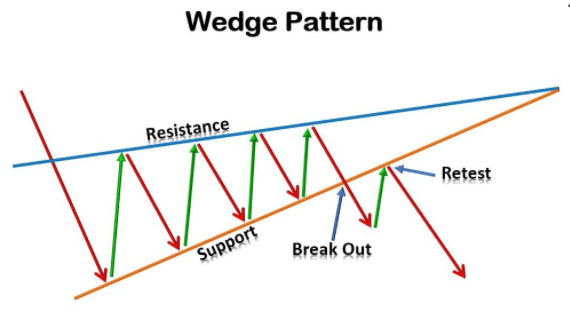
Wedge
It is easily recognized by the support and resistance lines converging to its apex. It is formed during the final phase of a trend or correction.
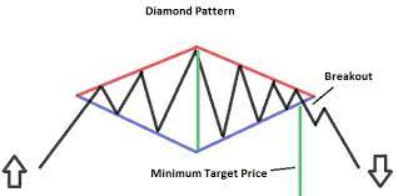
Diamond
Quite a rare reversal-type formation that can be formed during any trend at the local minimums/maximums. After the formation has been broken out, there will be either a correction entry (sideways trend) or a cardinal change of trend. If the pattern appears during a downtrend on the lows, one should place a buy order.
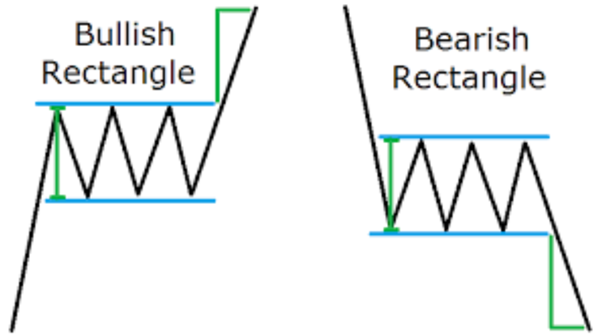
Rectangle
The pattern is formed by parallel lines of support and resistance, which form a conditional corridor for the price movement on the chart. Within the corridor, the price consolidates and changes its direction. It is logical to trade in the direction of the breakout of the formation - if it closes above the line of resistance, it is a buy. Sell order is placed at the closing of the formation under the support line.
Having understood what a pattern is and how it emerges, a trader opens up a lot of opportunities for analysis and prediction of the market situation. Thanks to the graphic analysis he will be able to quickly buy or sell assets.
The rules of figure formation and their meaning give the forex trader a guide to behavior in this or that situation. And to find graphical patterns on an ascending or descending curve, it is enough to use levels and trends, which makes it possible to understand the situation without additional materials and indicators.
The main disadvantage of working with patterns is the subjective perception of indicators. For example, an experienced exchange player sees one figure on the monitor and earns yield, while a beginner sees another, which does not allow him to estimate the situation soberly, and he loses funds.
Advantages and Disadvantages of Technical Analysis
Like all analytical methods, technical analysis has advantages and disadvantages. The pros include the following:
- A variety of tools can be used to obtain analytics. The use is justified both in the currency and stock markets;
- Charts allow you to analyze different time frames - from 1 minute to several decades;
- Different tools are used for each market, which can take into account the specifics;
- The techniques are based on what is happening in the current period;
- The resulting data reflects the situation that was formed immediately at the time of trading.
Speaking about the cons, we can enumerate the following moments:
- The analytics are subjective. The opinions of the two traders may differ significantly;
- The obtained data informs you about the probability of the event occurring but does not say that it will happen;
- Technical analysis for beginners and experienced traders is based on mathematical calculations that require skills and abilities;
- For analysis, it is vital to consider the relevance and reliability of the information.
Despite all the disadvantages, technical analysis is still a helpful way to predict price fluctuations, and it evolves and strives for perfection every day.
Conclusion
Success in trading depends on many factors, one of which is an accurate analysis of the situation. Combining innovative technologies and time-tested strategies, traders can forecast the possible price movements like never before. Of course, technical analysis is not a panacea. Risk management rules should not be neglected, as well as fundamental analysis.
Related Articles


Latest updates
Latest updates


Technical Analysis
Latest updates


