Breakout Trading Explained: Strategies, Examples, and Best Practices
In trading, a "breakout" means a price movement that occurs when an asset moves beyond a determined support or resistance level. This pivotal moment signals a shift in market dynamics and often leads to notable price changes. Breakouts occur when the price surpasses a level that has previously acted as a barrier, such as a previous high (resistance) or a previous low (support).
Understanding breakouts is crucial for traders as they can indicate the beginning of a new trend. For example, when the price breaks above a resistance level, it might suggest the start of an uptrend. Conversely, a breakout below support may signal the beginning of a downtrend. Learning breakout trading strategies allows traders to capitalize on these potential market movements, making it a valuable skill for enhancing trading success.
What Are Breakouts in Trading?
Breakouts in trading occur when the price of an asset moves beyond a well-established support or resistance level, predecting a potential shift in market direction. A "breakout" can happen in either direction: upwards, known as a bullish breakout, or downwards, known as a bearish breakout. This price movement often leads to increased volatility and can provide traders with significant opportunities.
How Breakouts Occur and Why They Are Significant
Breakouts happen when the price breaks through key levels that have previously acted as barriers. These levels are often determined through technical analysis and can include:
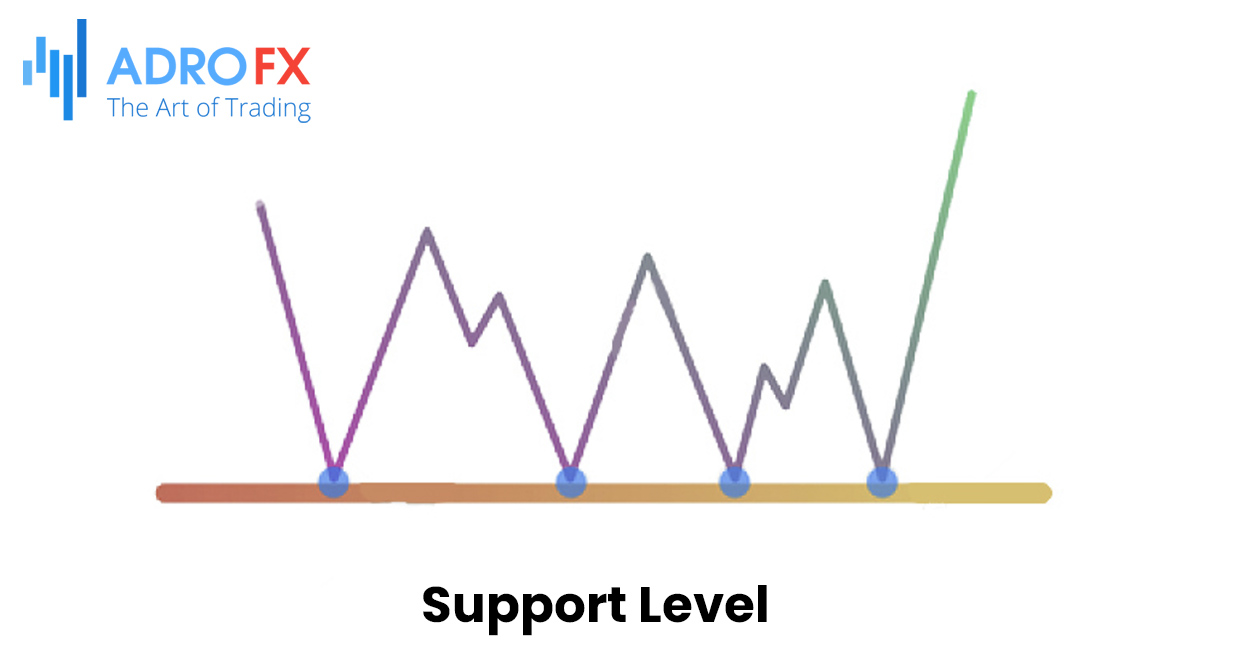
- Support Levels: The price point at which an asset tends to stop falling and may reverse direction. A bearish breakout occurs when the price falls below this level, suggesting a potential continuation of the downtrend.
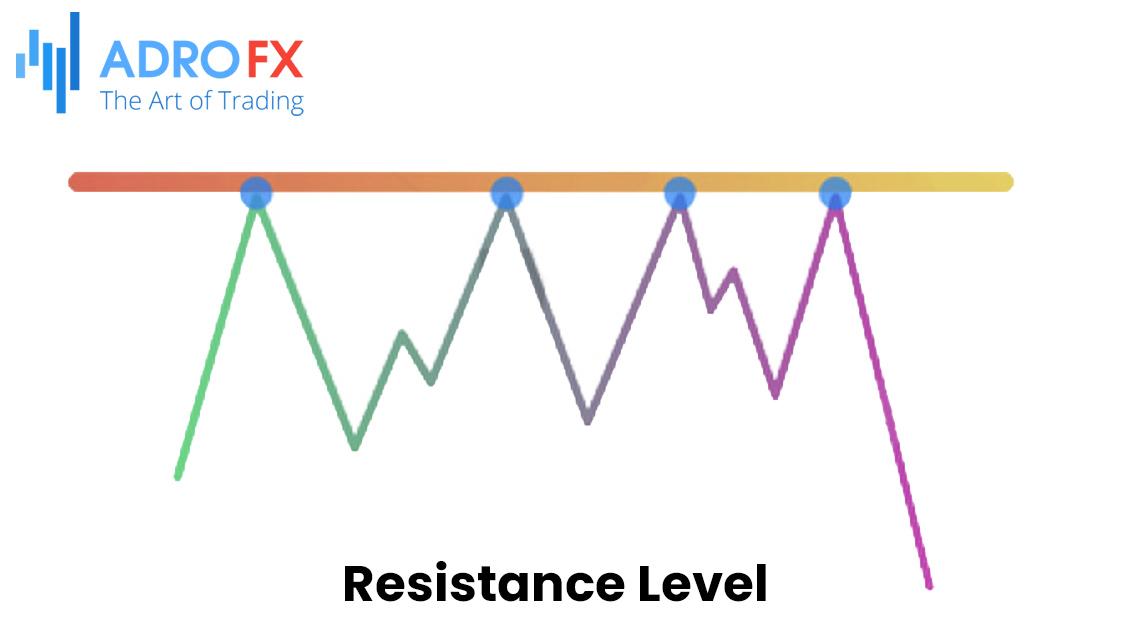
- Resistance Levels: The price point at which an asset typically stops rising and may reverse direction. A bullish breakout occurs when the price rises above this level, indicating a possible start of an uptrend.
The significance of breakouts lies in their potential to signal the beginning of new trends. When a breakout occurs, it can lead to increased trading volume and volatility, which can be exploited by traders to enter or exit positions profitably. Identifying and trading breakouts effectively can enhance a trader’s ability to profit from market movements and manage risk more effectively.
Examples of Breakout Scenarios
To illustrate how breakouts can offer trading opportunities, let’s delve into two distinct scenarios - one bullish and one bearish.
Bullish Breakout Example:
Let`s a stock that has been trading in a well-defined range between $50 and $55. In this scenario, $50 acts as the support level, where the stock price tends to find buying interest and bounce back, while $55 serves as the resistance level, where selling pressure typically causes the price to retreat.
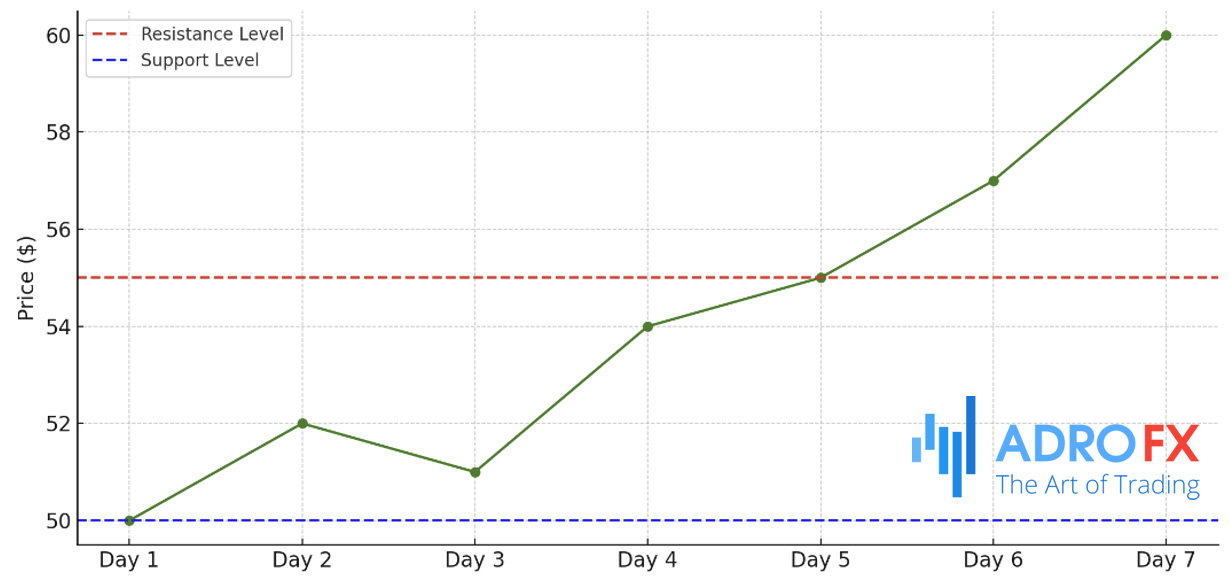
Bullish Breakout Example: The stock price breaks above the $55 resistance level with a significant increase in trading volume, signaling a potential uptrend.
Now, suppose the stock price decisively breaks above the $55 resistance level with a significant increase in trading volume. This surge in volume confirms the strength of the breakout, indicating that the price movement is supported by robust market interest. Traders observing this breakout might interpret it as a signal that a new uptrend is beginning. They could view this as an ideal buying opportunity, expecting that the price will continue to rise as the bullish momentum builds. This breakout could lead to further price increases, offering potential profits for those who act on this signal.
Bearish Breakout Example:
Consider a different stock that has been trading between $80 and $75. Here, $80 is the resistance level where the price struggles to rise above, while $75 is the support level where the price tends to find buying interest and bounce back up.
If the price breaks below the $75 support level, accompanied by a noticeable increase in trading volume, this could signal the continuation of a downtrend. The increased volume provides confirmation that the breakdown is significant and not merely a short-term fluctuation. Traders witnessing this bearish breakout might see it as a signal to sell the stock or initiate short positions, anticipating that the price will continue to decline as the bearish trend strengthens. Such a breakout often represents a critical point where the price could extend its downward movement, presenting a trading opportunity for those prepared to capitalize on the downtrend.
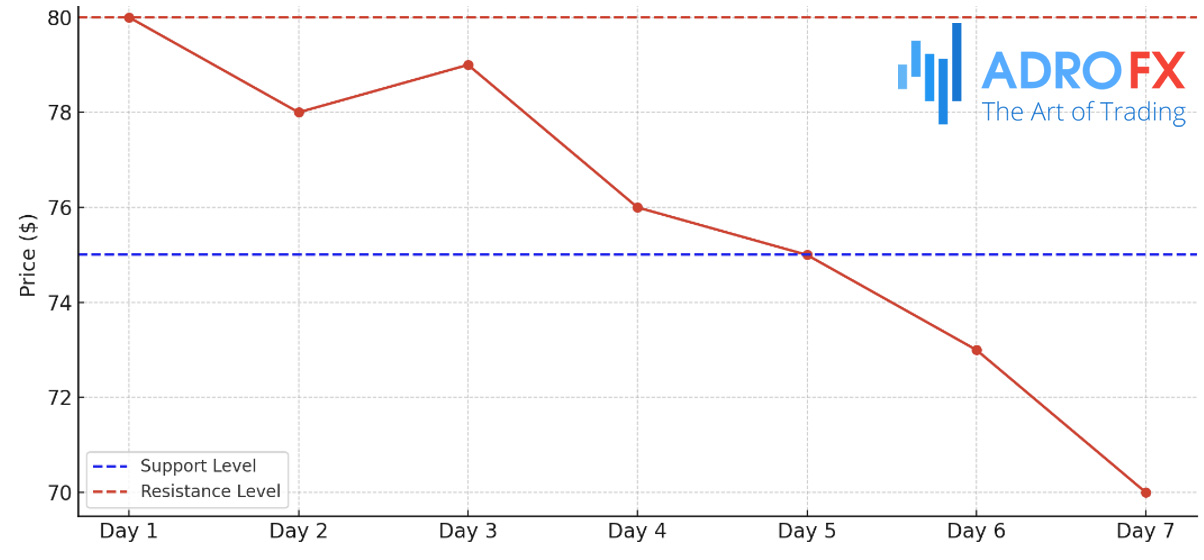
Bearish Breakout Example: The stock price breaks below the $75 support level with increased volume, indicating the continuation of a downtrend.
Understanding these breakout scenarios helps traders make more informed decisions. By recognizing when a stock breaks key support or resistance levels, and confirming these breakouts with increased volume, traders can effectively apply breakout trading strategies. This approach allows them to seize market opportunities and enhance their trading outcomes.
The Concept of Breakout Trading
Breakout trading focuses on identifying and leveraging price movements that occur when an asset surpasses established support or resistance levels. The essence of breakout trading lies in recognizing when the price moves beyond these significant levels, which often indicates the start of a new trend or a substantial price shift. Traders who master this technique aim to enter the market just as these new trends begin, positioning themselves to benefit from the ensuing price changes.
Understanding the core principles of breakout trading is crucial. Traders strive to pinpoint significant levels where prices have previously encountered obstacles. They look for precise moments when the price breaches these levels, which can signal the beginning of a new trend. Successful breakout trading also requires effective risk management strategies to protect against potential false breakouts and adverse market movements. Maximizing profits involves capturing the full extent of the price movement by staying in the trade as long as the breakout trend remains intact.
To identify breakouts, traders often rely on several key indicators. Trendlines, for instance, are drawn to connect significant highs or lows, helping to visualize the prevailing market direction. A breakout occurs when the price moves beyond these trendlines, potentially indicating a trend change or continuation. Moving averages can also be useful, as they smooth out price data and highlight potential breakout points when the price crosses these averages. Volume plays a pivotal role as well; increased trading volume often confirms the strength of a breakout. Additionally, chart patterns such as triangles, flags, and pennants can precede breakouts and offer valuable trading signals.
Popular Breakout Trading Strategies
One popular breakout trading strategy involves using trendlines. Trendlines are drawn on price charts to connect notable highs or lows and represent the overall market direction. When the price breaks through these trendlines, it can signal a significant shift. To effectively use trendlines in breakout trading, traders first draw trendlines by identifying recent highs and lows. They then monitor the price action as it approaches the trendline. A breakout is confirmed when the price closes beyond the trendline, ideally accompanied by increased trading volume. This high volume often signifies the strength of the breakout. Traders enter a position in the direction of the breakout, setting Stop Loss orders just below the breakout level to manage risk. Continuous monitoring and adjustment of Stop Loss or Take Profit levels are crucial as the trend develops.
Another widely used strategy is based on support and resistance levels. These horizontal lines on a chart indicate where prices have historically encountered obstacles, either bouncing off or failing to surpass these levels. A breakout occurs when the price moves through these levels, suggesting a potential change in market sentiment. For a successful trade, traders identify these key levels based on historical price data and watch for breakouts as the price approaches these thresholds. Confirming the breakout with increased volume helps validate the strength of the move. Traders then set entry and exit points based on recent price action, using Stop Loss and Take Profit orders to manage their trades effectively.
Volume-based breakout strategies are also integral to successful trading. Volume, or the number of shares or contracts traded, provides insights into the strength of a breakout. High volume during a breakout often indicates strong market interest, making it more likely that the breakout will continue. Traders analyze volume spikes and patterns to confirm breakouts, looking for sudden increases in volume as the price approaches key support or resistance levels. Techniques such as using volume oscillators, like the On-Balance Volume (OBV) or Chaikin Money Flow (CMF), can further help gauge whether volume supports the breakout. Confirming breakout signals with other indicators, such as moving averages or trendlines, enhances the reliability of the trade.
How to Implement a Breakout Trading Strategy
Implementing a breakout trading strategy begins with setting up your trading platform to effectively identify and act on breakout opportunities. Ensure that your platform is equipped with essential tools such as real-time charts, technical indicators, and alerts. Setting up trendlines, support and resistance levels, and volume indicators can help in visualizing potential breakout points. Customizing your charts to display these elements will facilitate quicker decision-making and help you respond promptly when a breakout occurs.
Risk management is a crucial component of any successful breakout strategy. One of the key aspects of managing risk is placing Stop Loss orders. These orders are designed to limit your potential losses if the market moves against your position. For a breakout trade, position your Stop Loss just below the breakout level for a bullish trade or above it for a bearish trade. This placement helps protect against false breakouts, where the price briefly moves beyond a key level before reverting. Additionally, determine your position size based on your overall risk tolerance and the distance between your entry point and Stop Loss to ensure that any single trade does not disproportionately affect your trading capital.
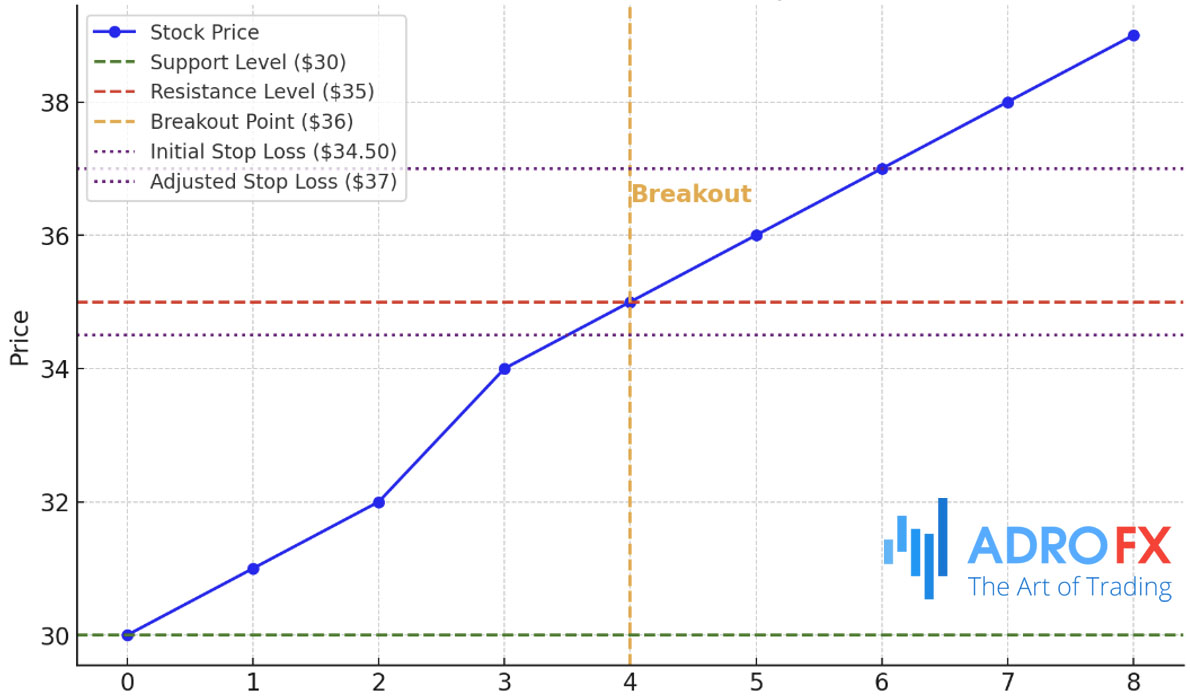
Consider an example of a breakout trade to illustrate this process. Suppose a stock has been trading in a range between $30 and $35, with $35 acting as resistance. If the stock price breaks above $35 with a surge in volume, it may signal a potential uptrend. In this case, you would enter a long position once the breakout is confirmed. Set your Stop Loss just below the new resistance level, around $34.50, to protect against a potential retracement. As the stock price rises, adjust your Stop Loss to lock in profits and manage risk effectively.
Common Mistakes in Breakout Trading
One common mistake in breakout trading is overtrading and falling for false breakouts. Overtrading occurs when traders enter too many positions or trade based on every small price movement, often resulting in losses due to market noise. False breakouts, where the price temporarily moves beyond a key level but then reverses, can trap traders into losing positions. To avoid this, ensure that the breakout is supported by strong volume and other confirming indicators before making a trade.
Ignoring risk management is another significant pitfall. Traders who neglect to use Stop Loss orders or fail to manage their trade sizes risk substantial losses. Proper risk management involves setting Stop Loss orders at appropriate levels and adjusting position sizes based on your risk tolerance. Without these measures, a single adverse price movement can lead to significant financial damage.
A lack of patience and discipline can also hinder breakout trading success. Breakout trading often requires waiting for the right setups and allowing trades to develop as expected. Impatience might lead traders to enter or exit trades prematurely, while a lack of discipline can result in deviating from the planned strategy or ignoring Stop Loss levels. Maintaining patience and sticking to your trading plan are essential for long-term success in breakout trading.
Tips for Successful Breakout Trading
To excel in breakout trading, adhering to best practices for identifying and acting on breakouts is crucial. Start by using a combination of technical indicators, such as trendlines, moving averages, and volume analysis, to confirm breakouts. Focus on breakout points that align with these indicators, and ensure the breakout is supported by increased trading volume. This combination increases the reliability of the signal. Additionally, set clear entry and exit points before executing a trade. A well-defined plan helps in making objective decisions and avoiding impulsive actions.
Psychological aspects also play a significant role in breakout trading. Trading can be emotionally challenging, especially during periods of high volatility or after a series of losses. It is important to maintain discipline and avoid letting emotions dictate your trading decisions. This means sticking to your trading plan, managing risk properly, and not being swayed by short-term market fluctuations. Developing mental resilience and keeping a long-term perspective will contribute to more consistent trading performance.
Continuous learning and strategy refinement are essential for long-term success. Markets are dynamic, and strategies that work well today might not be as effective in the future. Regularly reviewing your trades, analyzing your performance, and staying updated with market trends can provide valuable insights. Experimenting with new strategies and adapting your approach based on changing market conditions will help in refining your breakout trading skills.
Conclusion
In summary, successful breakout trading hinges on a well-rounded approach that combines effective strategy implementation with disciplined psychological management. Understanding how to identify and act on breakouts, using proper risk management, and continually refining your strategies are key components of a robust trading plan. By integrating these practices, traders can enhance their ability to capitalize on breakout opportunities and achieve better trading outcomes.
We encourage you to take your breakout trading skills to the next level by trying out a trading demo with AdroFx. This hands-on experience allows you to apply what you've learned in a risk-free environment, helping you refine your strategies and gain confidence. Explore AdroFx’s advanced trading tools and features, and see how they can enhance your trading approach. Share your experiences with us and connect with other traders to discuss strategies and insights. Start your free demo today and see firsthand how AdroFx can support your journey to successful breakout trading.

About AdroFx
Established in 2018, AdroFx is known for its high technology and its ability to deliver high-quality brokerage services in more than 200 countries around the world. AdroFx makes every effort to keep its customers satisfied and to meet all the trading needs of any trader. With the five types of trading accounts, we have all it takes to fit any traders` needs and styles. The company provides access to 115+ trading instruments, including currencies, metals, stocks, and cryptocurrencies, which make it possible to make the most out of trading on the financial markets. Considering all the above, AdroFx is the perfect variant for anyone who doesn't settle for less than the best.
Related Articles


Latest updates
Latest updates


Technical Analysis
Latest updates


