Hidden Bullish Divergence in Forex Trading

Divergence is a crucial concept in forex trading that helps traders spot potential trend reversals or continuations. Divergence occurs when the price of an asset moves in one direction while a technical indicator moves in another, revealing hidden market strength or weakness. Among the various types of divergence, hidden bullish divergence stands out. This article explores hidden bullish divergence, its significance, how to identify it, and strategies to trade effectively using this potent signal.
Understanding Hidden Bullish Divergence
Hidden bullish divergence appears when an asset's price forms a higher low (HL), while a technical indicator such as the Relative Strength Index (RSI), Moving Average Convergence Divergence (MACD), or Stochastic Oscillator forms a lower low (LL). This divergence suggests that despite a temporary price dip, the underlying bullish trend is likely to continue. Essentially, hidden bullish divergence signals a consolidation phase within an ongoing uptrend, preparing for further upward movement.
In contrast, regular bullish divergence occurs when the price makes a lower low (LL), while the indicator forms a higher low (HL). This type of divergence indicates a potential reversal from a downtrend to an uptrend, signaling weakening downward momentum and a possible bullish reversal.
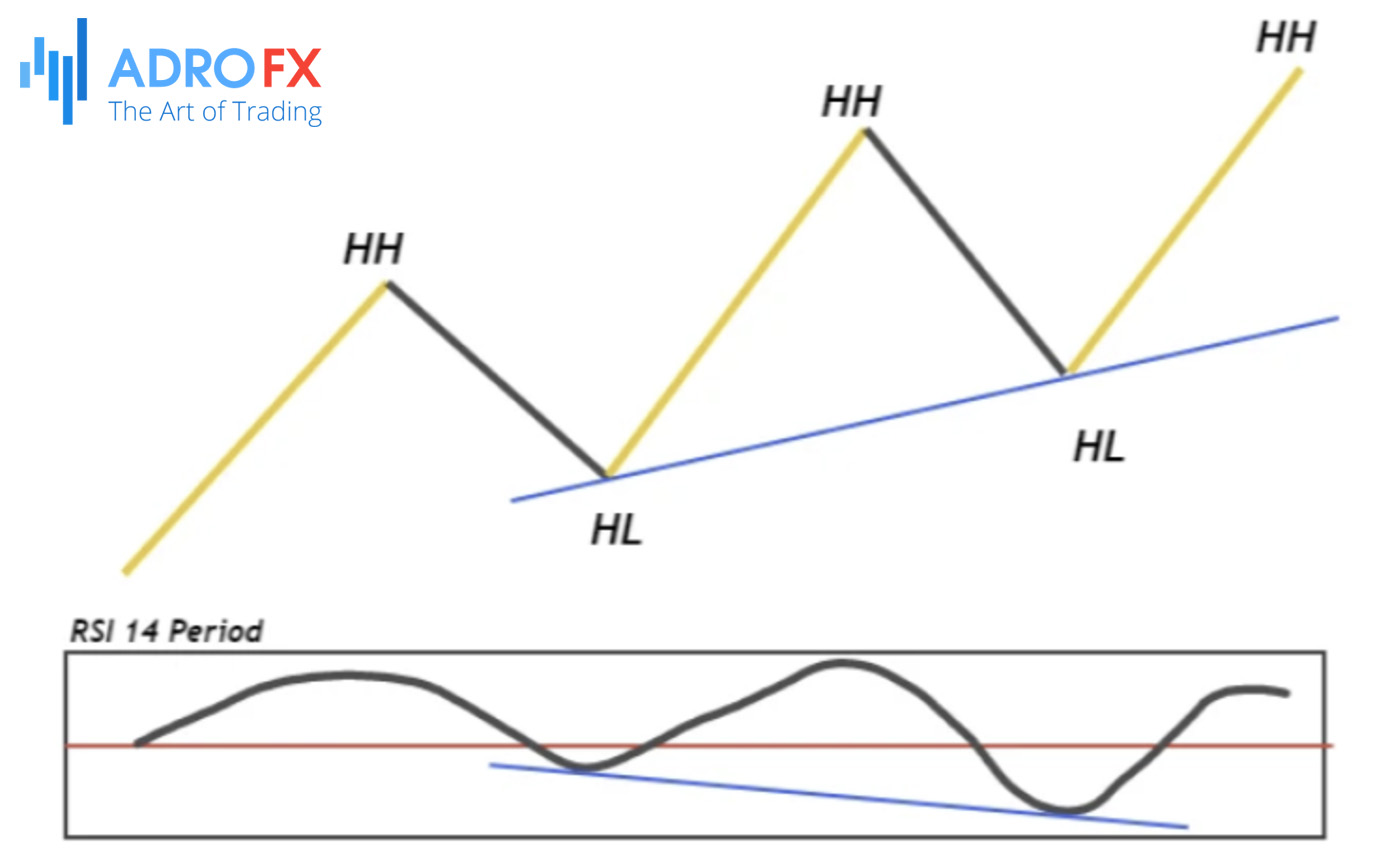
The key difference between these divergences lies in their implications: regular bullish divergence suggests a reversal from a downtrend to an uptrend, while hidden bullish divergence indicates a continuation of an existing uptrend. Understanding this distinction is crucial for traders to accurately interpret market signals and make informed trading decisions.
Various technical indicators can be used to identify hidden bullish divergence, each offering unique insights into market dynamics:
- Relative Strength Index (RSI)
The RSI, a momentum oscillator, measures the speed and change of price movements. Hidden bullish divergence occurs when the RSI forms a lower low while the price forms a higher low, suggesting the uptrend is likely to continue.
- Moving Average Convergence Divergence (MACD)
The MACD, a trend-following momentum indicator, shows the relationship between two moving averages of an asset's price. Hidden bullish divergence is identified when the MACD line forms a lower low while the price forms a higher low, indicating ongoing bullish momentum.
- Stochastic Oscillator
This indicator compares a particular closing price of an asset to a range of its prices over a specific period. Hidden bullish divergence is present when the stochastic oscillator forms a lower low while the price forms a higher low, indicating the current uptrend is likely to persist.
Using these indicators, traders can spot hidden bullish divergence, providing an edge in anticipating trend continuations and optimizing entry and exit points in their trading strategies.
Identifying Hidden Bullish Divergence
To identify hidden bullish divergence effectively on a price chart, adhere to these steps:
- Begin with Indicator Selection
Opt for a suitable technical indicator like the Relative Strength Index (RSI), Moving Average Convergence Divergence (MACD), or Stochastic Oscillator. These indicators serve to compare price movements with momentum, offering valuable insights. - Analyze Price Trends
Scrutinize the price action to identify a higher low. This signifies that despite momentary declines, the overall upward trend remains intact. - Compare with the Indicator
Simultaneously, assess the selected technical indicator for a lower low. The presence of this divergence between the price action and the indicator indicates that while the price is forming higher lows, momentum is registering lower lows. - Confirm the Pattern
Verify that the higher low in the price and the lower low in the indicator coincide within the same timeframe. This synchronization is pivotal for validating the presence of hidden bullish divergence. - Seek Entry Signals
Once hidden bullish divergence is identified, corroborate the signal with other technical analysis tools or patterns such as candlestick formations or trendline breaks. These additional confirmations reinforce potential entry points.
Consider a scenario where the price chart of a currency pair exhibits a higher low (HL), while the RSI portrays a lower low (LL). This discrepancy indicates hidden bullish divergence. In this context, despite a temporary pullback, the uptrend is likely to persist, offering traders valuable insights into market dynamics.
The Significance of Hidden Bullish Divergence
Hidden bullish divergence holds a pivotal position in forex trading, providing invaluable insights into market sentiment and potential price movements. This pattern indicates the robustness of underlying bullish sentiment, even amidst minor corrections. Essentially, it signifies that buyers maintain dominance, suggesting a continuation of the prevailing uptrend.
Traders often view hidden bullish divergence as a precursor to the continuation of the uptrend, presenting opportunities to enter positions with the anticipation of rising prices. Unlike regular bullish divergence, which signals a potential reversal from a downtrend to an uptrend, hidden bullish divergence reinforces the existing bullish trend. This aspect renders it particularly valuable for traders inclined towards trend-following strategies.
Comprehending and leveraging hidden bullish divergence can profoundly augment a trader's decision-making process. Recognizing this pattern enables traders to execute more informed entries, align their strategies with the prevailing market direction, and ultimately enhance their trading outcomes. Hidden bullish divergence serves as a potent indicator, accentuating the resilience of an uptrend and furnishing actionable insights for traders seeking to capitalize on sustained market movements.
Trading Strategies Involving Hidden Bullish Divergence
Hidden bullish divergence emerges as a potent tool for forex traders, particularly in delineating entry and exit points. To harness this signal effectively, traders should adhere to a structured approach. When identifying hidden bullish divergence, it's imperative to seek out higher lows on the price chart that align with lower lows on oscillators like RSI, MACD, or the Stochastic Oscillator. This synchronization signifies the probable continuation of the uptrend, offering a strategic entry juncture for trades.
For entry positions, traders can initiate long positions post-confirmation of hidden bullish divergence, preferably after observing price movement in the anticipated direction. It's prudent to await additional validation from other technical analysis tools such as trend lines, moving averages, or candlestick patterns. This multi-pronged confirmation methodology bolsters signal reliability and diminishes the likelihood of false signals.
Exiting trades warrants a cautious approach. Traders should contemplate exiting their positions upon indicator indications of overbought conditions or upon detecting signs of regular bearish divergence, which might portend a potential reversal. Moreover, refining exit strategies by establishing predefined profit targets predicated on support and resistance levels or Fibonacci retracement levels can enhance trade management.
Robust risk management practices are indispensable when trading predicated on divergence signals. To mitigate prospective losses, traders ought to consistently employ Stop Loss orders. Placing Stop Loss orders beneath recent swing lows or pivotal support levels can serve as a bulwark against abrupt market reversals. Position sizing constitutes another pivotal facet of risk management. Traders must apportion a proportion of their capital to each trade, ensuring that no individual trade substantially impacts their overarching portfolio. Implementing a risk-reward ratio, such as 1:2 or 1:3, further fortifies a balanced approach to risk and reward.

Case Studies and Examples
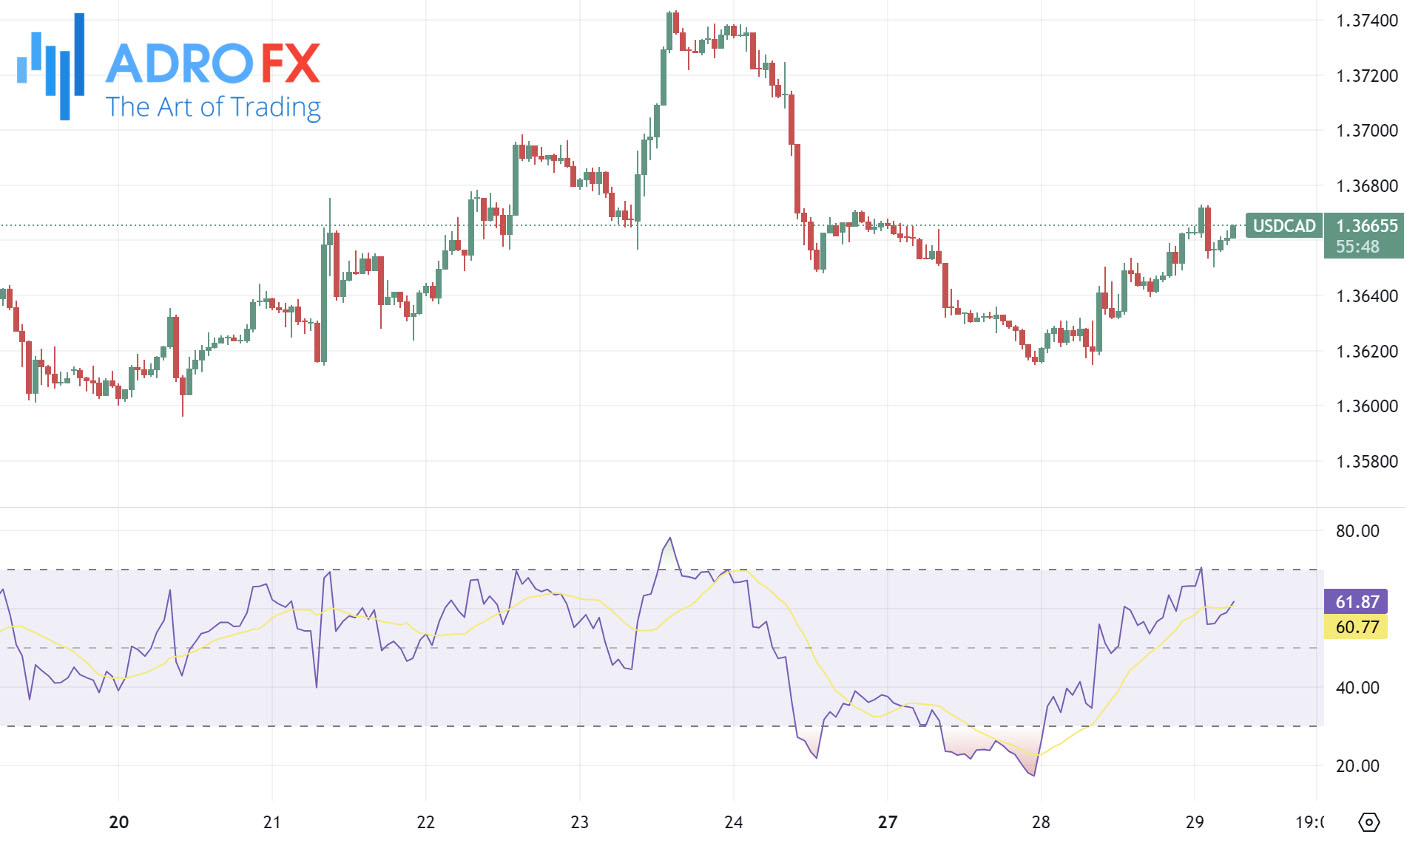
Examining real-world instances of hidden bullish divergence unveils valuable insights into how this pattern can lead to profitable trades. Let's delve into a scenario where a trader identifies hidden bullish divergence on the USD/JPY pair. Upon scrutinizing the price chart, the pair manifests a higher low, while the RSI indicates a lower low. Recognizing this as a potential indicator of trend continuation, the trader initiates a long position. Subsequent price movement validates the uptrend, prompting the trader to exit the trade at a predefined resistance level, thereby securing a profitable outcome.
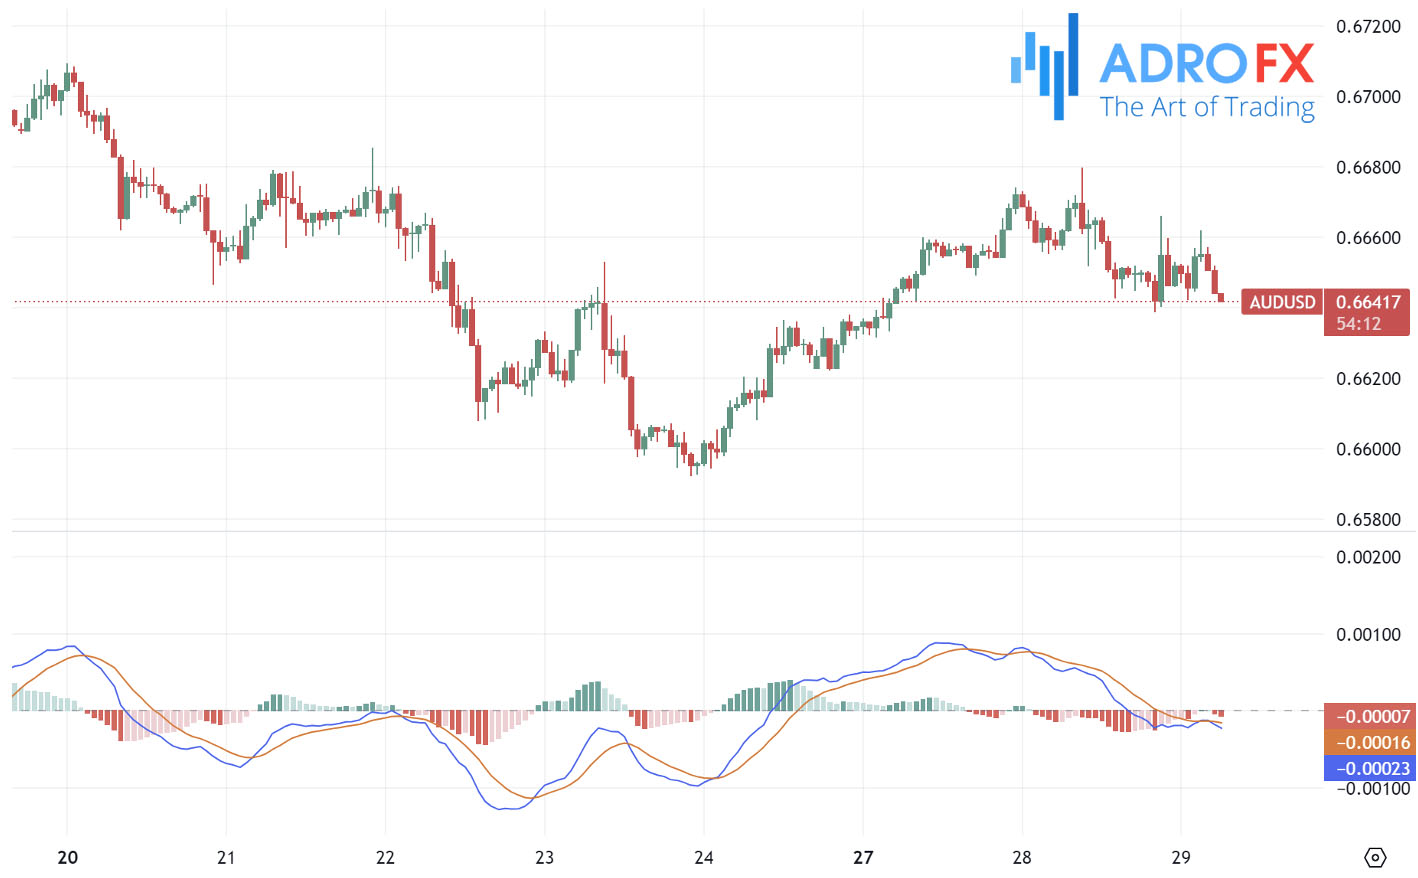
Another illustrative example involves the EUR/USD pair. Suppose hidden bullish divergence is discerned utilizing the MACD indicator, with price forming higher lows and the MACD histogram revealing lower lows. The trader enters a long position post-confirmation of the divergence via a bullish candlestick pattern. The trade is meticulously monitored using moving averages to track the prevailing trend, and the trader exits the position upon reaching a significant resistance level, culminating in a successful trade.
Analyzing these case studies imparts several crucial lessons. Firstly, a hidden bullish divergence can serve as a dependable signal for trend continuation, particularly when supplemented by other technical indicators. Secondly, amalgamating multiple confirmation signals heightens the precision of trade entries and exits. Lastly, disciplined adherence to risk management practices, such as setting Stop Loss orders and adhering to position sizing strategies, proves indispensable for sustaining profitability and mitigating potential losses. By assimilating these examples and strategies, traders can enhance their adeptness in capitalizing on hidden bullish divergence patterns within the forex market.
Common Mistakes and Pitfalls
In the realm of trading based on hidden bullish divergence, traders often encounter common pitfalls that can result in false signals and unfavorable trading outcomes. One prevalent misstep involves placing undue reliance solely on hidden bullish divergence without taking into account other technical indicators or prevailing market conditions. While hidden bullish divergence holds substantial significance as a signal, its reliability can be bolstered through confirmation with supplementary analysis tools like moving averages, trend lines, or candlestick patterns.
Another critical mistake revolves around the misidentification of the divergence itself. Traders occasionally confuse regular bullish divergence with hidden bullish divergence or struggle to accurately discern the higher lows on the price chart and lower lows on the oscillator. Such misinterpretations can lead to erroneous trade decisions. To mitigate this risk, traders should engage in diligent practice and ensure a comprehensive understanding of the distinctions between various types of divergences.
Furthermore, disregarding the broader market context presents another pitfall. Despite the presence of hidden bullish divergence, its effectiveness may be diminished in markets heavily influenced by fundamental news or events. Traders must take into consideration the overarching market sentiment and refrain from basing trades solely on technical signals during periods of heightened volatility or significant economic announcements.
To enhance accuracy and minimize the occurrence of false signals, traders should consistently seek confirmation from multiple sources. Waiting for validation signals, such as bullish candlestick patterns or breaks above key resistance levels, serves to authenticate the divergence. Additionally, adhering to a disciplined approach to risk management, encompassing the implementation of Stop Loss orders and appropriate position sizing, can mitigate potential losses, even in scenarios where trades do not unfold as anticipated.
Conclusion
Hidden bullish divergence stands as a pivotal instrument within the forex trading toolkit, furnishing traders with invaluable insights into potential trend continuations and empowering them to make well-informed decisions. Through a thorough grasp of hidden bullish divergence and adept identification thereof, traders can augment their proficiency in foreseeing market movements and seizing lucrative opportunities.
Throughout the discourse of this article, we have delved into the pivotal role of hidden bullish divergence, elucidated methods for its identification, and imparted trading strategies predicated on this signal. Moreover, we have underscored the importance of corroborating signals with additional technical analysis tools and underscored the indispensable nature of sound risk management practices.
For traders aspiring to master hidden bullish divergence, engaging in practice on demo accounts emerges as a highly recommended approach. This facilitates skill refinement and accuracy enhancement devoid of real capital risk. Continual learning and staying abreast of the latest market trends and analysis methodologies constitute indispensable elements for achieving enduring success in forex trading.
By seamlessly integrating hidden bullish divergence into a comprehensive trading framework and upholding a disciplined approach, traders can ameliorate their trading prowess and attain their financial objectives.

About AdroFx
Established in 2018, AdroFx is known for its high technology and its ability to deliver high-quality brokerage services in more than 200 countries around the world. AdroFx makes every effort to keep its customers satisfied and to meet all the trading needs of any trader. With the five types of trading accounts, we have all it takes to fit any traders` needs and styles. The company provides access to 115+ trading instruments, including currencies, metals, stocks, and cryptocurrencies, which make it possible to make the most out of trading on the financial markets. Considering all the above, AdroFx is the perfect variant for anyone who doesn't settle for less than the best.
Related Articles


Latest updates
Latest updates


Technical Analysis
Latest updates


