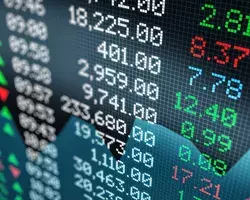
An Introduction to Stock Market Indices
The stock market is a crucial component of the global economy, and it serves as a barometer for the overall financial health of a country. Investors and traders alike use various stock market indices to track the performance of different market segments, such as technology, healthcare, or energy. Understanding the stock market indices and how they work is essential for investors to make informed decisions and manage their portfolios effectively.

Depth of the Market: Definition and Meaning
Depth of the Market is a special technical indicator developed for the MetaTrader 4 terminal. It is designed to monitor the current price movement and also to determine the supply and demand zones. This tool has the form of a histogram or, as it is also called - the price ladder. Let's consider its installation, settings, and process of use in practice in detail.
Understanding Price Action Patterns: Rails
In addition to the main patterns, which include pin bars and engulfing, there are some secondary patterns. They are somewhat less strong, but they can be found on the charts and if there are strengthening factors, such as support in the form of a level, they can be used as market entry signals. Today we will start with a pattern called Rails.

Investing in Precious Metals in 2023
Precious metals such as gold, silver, platinum, and palladium have been valued for centuries for their rarity, beauty, and durability. While these metals are often used in jewelry, they also have many industrial and technological applications. Additionally, precious metals have long been seen as a hedge against inflation and a safe haven for investors during times of economic turmoil.

Stop Loss in Trading: How to Say No
Almost all experienced traders of the forex market agree that it is necessary to set stop losses in any style of trading. Beginners, newcomers to the market, often neglect this rule, but with time they also come to understand it (or they simply stop trading because of the constant losses). Let's try to figure out why a Stop Loss is so important for successful trading and sustained profits.

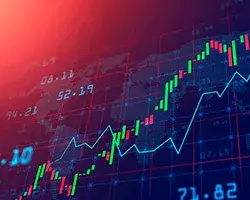
Technical Analysis for Beginners: Yes, It Is Possible
Technical analysis in trading is used to make forecasts of price movements and helps to determine the exact entry and exit trading points. There are many analytical methods used by traders, which are able to track the statistical direction and speed of value and quotes in the market. In this article, we will provide insight into the fundamental aspects of technical analysis every beginner should know.

Investment Time Horizon: Definition and Its Role in Investing
Beginning investors who come to the stock market are inevitably confronted with terminology that is new to them. An accurate understanding of this vocabulary makes it possible to quickly understand the principles of the investment mechanism and learn how to make all necessary calculations without errors. In general, for a beginner investor to start meaningful actions it is enough to assimilate a limited set of the most important concepts, which includes the investment horizon.

What Is Fibonacci Retracement? Definition & How to Use It
Setting the support and resistance levels is usually a problem for traders. It is especially inconvenient when trying to figure out from the beginning where to place them on the chart: one may think there are no good points to be plotted and it may be better to choose another time frame. Then the chart begins to change direction - and the support that has just been plotted becomes resistance. Immediately the question arises: "Where to build new support and how long to wait for it?"

What Is Money Flow Index (MFI) In Forex Market Trading
One of the most important functions of financial markets, including the foreign exchange market, is the redistribution of money. Through the purchase/sale of stocks, precious metals, and currency, money passes from person to person, from company to company. Thus, in a market economy, a certain balance is naturally achieved, and an equilibrium is established. The inflow or outflow of money is called cash flow.
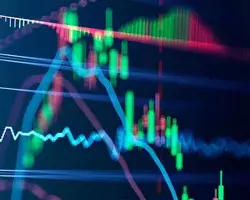
How to Use Volume in Technical Analysis to Improve Your Trading
Most traders know that the methods of technical analysis are based on the study of changes in the movements of price charts and the Market Depth. However, another important object of technical analysis is trading volumes. Experienced traders believe that there are two objective factors in the market: the price and volumes. Let's see in more detail what a trading volume is, how to analyze it, and which tools for its evaluation are available to a modern trader.