What Is Money Flow Index (MFI) In Forex Market Trading

One of the most important functions of financial markets, including the foreign exchange market, is the redistribution of money. Through the purchase/sale of stocks, precious metals, and currency, money passes from person to person, from company to company.
Thus, in a market economy, a certain balance is naturally achieved, and an equilibrium is established. The inflow or outflow of money is called cash flow.
Forex is also an incredibly complex and dynamic system of such cash flows. An experienced trader can see these hidden cash flows behind drawings of charts and indicator readings. However, anyone can visually see these flows, if they use a special indicator. This indicator is called Money Flow Index.
Money Flow Index (MFI) Indicator
Money Flow Index (MFI) is a technical indicator of price movement speed, which is similar to the Relative Strength Index (RSI). Its difference from RSI is that the volume indicator is considered in calculations. The author of the indicator is trader Bill Williams, he described this tool in his book "Trading Chaos". Creating the oscillator, he spoke about the tick volume as an important indicator of market expectations, interrelated with the price movement.
The volume indicator is the new orders arriving in the market, changing the rate of movement. Or in another way, new players enter the market increasing the number of trades, which shows the change in tick volume. Thus, the strengthening or reduction of the existing dynamics occurs.
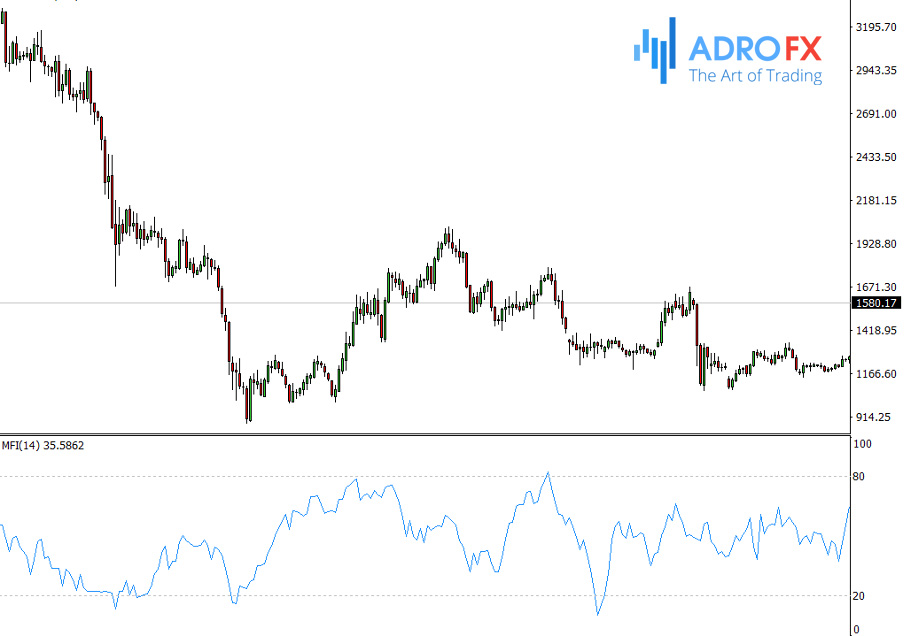
The main advantage of the MFI is that it is a stable instrument that gives a reliable measure of the strength of the cash flows invested in an asset (such as a currency or stock). The Money Flow Index compares positive and negative cash flows, yielding a measure that, when compared to price data, determines the strength of the trend. Like the RSI, the MFI takes values from 0 to 100 and is calculated using 14 candles. To see how the MFI indicator looks visually on the MetaTrader 4 platform:
How Does the Money Flow Indicator Work?
The MFI works on the principle of comparing the readings of positive and negative cash flows of the market. If the price index for a certain period is higher, it indicates a positive inflow of funds into the asset. If the price index for a period is lower, it indicates that investors are withdrawing funds from the asset.
By tracking the price movements of an asset and showing whether the trading volume is going up or down, the MFI signals the strength of a trend to justify trading with it, to identify the start of a new trend, or the times when it is best to avoid placing orders. It is especially valuable in forex trading, as it allows for making high-quality forecasts of market entries.
Working with the Money Flow Index, you should consider the following tips:
- Data on the divergence between the indicator and the price movement. If prices grow and the Money Flow Index value decreases (or vice versa), a price reversal is possible;
- Readings of the Money Flow Index above 80 and below 20 indicate a potential top and bottom of the market;
- The MFI works well in all time frames - from five-minute to weekly charts.
Setting up this indicator is laconic. There is only one parameter - the period (by default, it is 14) for which the calculation is performed. The smaller the value of the period, the more responsive and volatile will be the MFI:
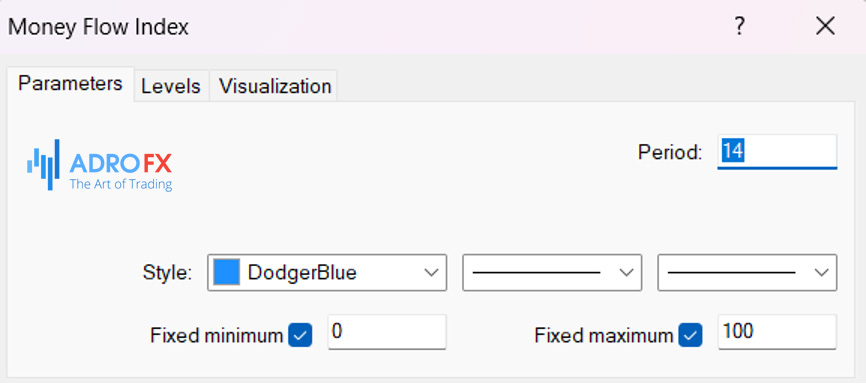
Remember, too much sensitivity is also not very good - there will be a lot of false signals.
In addition, you can customize the style of the indicator display and set levels. By default, they are 20% (20% and less - oversold area) and 80% (80% and more - overbought area).
How to Calculate the Money Flow Index Indicator
The MFI indicator has a fairly complex calculation algorithm. There is no need to remember it by heart, but it is worth getting acquainted with it to have a general idea of the logic behind the indicator.
Stages of the MFI calculation:
- Calculation of the arithmetic mean between the candle's closing price, minimum and maximum price;
- Calculation of the Money Flow per unit of time by multiplying the average price by the volume and dividing it by a positive flow (current average price is higher than the previous one) or a negative flow (average price is lower than the previous one);
- Calculation of the Money Ratio indicator as a result of dividing the sum of positive flows by the sum of negative flows;
- Calculation of the Money Flow Index indicator values directly. To do this subtract the result of dividing the number 100 by the sum of the Money Ratio indicator and one.
The resulting values fluctuate between 0 and 100. Lines 20 and 80 or 30 and 70 are considered significant levels. The area between 80 (70) and 100 is called an overbought area. The area between 0 and 20 (30) is known as an oversold area.
How to Read Money Flow Index Signals MFI
After getting acquainted with the principle of the MFI, we can move on to the study of its trading signals. There are three main ones:
1. Overbought/oversold. Like RSI and other oscillators, the Money Flow Index is perfect to determine the moments of the market "overheating". If the MFI exceeds the 80% level, it means that the market is overbought. As soon as the indicator begins to go back down and crosses the 80% level again, but this time downwards, it will be a signal to sell. And vice versa, when the indicator descends below the 20% level, followed by rising and exiting the oversold area, it will serve as a signal to buy.
2. Divergence. It is a classic and very strong reversal signal for oscillators. Divergence - the discrepancy between the price movement direction on the chart and the indicator readings. And at such divergence, it is necessary to follow precisely the indicator.
For example, on the chart, there are two local minimums (troughs), and the second trough is lower than the first one. Visually, the price on the chart is falling, the trend is downward. But on the indicator chart, the picture is the opposite. There also formed two troughs corresponding to those on the price chart, but the second indicator minimum is higher than the first one. It is a bullish divergence, which suggests that the market will soon reverse and go up.
The same, but in reverse (divergence in the highs, and peaks), will be a bearish divergence, signaling a downward market reversal. By the way, if the divergence is not on the 2nd, but on the 3rd extremum (highs, lows), the signal will strengthen even more.
3. Intersection of the central line. This is probably the simplest trading signal of the MFI. We add the central line (50%) to the indicator chart and wait for it to be crossed. If the MFI crosses it from the bottom upwards, it is a buy signal; from the top downwards - sell signal.
Let's find out how to trade using the Money Flow Indicator readings.
Trading the Money Flow Index
The principles of using the MFI indicator values in trading are not different from using RSI. Let's discuss them one by one.
Exit from the overbought or oversold area
As we have mentioned above, the 20 and 80 levels are considered key levels for the Money Flow indicator. When the pair crosses line 80 downwards, the indicator gives a signal to sell the currency pair. If the chart line exits the oversold area (crosses upwards through the 20 level), we should expect a price rise.
These signals are not 100% accurate and require additional filters. You can use similar oscillators with overbought and oversold areas, which are calculated on a different principle, to check the readings of the indicator. For example, Stochastic.
The position of the MFI indicator relative to the 50 level indicates the sentiment of the pair. If the chart crosses it downwards, it indicates that the pair is in a bearish mood. When the indicator line crosses above the 50 level, it indicates that the market is dominated by the bulls.
Detecting divergences
You can use the Money Flow Index to look for divergences. The example below shows the divergence between the price of an asset and the MFI values:
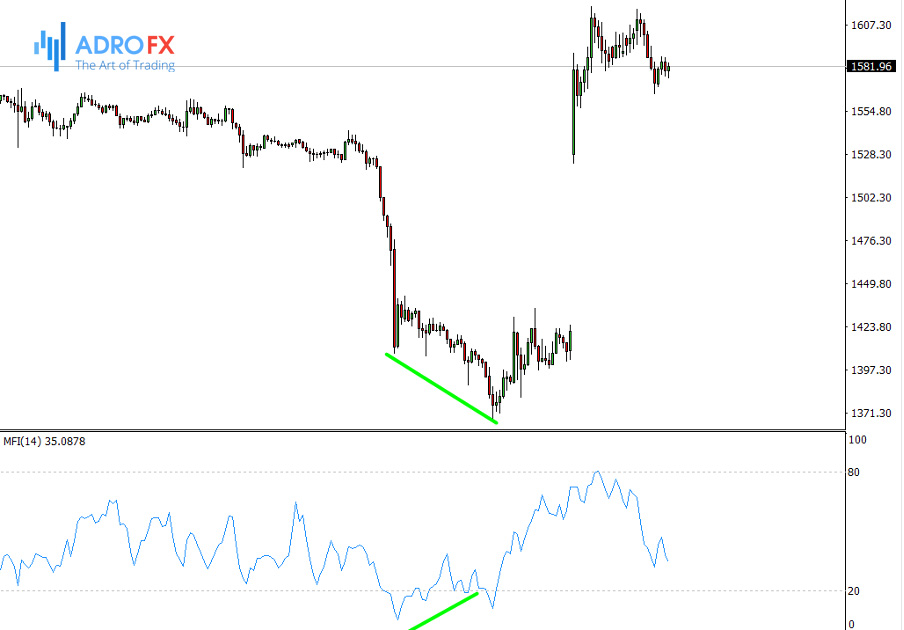
The downward trend can be seen on the chart with the naked eye. The market is driven by the bears. The minimums on the chart are increasing. At the same time, the indicator MFI forms a new local minimum not above, but below the previous one. Soon the dominant force in the market passes to the bulls.
Looking for chart patterns
The same methods of technical analysis are used for the Money Flow Index indicator chart as for the price chart. For example, you can mark the trend lines in the window of the tool and enter the market on the trend breakout. Or find a technical pattern on the indicator chart, as in the example below:
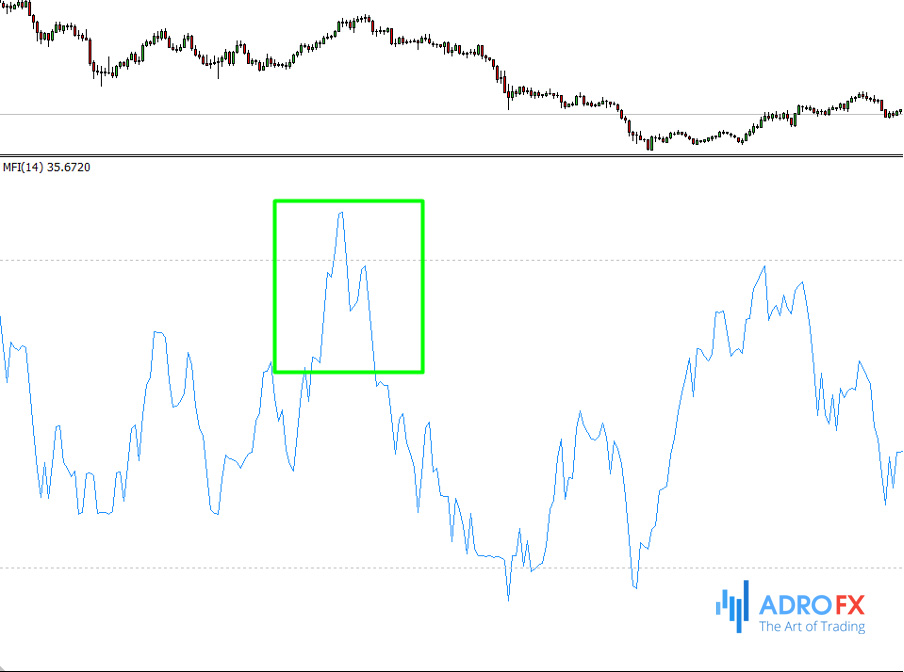
The tool lines have formed a Head & Shoulders pattern. The strengthening factor, in this case, is finding the pattern in the overbought area. On the breakout of the imaginary neckline, it is possible to place a sell order. As we can see from the history, in the example above the price was flat for some time, and then it went down.
The MFI indicator that measures the intensity of cash flow is a universal oscillator. It is suitable for working on the classical scheme (search for divergences, overbought/oversold areas), but it is not strong enough to work without additional tools. It is better to use it together with other indicators to reduce the number of false entries into the market and increase trading profitability.
Related Articles


Latest updates
Latest updates


Technical Analysis
Latest updates


