Depth of the Market: Definition and Meaning
Depth of the Market is a special technical indicator developed for the MetaTrader 4 terminal. It is designed to monitor the current price movement and also to determine the supply and demand zones. This tool has the form of a histogram or, as it is also called - the price ladder. Let's consider its installation, settings, and process of use in practice in detail.
What Is Market Depth
Market Depth is a measure of the supply and demand of a particular asset at different prices. Market Depth indicators are used in financial markets, such as stocks, futures, and foreign exchange markets, to provide insight into the level of liquidity and potential price movements.
The Depth of the Market indicator shows the number of open buy and sell orders at different price levels. It displays the quantity of securities or contracts that market participants are willing to buy or sell at a particular price level. The greater the quantity of buy and sell orders at a given price level, the deeper the Market Depth at that level.
Traders and investors use Depth of the Market to make informed decisions about buying or selling an asset. For example, if there are many buy orders at a particular price level, it may suggest that the price is likely to rise. Conversely, if there are many sell orders at a particular price level, it may indicate that the price is likely to fall.
But what information one needs to pay attention to? Here are some aspects to consider:
Large orders
Reading the data of the indicator, tracking orders which are larger than the average volume. A large order is considered in the context of its issuance. It is worthy of attention.
Duplicate orders
Some brokerage companies in a very large market, due to the lack of opportunities to open positions in the over-the-counter market, have to use various tricks to accumulate positions in the stock market so that they cannot be seen. One such method is to enable an algorithm that buys/sells a certain number of lots at the market price at certain intervals. This can be equal volume at a fixed interval or varying (10, 20, 30 lots) at random intervals (e.g. between 3-20s).
Supply and demand
According to the supply or demand, it is possible to judge the mood of the players in the market. If demand exceeds supply, the market looks bullish, or will soon change the trend to this one. If there is more supply than buyers, the price is likely to fall, and then it is a bear market.
The indicator is located directly on top of the main working chart. It shows the price direction and helps to identify the most profitable points of opening and closing orders. Its histogram lines can be used as resistance and support levels. Besides, the tool shows the degree of traders' interest in the purchase or sale of this or that asset.
Advantages and Peculiarities of the Indicator
The Depth of the Market indicator, also known as the order book, is a useful tool for traders and investors to assess the current supply and demand levels of a particular asset. Here are some advantages and peculiarities of using the Depth of the Market indicator:
Advantages:
- Provides more detailed information: The Depth of the Market indicator provides a more detailed view of the current market than just the current price. It allows traders to see the number of buy and sell orders at different price levels, which can provide insight into the market's sentiment.
- Helps with order execution: Traders can use the Depth of the Market indicator to determine the optimal price levels to place their buy or sell orders. This can help with executing trades more efficiently and at better prices.
- Provides transparency: The Depth of the Market indicator provides transparency into the market, as traders can see all the orders that are currently in the market. This can help to prevent market manipulation and ensure a fair trading environment.
Peculiarities:
- Limited to exchange data: The Depth of the Market indicator is limited to the exchange's data, so it may not provide a complete picture of the entire market.
- Can be manipulated: Traders can manipulate the indicator by placing fake orders at certain price levels. This can make it unreliable at times.
- Requires interpretation: The Depth of the Market indicator requires interpretation, and traders need to be skilled at interpreting the data to make informed trading decisions. It can take some time and practice to become proficient in using the indicator.
How Market Depth Works in Trading Platform
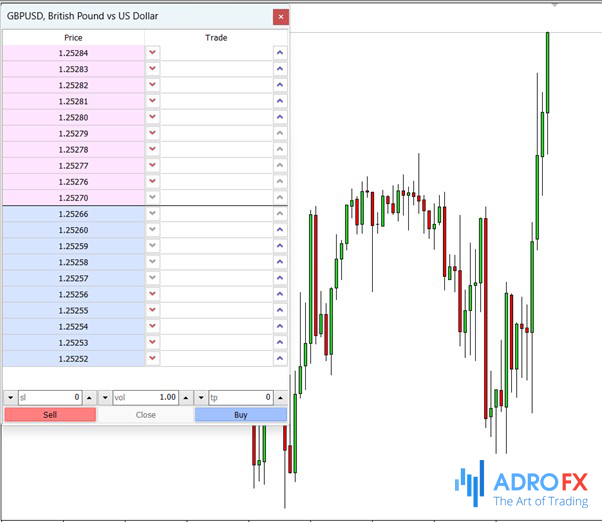
After installation, you will see Depth of the Market on the chart. The indicator histogram bars are located horizontally in relation to the working chart. You can move the indicator to the right or to the left side of the chart area, if necessary.
The tool shows the current value of the asset price, as well as displays information about the volume of pending Buy and Sell orders. Thus, guided only by its data, a trader can already see the general picture of the market and determine the tendency of price movement.
The histogram is drawn in two colors - red and green. All pending buy orders at a value exceeding the current price will be highlighted in green. The bar length will correspond to the volume of the pending requests for each of the analyzed levels.
The bars highlighted in red reflect the information on the pending sell orders. The bar length also shows the volume of the pending orders. The longer the bar is, the higher the volumes are.
Pay attention that green bars can be used as resistance levels and red ones as support levels.
Thanks to simple digital markup, a trader can easily calculate the volume of pending buy and sell orders for certain price values.
Trading the Depth of the Market
Depth of the Market can be used for different types of strategies. When trend trading, its levels can be used as a reference point for price movement. For example, if you see that the price has reached a strong resistance level and at the same time the volume of purchases has reached a maximum and begins to decrease, this is a signal for a trend reversal in the direction of the bears. You may open a short position. The same rule works in the opposite situation when the price has reached the support level.
However, much more often this tool is used when trading not by trend, but by scalping techniques. Everything works according to the same scheme here:
- First, it is necessary to find a currency pair chart, where the price moves in a certain range. The price movement corridor should not be too narrow.
- When opening positions, only two indicators should be taken into account - the volume of buy trades and the volume of sell trades.
- If buy and sell volumes are approximately equal, this is a signal for the closing of all active orders and fixation of profits and losses. At such moments the market is in a state of uncertainty.
- If the volume of buy orders is considerably higher than the volume of sell ones, this is a signal for the opening of a long position.
- If the volume of sell orders exceeds the volume of buys, this is a signal for the opening of a short position.
- Note that the stronger the difference in volumes of demand and supply - the stronger the signal. Usually, the minimum ratio is 40% to 60%.
- To filter the signals, you can use any oscillator, such as Stochastic. In this case, the exit of the oscillator from the overbought or oversold area will be a confirmation for placing a trade.
- If the Stochastic left the oversold area, breaking out the 20/30 level from bottom to top, this is a confirmation signal to open a buy trade.
- The exit of the Stochastic Oscillator from the overbought area (the line has broken out the 80/70 level from above downwards) confirms a sell signal.
- You can use any other filtering tools - RSI, Awesome, ATR, ADR, MACD, etc.
The Depth of the Market indicator allows you to determine the market volumes considering the pending orders. Therefore, its signals can be considered more accurate than those of other similar tools.
Effectiveness of Depth of the Market
Ten years ago, traders couldn't imagine their work without using quote log data. But nowadays, the effectiveness of these reports is being questioned. Every year more and more sophisticated trading strategies appear on the market, demonstrating their reliability and profitability. Due to constant improvements in trading approaches, market participants are less likely to resort to the Depth of the Market indicator due to the following reasons:
- The huge array of hidden orders makes it impossible to fully assess the current trading situation.
- Large market players often use the method of placing fake orders to profit at the expense of inexperienced traders.
- False signals. It often happens that a technical indicator gives a signal for the trend continuation, but the chart shows the opposite. Such a situation can play a bad joke on a trader.
Conclusion
The Depth of the Market indicator is a real helper for any day trades. Mid- and long-term trading does not imply the use of this tool, but understanding the information can help to improve the estimation of market conditions and choose the moments of opening trades with the best risk/reward ratio.
About AdroFx
Established in 2018, AdroFx is known for its high technology and its ability to deliver high-quality brokerage services in more than 200 countries around the world. AdroFx makes every effort to keep its customers satisfied and to meet all the trading needs of any trader. With the five types of trading accounts, we have all it takes to fit any traders` needs and styles. The company provides access to 115+ trading instruments, including currencies, metals, stocks, and cryptocurrencies, which make it possible to make the most out of trading on the financial markets. Considering all the above, AdroFx is the perfect variant for anyone who doesn't settle for less than the best.
Related Articles


Latest updates
Latest updates


Technical Analysis
Latest updates


