US Job Growth Slows in March 2023 | Daily Market Analysis
Key events:
- UK - Easter
- Switzerland - Easter
- Australia - Easter
- New Zealand - Easter
- USA - FOMC Member Williams Speaks
The US economy created 236,000 new nonfarm jobs in the first month of spring 2023, according to data released on April 7 by the Labor Department. The figure was slightly higher than economists' consensus forecasts, which suggested an increase of 230,000 jobs. February employment growth was revised upward from +311,000 to +326,000 jobs. For the 11th month in a row, the actual numbers have exceeded the consensus expectations of experts.
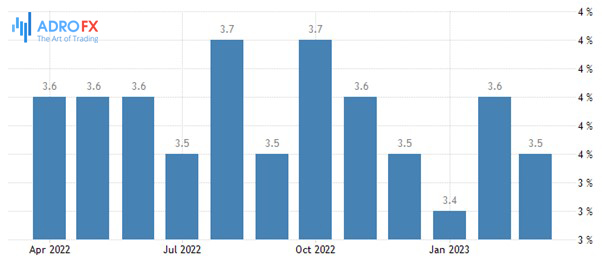
The unemployment rate in February unexpectedly fell to 3.5% from 3.6% in February. Economists had predicted the rate would be unchanged from the previous month.
Average hourly earnings rose 0.3% in March over February. This was in line with expectations. On a year-to-year basis, hourly earnings rose 4.2% y/y. The data was below the forecast (+4.3% y/y) and below the February figure (+4.6% y/y).
The rate of new job growth has declined for two months in a row. The 236k increase in March is the slowest in 26 months, the slowest since December 2020, when the economy lost 268k jobs. Wages on a year-to-year basis are growing at the slowest rate since June 2021. And at the same time, the unemployment rate is unexpectedly down to 3.5% and just 0.1% higher than the 3.4% rate in January. January's unemployment rate was the lowest since mid-1969, the lowest in 54 years.
Recall that a number of major US companies, mostly (but not limited to) those in the technology and financial sectors announced high-profile layoffs in December 2022 and January 2023. But so far, the employment numbers have not reflected that in the statistics. Experts believe that the March statistics released today are only the first reflection of the cuts announced, in the coming months we may see a sharper decline in job growth.
However, if we recall the Fed officials' own forecasts (dot plot), they projected an unemployment rate of 4.5% at the end of 2023. Now the situation is such that, obviously, the actual unemployment rate at the end of the year will be lower than this forecast. But there is a risk that problems in the banking sector that arose in March, as well as tighter financial conditions, will lead to an increase in the rate of unemployment. Although Bloomberg's analysis of the period since 1948 shows that sudden jumps in the unemployment rate, if they occur, usually happen in the middle of a recessionary cycle.
Thus, assuming a scenario in which the US economy goes into recession in Q3 or Q4 of 2023, a surge in unemployment could occur in Q1 or Q2 of 2024.
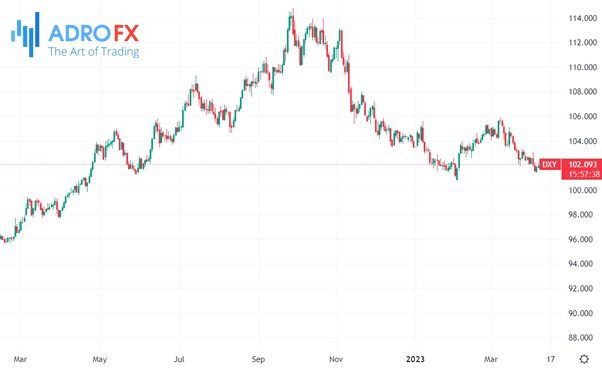
The implication is that the Fed still has good reason to raise its rate in May by 25 bps to 5.00-5.25%. At the same time, there is reason to believe that the Fed, if it does cut rates before the end of the year, will only cut them once in 25bp increments, most likely in December. And if so, the dollar index retains the potential to correct into the 105-106 point area over the next 3 months.
This implies an increase of 3-4% from current levels. That said, the main medium-term trend remains bearish, and for now, the base case scenario is for the dollar index to fall into the 100-90 point range over the 10-12 month horizon.
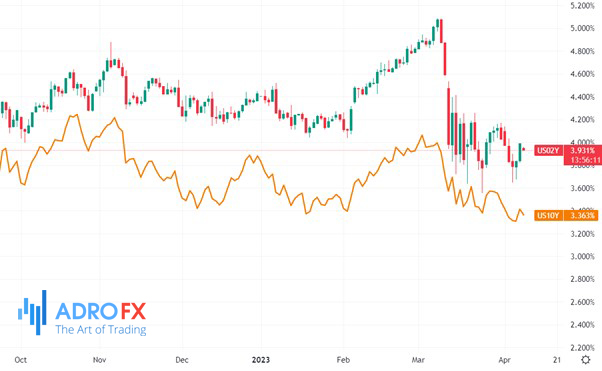
As for market reaction, stocks were not trading on Good Friday, April 7. But the debt market was working. Treasury bond yields rose the length of the curve on Friday. The yield on the 2-year notes added 15 bps to 3.981% and the yield on the 10-year notes rose 8.6 bps to 3.391%. The federal funds rate futures market implies a 70% probability that the Fed will raise the rate by 25 bps to 5.25% (upper bound) in May. On the eve of the March labor market report, the probability of such a move was estimated at 53%. Meanwhile, the money market implied a terminal rate of 4.2% at the end of December 2023 and now 4.26%.
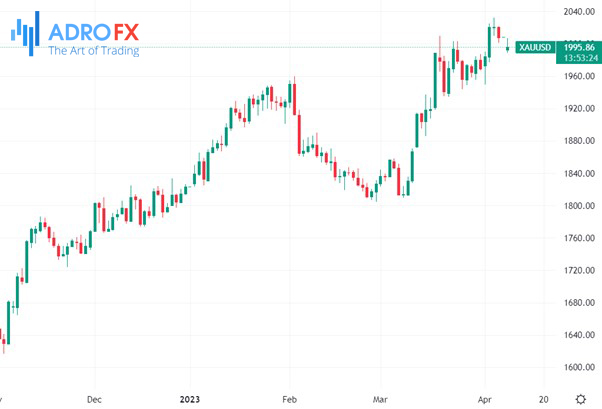
At the same time, an increase in bond yields made gold prices drop. To see sustainable growth in gold prices, the market will need to start questioning the Federal Reserve's commitment to meeting its inflation targets, as it did earlier this year. However, currently, this is not the base case scenario.
During high inflation periods, gold prices typically rise when the central bank prioritizes economic growth, but fall when the bank focuses mainly on controlling inflation. As we approach the May 3 FOMC, the inflation data from CPI week will be crucial in determining the Fed's actions. Given the persistence of inflation, most traders are reducing their long positions with US yields moving higher post-NFP.
Related Articles


Latest updates
Latest updates


Technical Analysis
Latest updates


