Sector Divergence Leads to Mixed US Stock Outcomes Amid Economic Uncertainty | Daily Market Analysis

Key events:
- Eurozone - ECB McCaul Speaks
- Eurozone - ECB's Schnabel Speaks
- Canada - BoC Gov Macklem Speaks
- USA - FOMC Member Daly Speaks
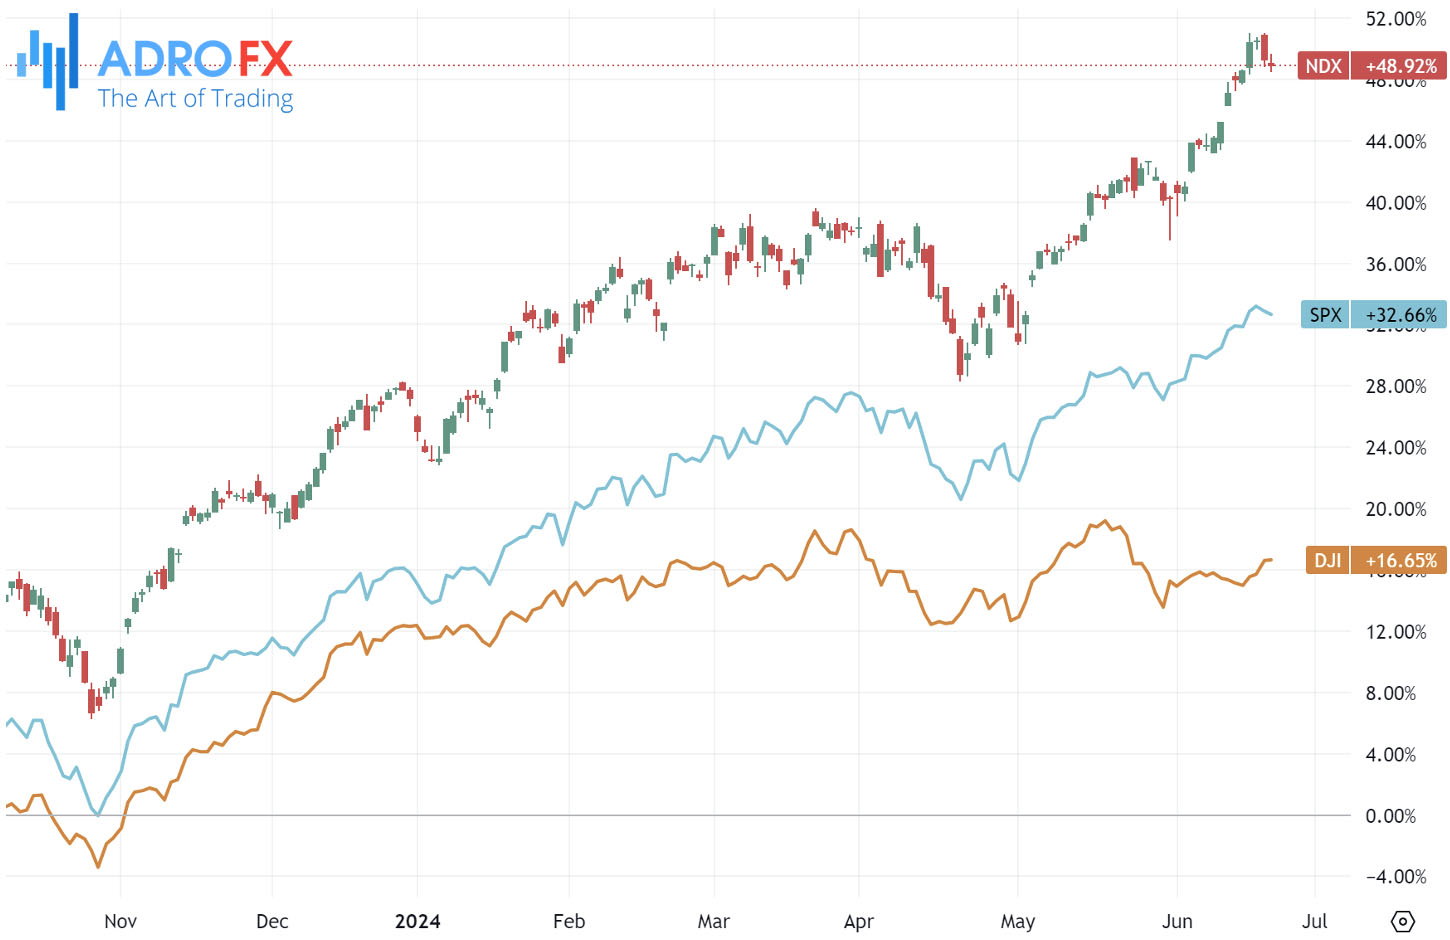
On Friday, US stocks experienced a mixed performance after the market closed. Gains in the Consumer Services, Telecoms, and Consumer Goods sectors propelled some shares higher, while declines in the Oil & Gas, Technology, and Utilities sectors dragged others lower.
At the closing bell on the NYSE, the Dow Jones Industrial Average edged up by 0.04%, while the S&P 500 index fell by 0.16%, and the NASDAQ Composite index also dipped by 0.16%.
The US economy continued to present a mixed picture of its strength. S&P Global's June PMI readings surpassed expectations and improved upon May's data. However, the housing sector showed signs of weakness as May's Existing Home Sales fell short of expectations and declined from April's figures.
Throughout the week, US economic data highlighted ongoing uncertainty. Some indicators, such as Industrial Production, S&P Flash PMIs, and Retail Sales, showed improvement, although Retail Sales growth was slower than the previous month. Conversely, the housing sector weakened, and the labor market revealed higher-than-expected unemployment claims, sustaining investor hopes for a potential Fed rate cut in September.
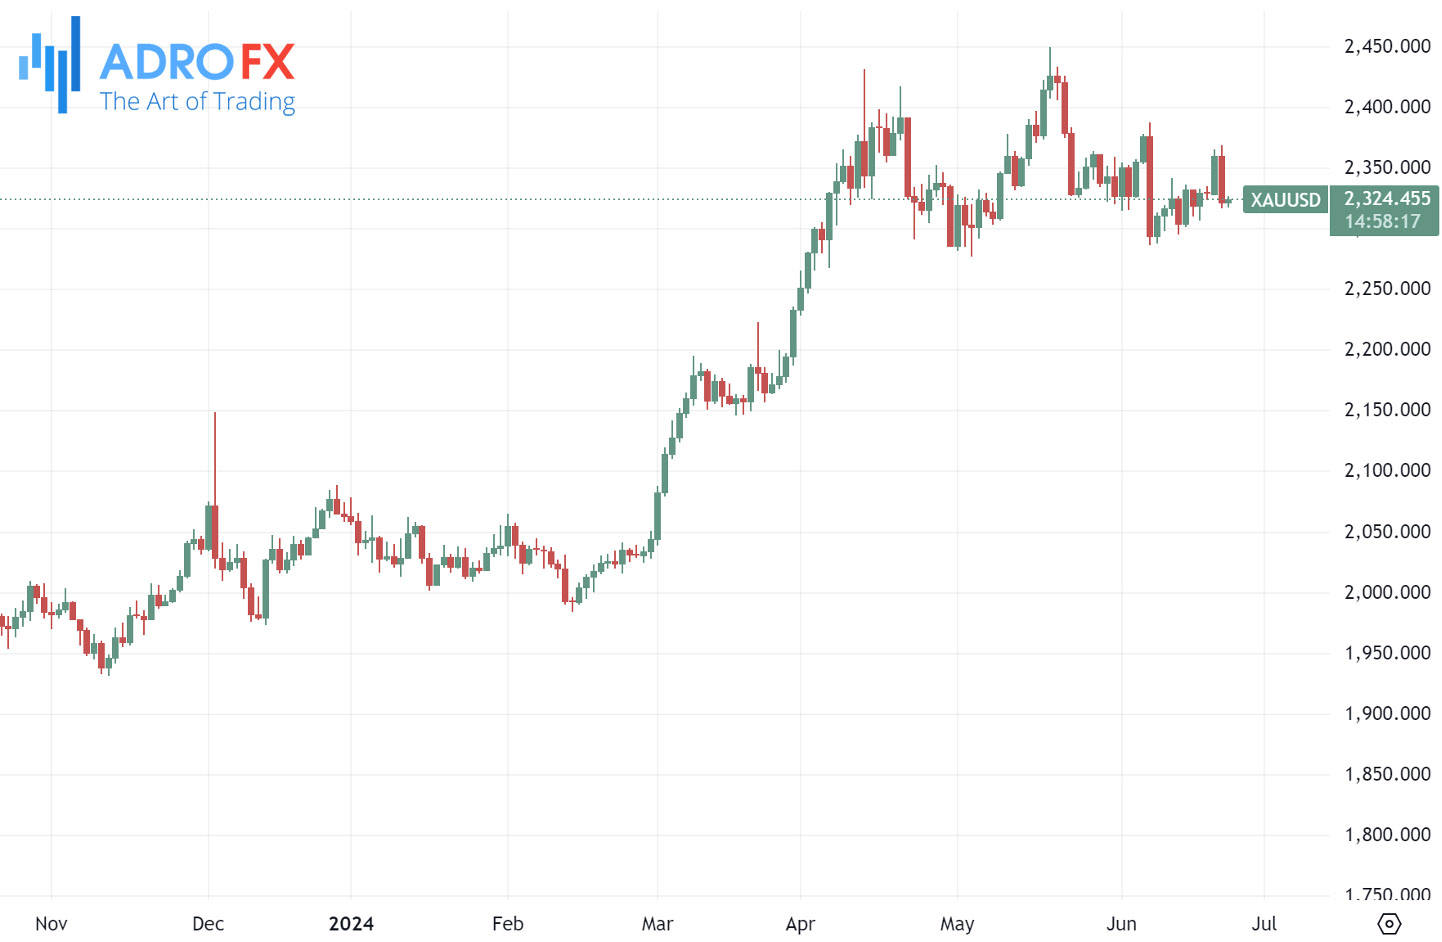
Amid this backdrop, gold prices continued to decline, driven by technical indicators suggesting a correction following a three-month rally that peaked in March, pushing XAU/USD to an all-time high of $2,450.
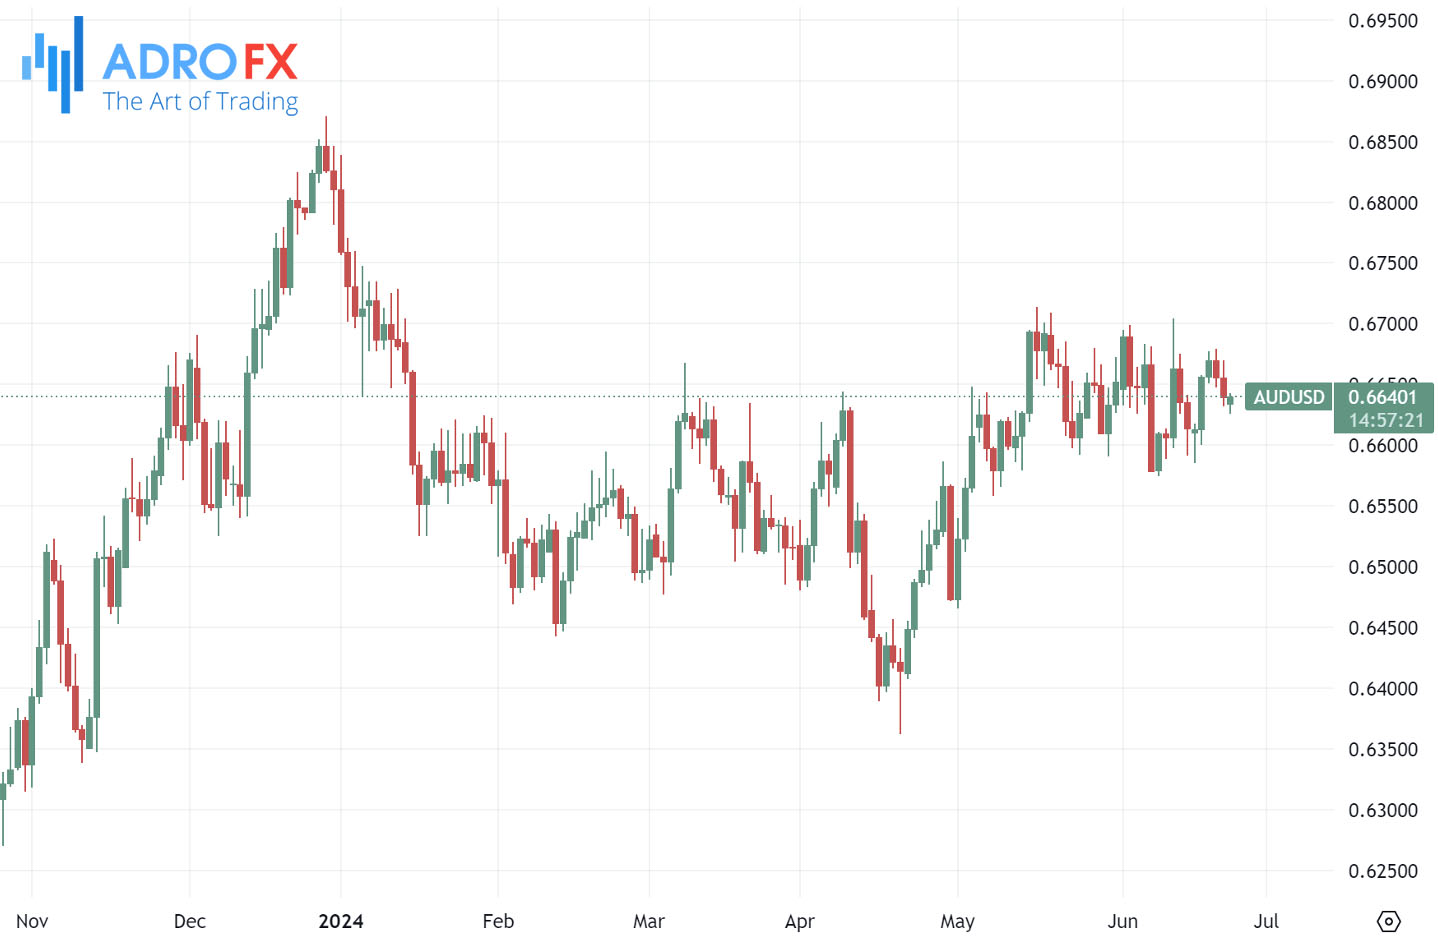
In currency news, the Australian Dollar extended its losses for the third consecutive session on Monday. However, the AUD/USD pair's downside may be limited due to the Reserve Bank of Australia's hawkish stance. RBA Governor Michele Bullock stated in her latest press conference, reported by ABC News, that the Board discussed potential rate hikes and dismissed the possibility of rate cuts in the near term.
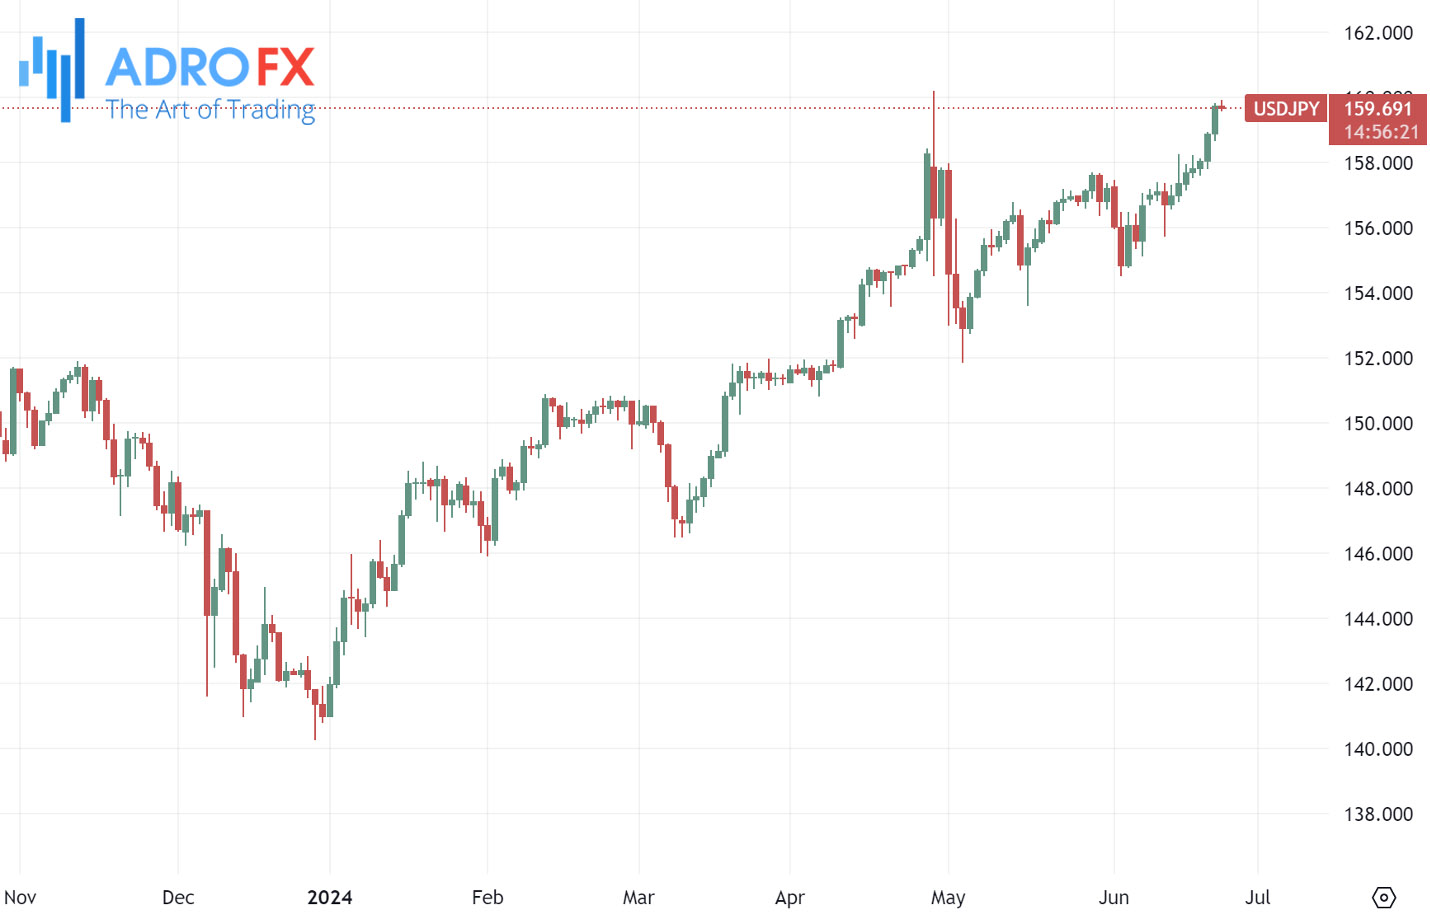
The Japanese Yen is holding its ground, likely due to verbal interventions by Japanese officials. Masato Kanda, Japan's top currency diplomat, emphasized on Monday that he would take appropriate measures to counter excessive movements in the foreign exchange market. He warned against the negative economic impacts of such volatility and affirmed his readiness to intervene as needed, around the clock, according to Reuters.
The US Dollar Index, which tracks the USD against six major currencies, edged higher. This movement is attributed to Federal Reserve officials postponing the timing of the year's first interest rate cut. The CME FedWatch Tool indicates that investors now assign nearly 65.9% odds to a September Fed rate cut, down from 70.2% the previous week.
The Bank of Japan's Summary of Opinions from its June monetary policy meeting highlighted expectations of a gradual increase in underlying inflation, as measured by the CPI. This inflation is anticipated to align with the price stability target in the latter half of the projection period.
The NZD/USD pair started the new week weaker, dropping to a multi-day low during the Asian session but finding support near the 0.6100 level. A meaningful recovery seems unlikely given the modest strength of the USD and a cautious market mood. Persistent geopolitical tensions and political uncertainty in Europe are steering investors toward safer assets like the USD, which is acting as a headwind for the risk-sensitive Kiwi.
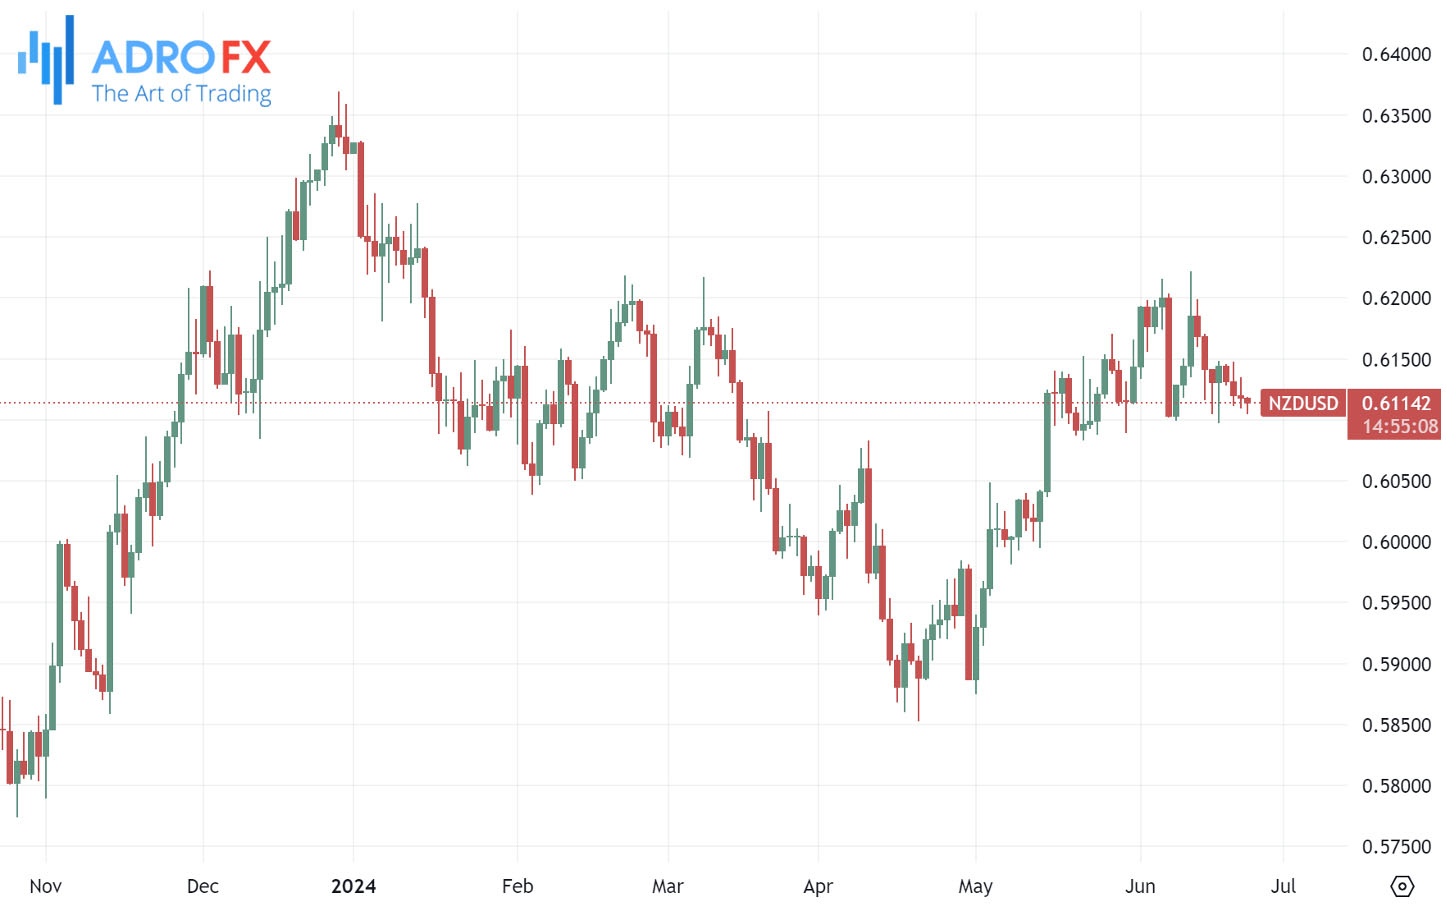
Expectations that the Reserve Bank of New Zealand will cut rates sooner than previously projected are also limiting the NZD/USD pair's gains. The RBNZ forecasted a rate cut in the third quarter of 2025 amid high inflation, but market players anticipate the start of a rate-cutting cycle early next year due to recent economic downturns. Additionally, economic troubles in China warrant caution before betting on any recovery for antipodean currencies, including the NZD.
The GBP/USD pair began the week subdued, hovering near its lowest level since mid-May. Spot prices are trading around the 1.2635 mark, with bears waiting for a decisive break below the 100-day Simple Moving Average to position for a continued decline from a multi-month peak.
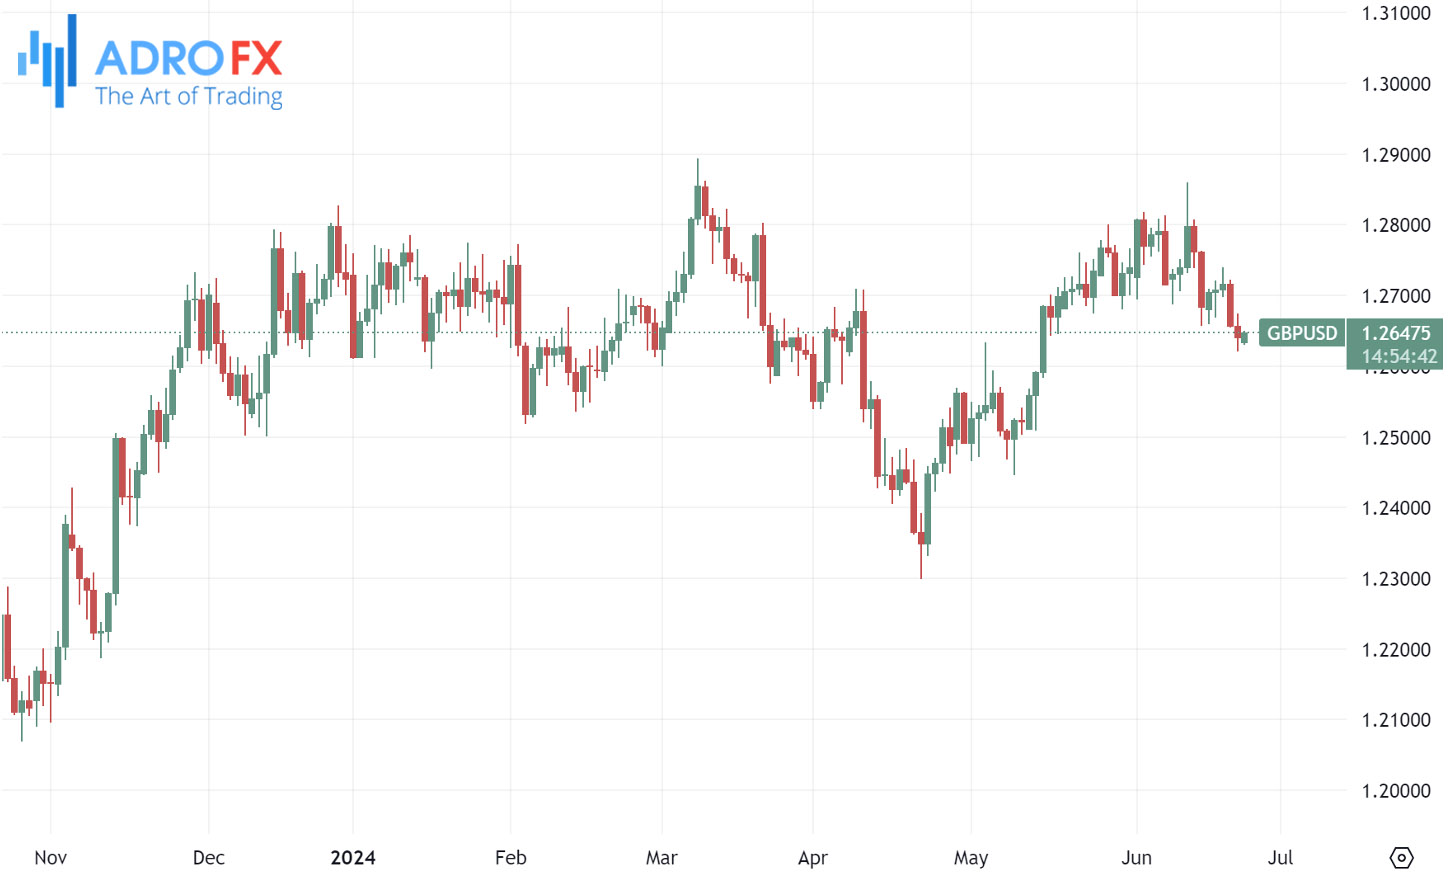
The British Pound remains under pressure following the Bank of England's dovish pause last week, which increased the likelihood of an interest rate cut at the August monetary policy meeting. Additionally, Friday's flash UK PMIs showed that private sector business activity in June grew at its slowest pace since last November. This, combined with continued USD buying, is further weighing on the GBP/USD pair.
Related Articles


Latest updates
Latest updates


Technical Analysis
Latest updates


