Insights into Leading and Lagging Technical Indicators
In the fast-paced realm of financial markets, traders navigate a landscape influenced by two pivotal types of indicators: leading and lagging. Much like fortune-tellers and historians, these indicators serve distinct roles, predicting future shifts and confirming past trends. To comprehend the intricate dance between these indicators, we first need a glimpse into the world of technical analysis.
Introduction to Technical Analysis
Before we delve into the dynamic interplay between these indicators, let's first provide a brief understanding of what technical analysis entails.
Technical analysis involves the examination of historical market data, primarily price and volume, to forecast future price movements. Traders employ various tools and indicators to make informed decisions based on patterns and trends identified in the data.
Leading and Lagging Technical Indicators Explained
Leading indicators and lagging indicators play crucial roles in technical analysis, aiding traders in interpreting market dynamics and making informed decisions. To smoothly transition between these concepts, let's first delve into leading indicators – the precursors that offer traders foresight into potential market reversals.
Leading Indicators (Oscillators)
Leading indicators are tools designed to predict potential future price movements, providing traders with insights into possible trend reversals or shifts before they occur. These indicators are valuable for those seeking to stay ahead of market developments. Common examples include:
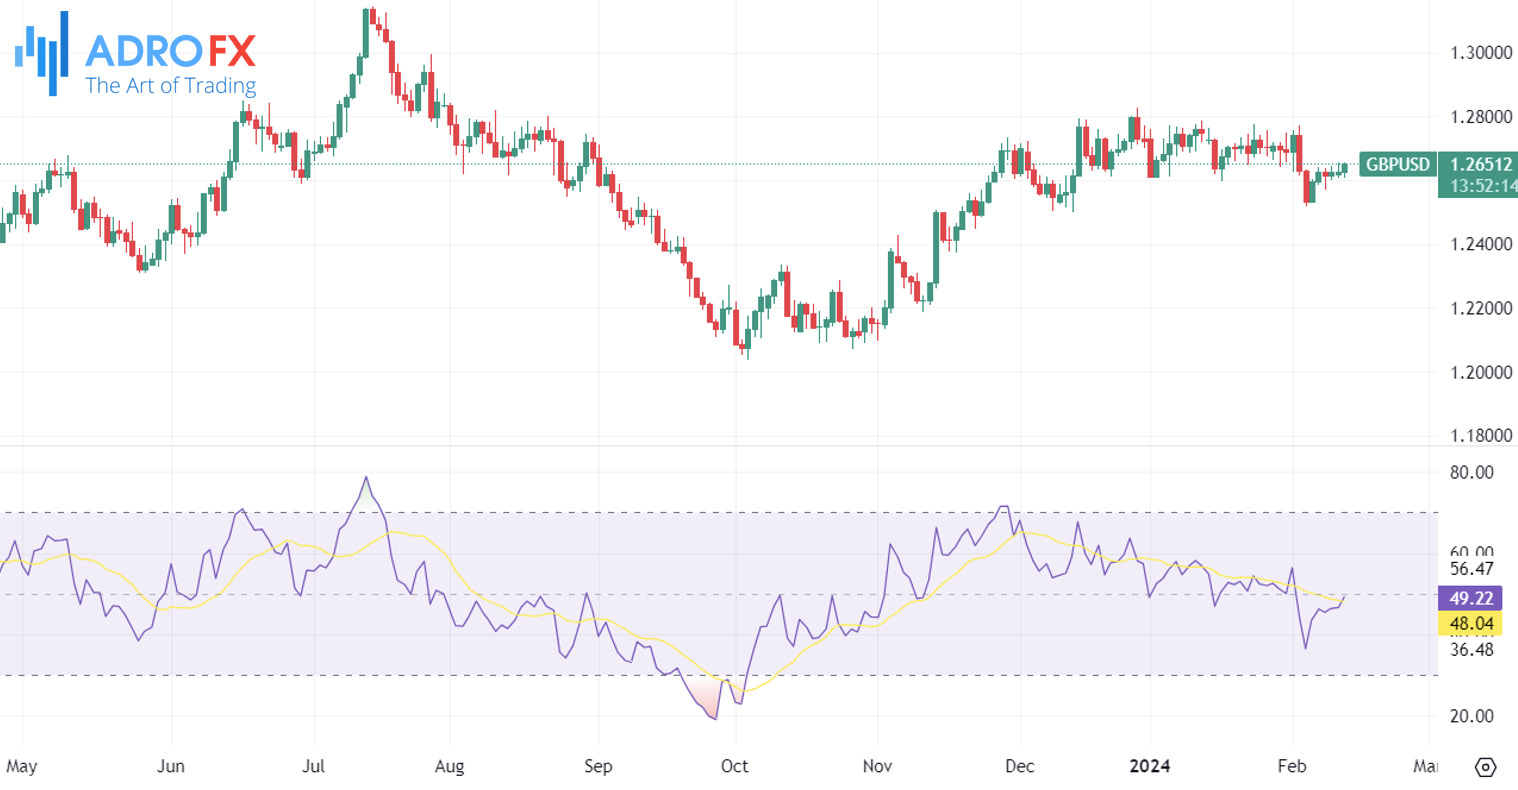
- Relative Strength Index (RSI): Measures the speed and change of price movements, indicating whether a particular asset is overbought or oversold. Traders often use RSI to anticipate potential reversals.
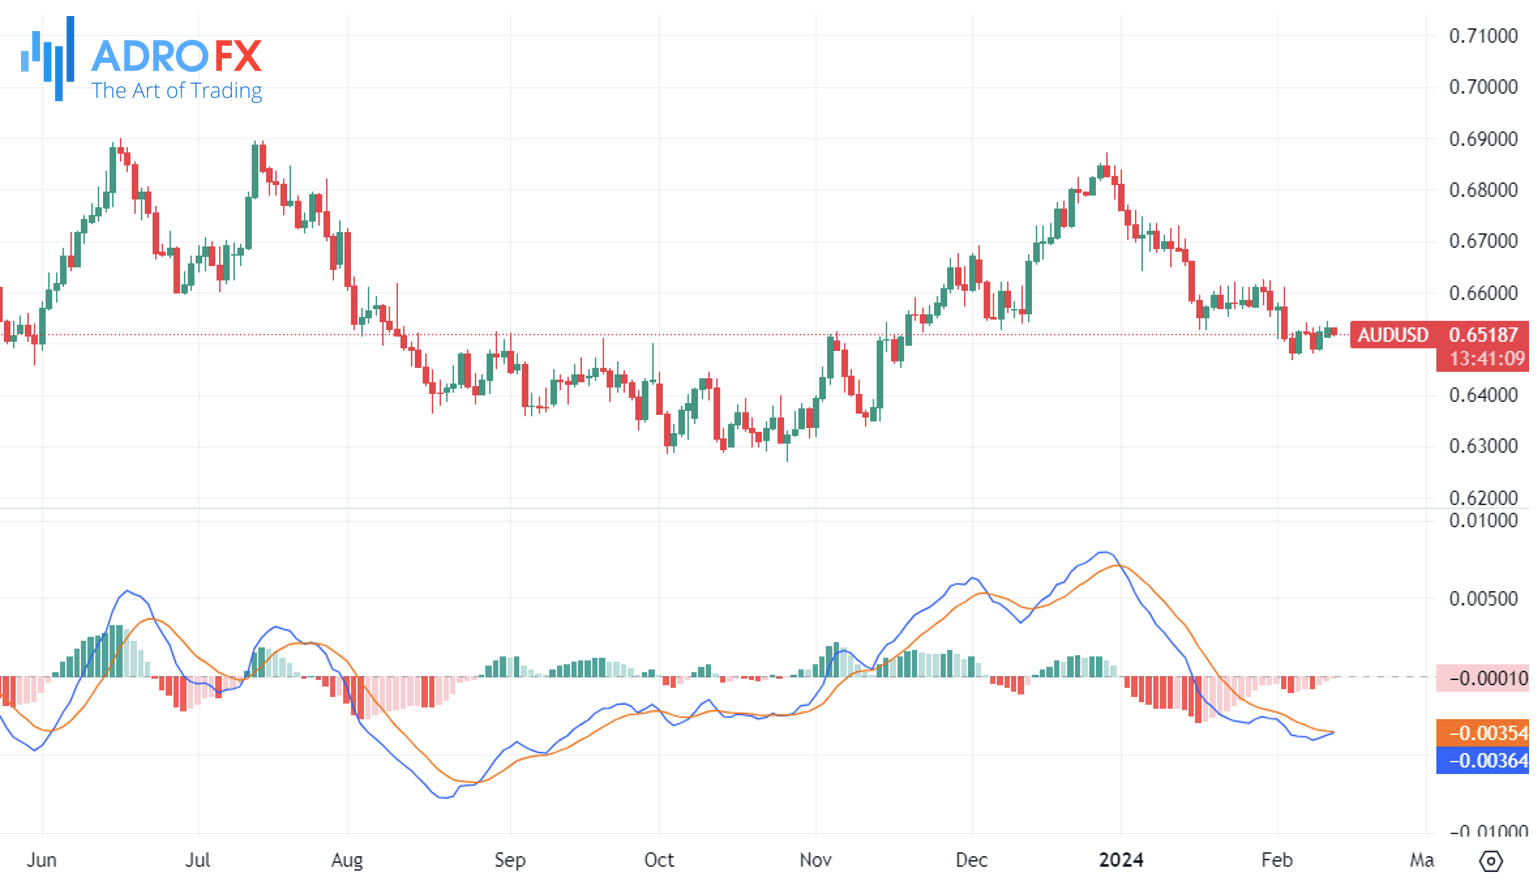
- Moving Average Convergence Divergence (MACD): A versatile indicator that combines MAs to identify changes in the strength, direction, momentum, and duration of a trend. It generates signals for potential trend reversals.
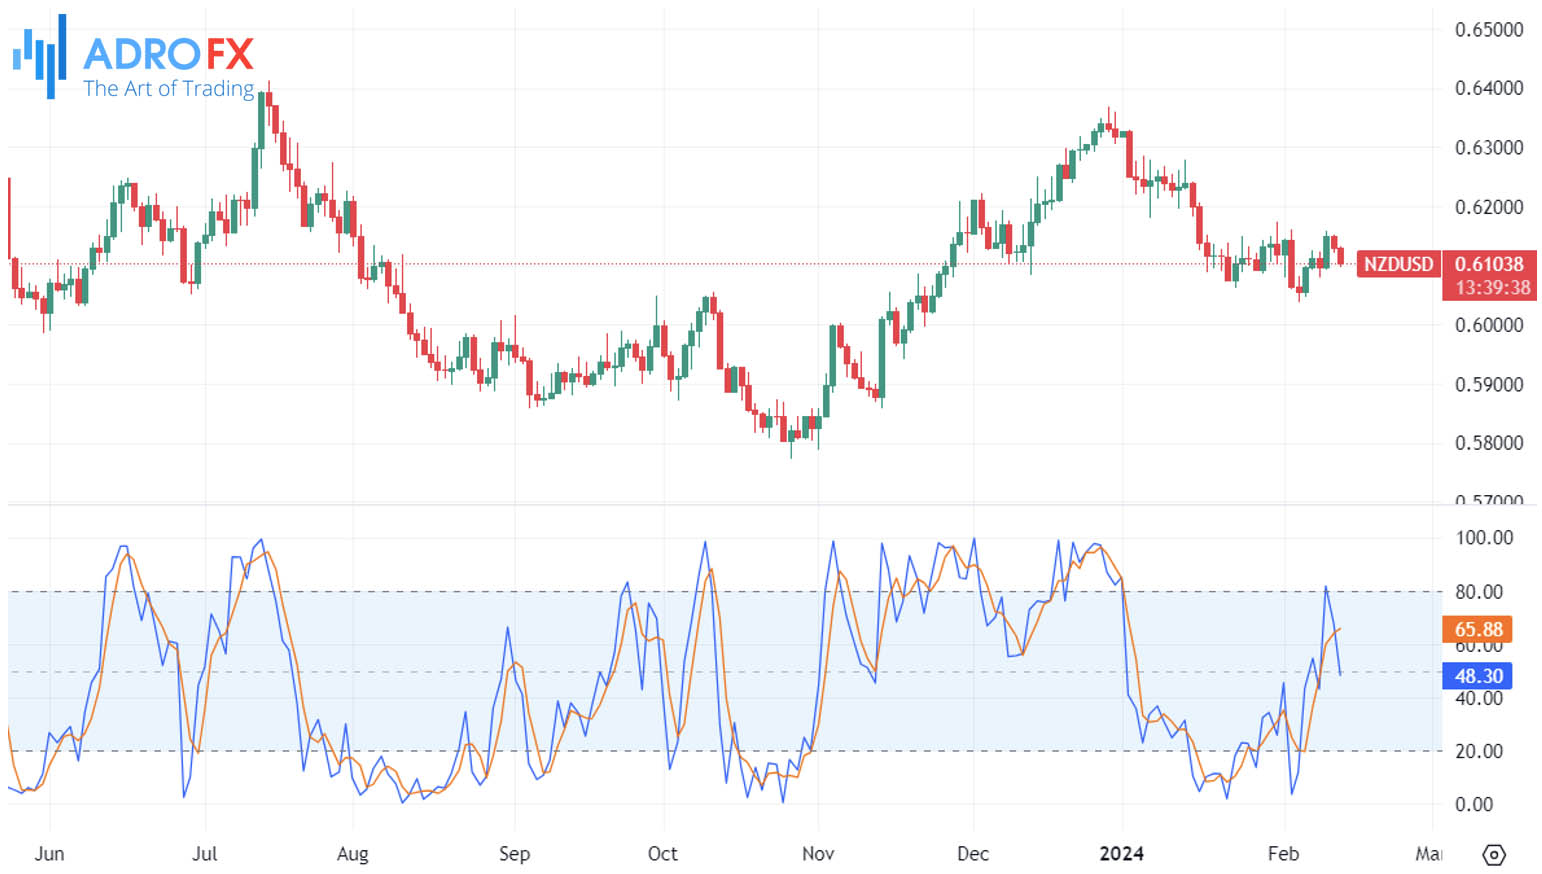
- Stochastic Oscillator: A momentum indicator that compares an asset's closing price to its price range over a specific period. It helps traders identify potential turning points by signaling overbought or oversold conditions.
Leading indicators are characterized by their proactive nature, giving traders a head start in anticipating market movements. Now, moving on to lagging indicators – the historians that confirm trends based on historical price data.
Lagging Indicators (Trend-following)
In contrast, lagging indicators are tools that confirm trends based on historical price data. While they don't provide early signals, they are valuable for traders who prefer to follow established trends. These indicators react at a sufficient speed, providing confirmation of trends but at a slightly delayed pace. Notable lagging indicators include:
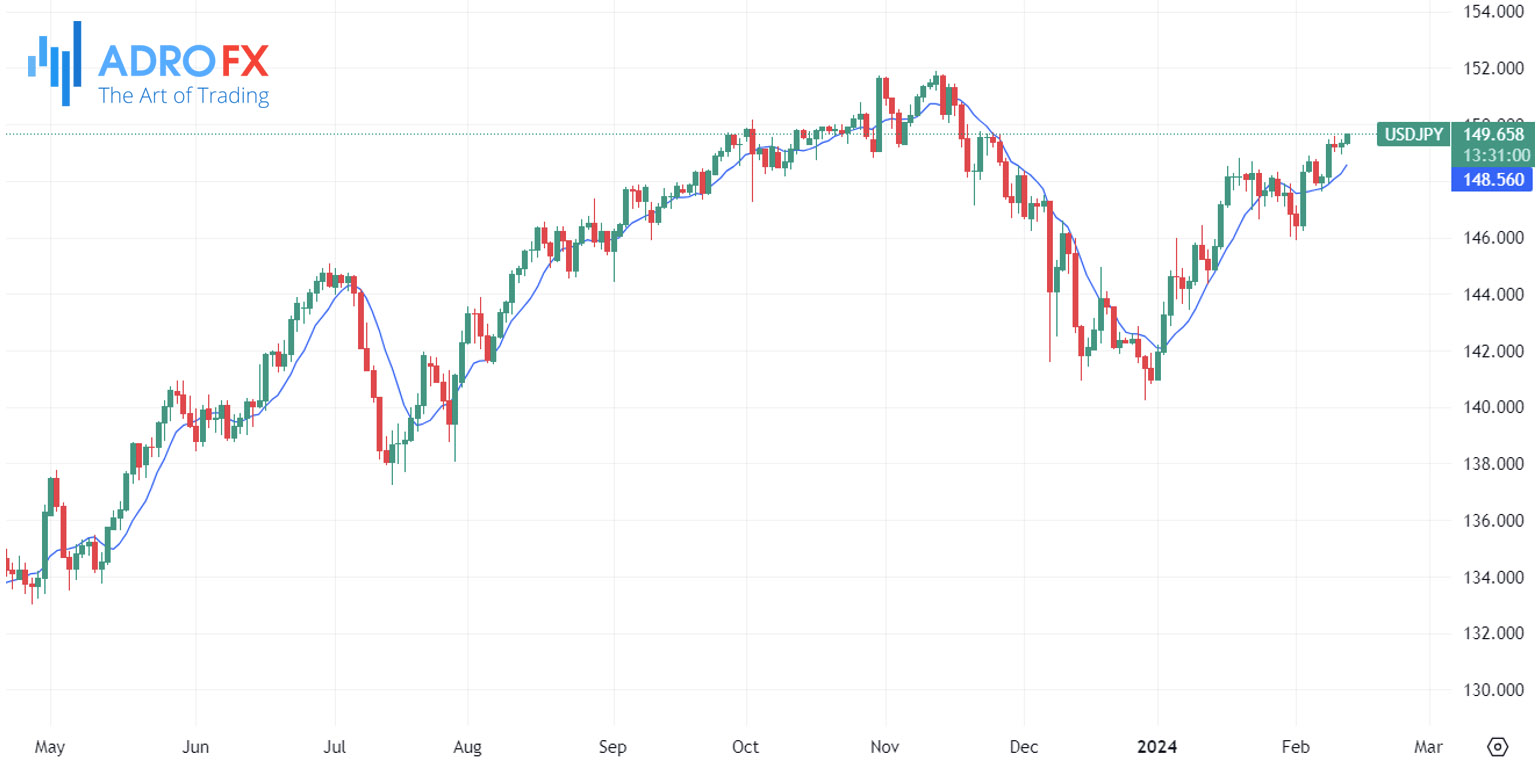
- MAs: Smooth out price data over a specified period, highlighting the average value. Traders use them to confirm the direction of a trend by observing whether the current price is above or below the moving average.
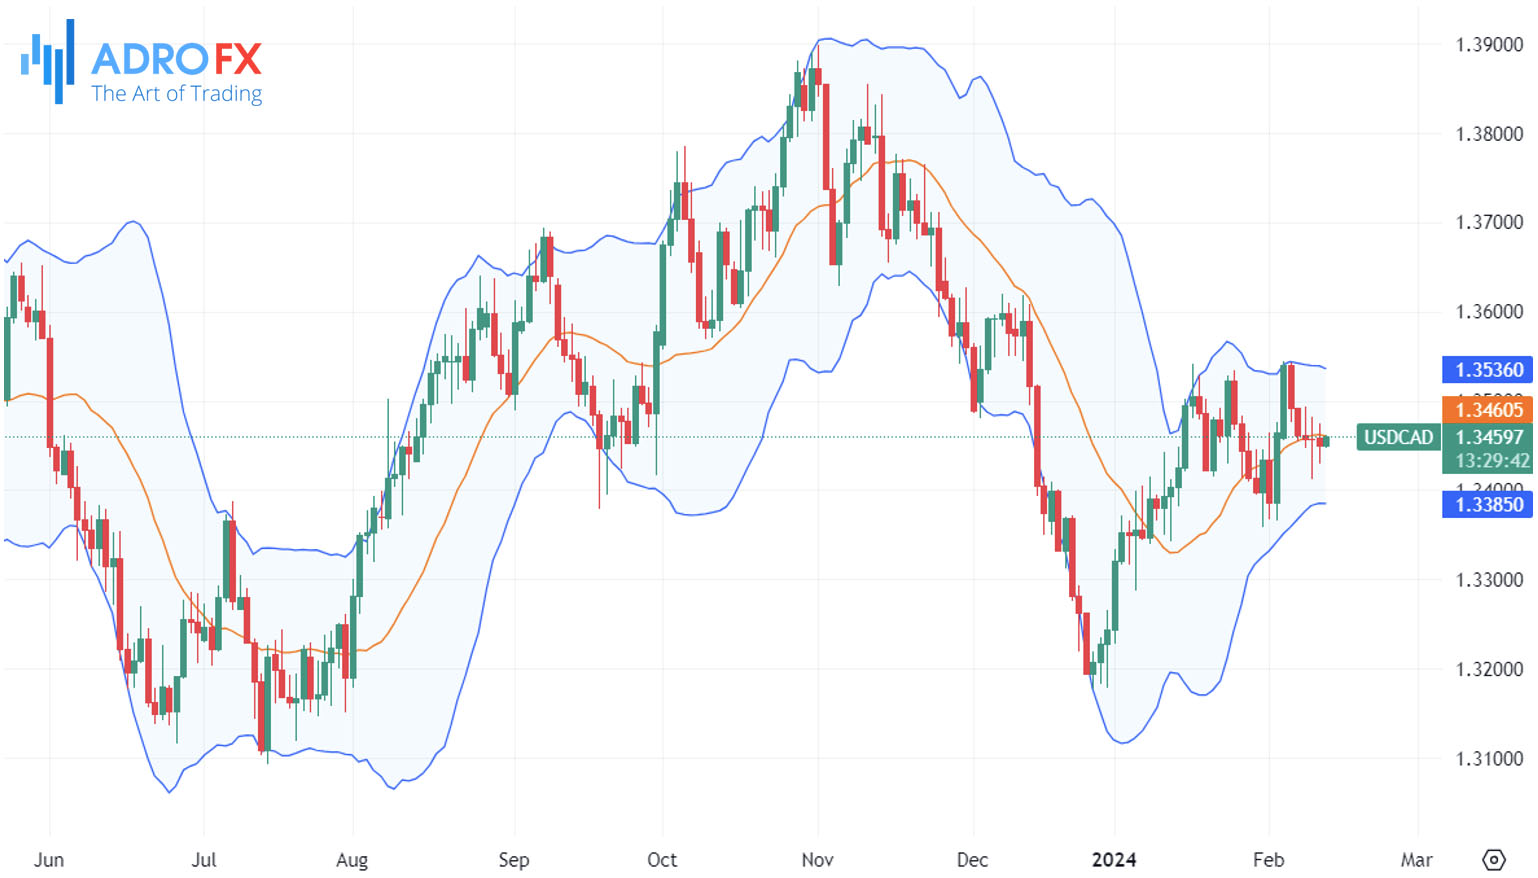
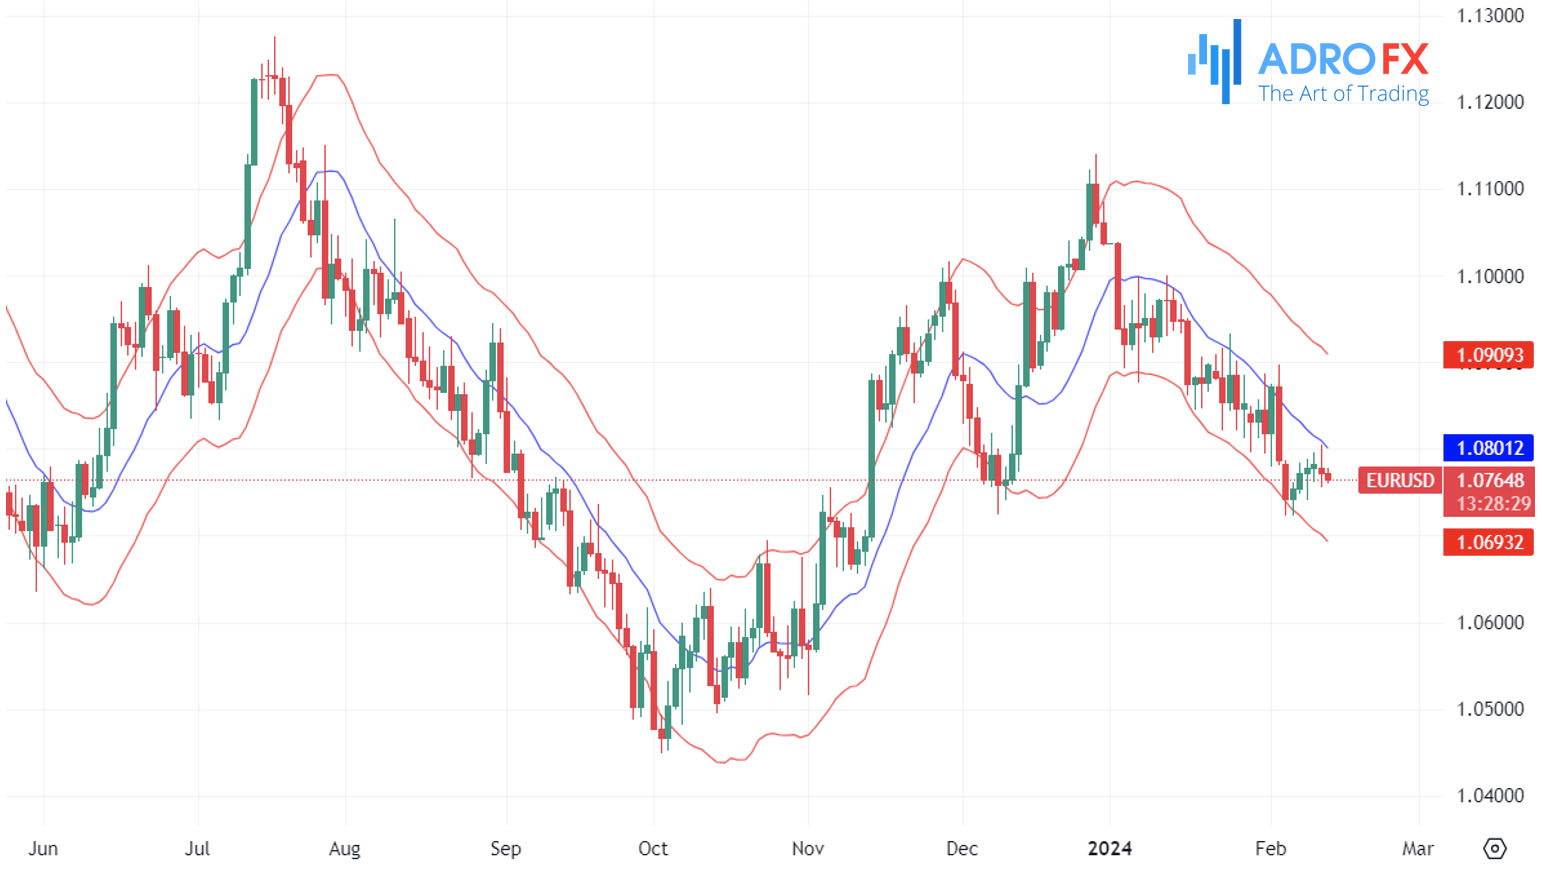
- Bollinger Bands: Consists of a middle band being an MA and two outer bands representing standard deviations. They help traders identify volatility and potential trend reversals by assessing whether prices are near the upper or lower band.
- Moving Average Envelopes: Similar to Bollinger Bands, moving average envelopes create a channel around a moving average. Traders use them to identify potential overbought or oversold conditions.
Lagging indicators are reactive, providing confirmation of trends but at a slightly delayed pace. To enhance the flow between these concepts, let's clarify that lagging indicators confirm trends but may not necessarily predict the duration of a trend.
Using Lagging Technical Indicators to Confirm Trends
Let's delve into a practical scenario to illustrate how lagging indicators function in confirming trends without predicting their duration:
Imagine a stock that has experienced a prolonged upward trend over the past several months. During this time, traders using leading indicators, such as the Relative Strength Index (RSI) and Moving Average Convergence Divergence (MACD), have been receiving signals indicating potential overbought conditions. The RSI consistently shows values above 70, suggesting that the stock might be due for a reversal.
Here's where lagging indicators come into play to confirm the existing trend:
As the stock continues its upward trajectory, a lagging indicator like the 50-day Moving Average (MA) trails behind the actual stock price, providing a smoothed average of its past performance. Traders observe that the stock's current price remains consistently above the 50-day MA. This alignment between the current stock price and the lagging indicator confirms the ongoing bullish trend.
Example of Using Lagging Technical Indicators
Now, let's consider a specific event – an earnings announcement for the company. Despite leading indicators signaling potential overbought conditions, the positive earnings report reinforces the bullish sentiment, causing the stock to surge even higher. The lagging indicators, specifically the 50-day MA, respond to this surge but with a slight delay.
As the stock price rises further, the 50-day MA gradually catches up, confirming the sustained upward trend. Traders using lagging indicators interpret this as a validation of the existing bullish momentum rather than a prediction of how long the trend will continue. In this scenario, the lagging indicator, by aligning with the current stock price, provides traders with retrospective confirmation of the trend's strength. However, it does not predict the duration of the trend or the future stock price movements. Traders, therefore, use lagging indicators as tools to validate their analysis of the prevailing market conditions and make informed decisions based on the confirmed trend.
It's essential to note that lagging indicators while confirming trends, may not predict the duration of a trend. Traders use them to validate existing trends rather than foresee how long those trends will continue.
How to Combine Leading and Lagging Technical Indicators
Combining leading and lagging indicators in trading is a nuanced strategy that demands a deep understanding of market dynamics and a judicious approach to decision-making. By integrating both types of indicators, traders aim to enhance the reliability of signals, gain a comprehensive view of market conditions, and make more informed decisions in the complex world of financial markets.
Leading indicators, such as the Moving Average Convergence Divergence (MACD) and Relative Strength Index (RSI), are crucial for identifying potential turning points in the market. These indicators offer insights into potential shifts in momentum, strength, and direction before they fully materialize. For example, an RSI indicating an overbought condition could suggest an impending reversal, prompting a trader to consider adjusting their position.
However, leading indicators are not foolproof, and false signals are a common occurrence. This is where lagging indicators, including Moving Averages, Bollinger Bands, and Average True Range (ATR), come into play. Lagging indicators confirm trends that have already begun, providing a retrospective analysis of market behavior. When a leading indicator suggests a potential shift, traders can turn to lagging indicators to confirm the validity of the signal. For instance, if the MACD indicates a bullish divergence, confirming this with a Moving Average crossover can strengthen the conviction in the trade.
The key to effectively combining these indicators lies in creating a cohesive and complementary analytical framework. Traders often start by identifying a potential trading opportunity using leading indicators. Once a signal is generated, they turn to lagging indicators to validate and reinforce the decision. This sequential approach helps filter out false signals and provides a more robust foundation for making trading decisions.
Moreover, traders may use lagging indicators to set stop-loss levels and manage risk. The Average True Range (ATR), for instance, can provide insights into market volatility, helping traders determine appropriate levels for stop-loss orders. By integrating risk management with lagging indicators, traders can navigate the uncertainties of the market more effectively.
Additionally, the use of moving averages in conjunction with leading indicators is a common practice. Traders often look for crossovers between short-term and long-term moving averages to confirm the sustainability of a trend identified by a leading indicator. This combination helps traders avoid entering or exiting positions prematurely, providing a more comprehensive understanding of the market's current state.
In summary, combining leading and lagging indicators in trading is about creating a symbiotic relationship between predictive signals and confirmatory tools. Traders need to develop a nuanced understanding of each indicator's strengths and limitations and apply them judiciously in a cohesive strategy. This integrated approach not only enhances the accuracy of trading signals but also provides a more holistic perspective on market conditions, contributing to more informed and successful trading decisions.
What are the Advantages and Disadvantages of Leading and Lagging Technical Indicators?
Leading indicators offer the advantage of providing early signals about potential market shifts. Traders can use these indicators to anticipate changes in price direction, momentum, and strength, gaining a strategic edge in entering or exiting positions. The predictive nature of leading indicators allows traders to identify potential opportunities before they fully materialize, enabling proactive decision-making.
However, a significant disadvantage of leading indicators is their susceptibility to false signals. These tools may generate premature or incorrect indications of a trend reversal, leading traders to make decisions based on incomplete or inaccurate information. Overreliance on leading indicators without proper confirmation can result in poor decision-making and increased risk.
On the other hand, lagging indicators offer the advantage of confirming established trends, providing a retrospective analysis of market behavior. By validating signals from leading indicators, traders can gain confidence in the sustainability of a trend before making significant trading decisions. Lagging indicators, such as moving averages and Bollinger Bands, contribute to a more comprehensive understanding of market conditions.
Despite their confirmation capabilities, lagging indicators have the disadvantage of providing signals after a trend has already begun. This delay can result in missed opportunities for entering trades at the most advantageous points. Traders relying solely on lagging indicators may find themselves reacting to market movements rather than anticipating them, potentially leading to suboptimal outcomes.
Another disadvantage of lagging indicators is their vulnerability to prolonged market consolidations or sideways movements. During such periods, lagging indicators may generate signals that are less reliable or result in a higher frequency of false signals, complicating decision-making for traders.
In conclusion, the advantages and disadvantages of leading and lagging indicators highlight the need for a balanced and integrated approach in trading. Successful traders often combine both types of indicators to leverage the strengths of each and mitigate their respective weaknesses. Striking a careful balance between leading and lagging indicators allows traders to make more informed decisions, reducing the impact of false signals and enhancing the overall effectiveness of their trading strategies.
Conclusion
In the ever-evolving landscape of financial markets, mastering the art of trading requires a delicate dance between leading and lagging indicators. While leading indicators pave the way for early insights, allowing traders to stay ahead of the curve, they carry the caveat of potential false signals. Lagging indicators, on the other hand, offer a retrospective analysis, confirming trends and providing a robust foundation for risk management. Continuous learning and adaptation are paramount in trading, given the dynamic nature of market conditions. Traders need to stay vigilant and be ready to adjust their strategies based on evolving trends.
Maintaining a delicate balance between leading and lagging indicators is essential for navigating the intricate dance of financial markets. Continuous learning and adaptability are the cornerstones of successful trading. The key to success lies in the synthesis of these indicators, creating a symbiotic relationship that enhances the accuracy of signals and fosters a more holistic understanding of market conditions. By embracing both the anticipation of the future and the interpretation of the past, traders can navigate the intricate dance of financial markets with precision and confidence.

About AdroFx
Established in 2018, AdroFx is known for its high technology and its ability to deliver high-quality brokerage services in more than 200 countries around the world. AdroFx makes every effort to keep its customers satisfied and to meet all the trading needs of any trader. With the five types of trading accounts, we have all it takes to fit any traders` needs and styles. The company provides access to 115+ trading instruments, including currencies, metals, stocks, and cryptocurrencies, which make it possible to make the most out of trading on the financial markets. Considering all the above, AdroFx is the perfect variant for anyone who doesn't settle for less than the best.
Related Articles


Latest updates
Latest updates


Technical Analysis
Latest updates


