What the MACD Indicator is and How it Works
Indicators continue to confidently spread their influence on the formation of trading strategies. The modern trader, be he a beginner or a pro, cannot miss the opportunity to rely on the support of automated assistants. MACD fits perfectly into the format of modern trading offering a wide set of important trading signals.
It hasn't lost its appeal despite its venerable age. Traders of different qualifications successfully use it in simple and complex trading strategies, including MACD as a mandatory component of the system.
Today you will learn what is the MACD indicator, what situations are best to use it in, how to configure it, and how to use the MACD to its fullest potential.
What is MACD in Simple Terms
In 1970 Gerald Appel, a successful trader, and analyst had the idea to create a technical analysis tool that would combine the main advantages of oscillators and trend indicators, excluding their disadvantages.
That is how the MACD (Moving Average Convergence/Divergence) indicator was created. It is a technical analysis tool, which evaluates price movements by means of analyzing the smoothed difference of convergence/divergence of two Moving Averages.
MACD in simple words is a result of simultaneous estimation of the market by two different Moving Averages.
MACD indicator description in examples
The logic behind the MACD is that the slow Moving Average shows the long-term market trend and the fast Moving Average shows what is going to happen on the trading floor now or in the near future. If there is a strong difference between the two, we can talk about a strong overbought or oversold condition. Also, Moving Averages may on the contrary approach each other, which indicates the formation of a state of price equilibrium in the market.
In this way, the chart looks like two Moving Averages, the crossing of which gives signals for entry into the market. However, the modern version of MACD is a histogram, one of the Moving Averages was presented not as a line, but as vertical bars originating at the zero line.
That is why MACD is nowadays represented as a line indicator and as a histogram.
The acceleration of the growth rate of the indicator in the positive plane makes it possible to judge the strengthening of a bullish trend because it proves that the fast average is ahead of the slow one when the price is growing fast.
Correspondingly, the distance between them increases, which is reflected in the histogram as an increase in the size of columns.
When the MACD shows a strong downward trend and its dynamics are in the negative zone, one can talk about a bearish trend - the slow Moving Average again fails to keep up with the fast one, but this time it is decreasing in price. When the movement of the indicator becomes smoother, it is an indicator of trend weakening - a decrease in price dynamics allows slow Moving Average to approach the fast one. Their crossover on the chart occurs at the zero point of the histogram.
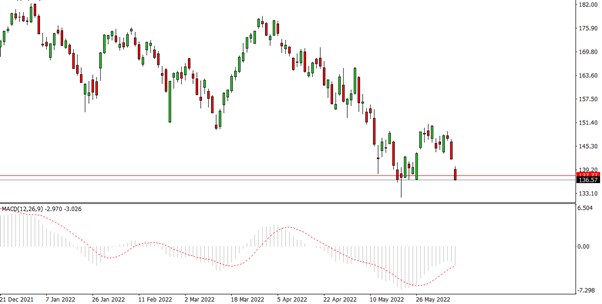
In addition to the histogram, the indicator has two lines in its composition - the first of which is a chart of the indicator itself. To construct it, the shorter Moving Average is subtracted from the longer one. As a rule, in the standard terminal settings, the first is set at 26 days and the second at 12 days, however, this is not a requirement - the MACD is set according to the trader's needs. Many traders prefer to hide the MACD line on the chart so as not to confuse it when trading with the following element.
The second line is called the signal line and is itself a Moving Average of MACD. The classic length of this average is 9, but it is also not an absolute.
Configuring the MACD Indicator
Before you start trading using the indicator, you should pay special attention to the selection of parameters with which this analysis tool will work properly. Setting up the MACD is not particularly difficult. The indicator has 4 main parameters:
- period of a fast Moving Average;
- period of slow Moving Average;
- period of signal Moving Average;
- price value for calculation.
If trading on the falling markets, the MACD standard settings are periods 26 for the slow MA, 12 for the fast MA, and 9 for the signal MA, in this case, the price for calculation is the value of a closed candle.
When trading on the growth of the market, the parameters 26 and 12 are replaced by 17 and 8, respectively. These settings were recommended by the author of the indicator to trade on the stock market. Many traders also successfully use MACD in the futures market and forex without changing the standard parameters.
Selecting a Time Frame
In spite of the fact that MACD can be used at any timeframe, it is most effective at H1 and higher time frames.
The indicator gives signals with a certain lag that can be fully felt on charts with a low time frame. Also in low time frames false signals are possible. Therefore MACD is not suitable for scalping strategies with low time frames.
It is considered that it is better to trade with this indicator in hourly time frames or higher, but many experienced traders assert that it becomes really effective in daily time frames.
In addition, not everyone is aware of the fact that its standard values of 12, 26, and 9 were originally developed for the daily time frame.
How to Use the MACD Indicator and Its Signals
There are several types of signals which can be obtained from MACD. The first one is information about the formation and strength of the trend: the gradual growth of the indicator allows to judge the presence of a trend movement on the market, while the size of the histogram bars shows its strength.
Besides the MACD allows a trader to get information about probable reversal points. The formation of local extremums on the histogram is considered the signal of the reversal formation appearance. However, it should be understood that their appearance does not always signal a reversal of the trend - such signals should be tested.
Also, MACD allows to clearly record the Moving Averages crossovers, which in many strategies is a signal to enter the market. It is shown on the chart as a crossing of a zero coordinate line by a bar. Histogram crossing this line from top to bottom is considered as a signal to sell, and from bottom to top - as a signal to buy.
In addition, MACD crossing of its own Moving Average - the signal line - is often used as a warning signal. For example, if the MACD line crosses a Moving Average from bottom to top and is below zero, this can be regarded as a precursor to crossing the zero line, i.e., a signal to buy.
Another important signal is divergence or convergence. These formations should be considered in more detail.
MACD Divergence and Convergence
Divergence and convergence are some of the most reliable MACD signals. Moreover, MACD divergence and convergence are the most accurate signals of all the oscillators.
In MACD the letter "D" stands for Divergence - the process of divergence (branching) of two EMAs, the basis of the indicator. On the chart, it looks like the removal of the MACD histogram band or edge from the zero line. In this case, the price acquires a new "momentum" in the market, and we can talk about an acceleration of the trend.
The letter abbreviation "C" in MACD stands for Convergence - the convergence of two EMA's, which are the base of the indicator. On the price chart, this process looks like a convergence of the MACD bar or the extremity of the MACD histogram with the zero line.
MACD divergence, as already mentioned, is a powerful signal. If there is a divergence of the EMA indicator on the trading chart, the trader should consider closing a position or opening a counter-trend position, as in the near future there will be a reversal of the price direction.
An exception to the rule may be the appearance of a divergence near the zero line of the indicator, as a rule, in this case, the market is waiting for a slight correction and continuation of the trend movement.
Convergence is not such a strong signal, but its appearance on the MACD extremums indicates the reversal movement.
A popular way to trade is to use the divergence/convergence together with indicators such as RSI, Stochastic, and Alligator as well as support/resistance and Fibonacci Retracement.
How to Install the Indicator on a Chart
The МАСD indicator is included in the basic set of trading platforms and is easily installed on the price chart of the selected financial asset. Indicator data is displayed in the basement window and does not overload the main field, where there is a need for additional graphical drawings.
As an example of MetaTrader terminals, the algorithm of installation looks as follows:
- Open the "Insert" menu;
- Go to "Indicators" - "Oscillators" - MACD;
- Open the window of indicator settings and, if necessary, change the default parameters (this option is relevant for different time frames);
- Press "ok" in the indicator settings window.
How to Configure MACD Correctly
Tuning of MACD parameters is available in the "settings window" and allows selecting the value of EMA periods, to which prices to apply, color scheme, and display areas.
The main role is played by the EMA period settings, which should be in compliance with the chosen trading strategy (short-term, medium-term, long-term).
Changing settings will lead to a change in the behavior of the indicator:
If you increase the length of the EMA periods, the indicator will better cope with false signals, but instead, it will have to "sacrifice" a number of potentially beneficial ones.
If you decrease the EMA periods the MACD will become more sensitive - the number of signals will grow but it will not be as effective at filtering market noise.
Strategies with MACD
Let`s consider the most popular strategies that use the MACD indicator and histogram.
Probably one of the best-known and simplest strategies is the one based on the combination of Stochastic and MACD. To implement the strategy, a trader will need:
- Stochastic oscillator;
- MACD;
- EMA of period 200 (as an additional filter).
- Trading on the system is conducted in the time frame H1 in the direction of the trend that is present at one time interval above, that is, the trend in H4.
To place a buy order the following conditions are necessary:
- MACD (with the standard settings) in the chart H4 is above zero level;
- Stochastic lines (with settings of 3, 5, 11) in the H1 time frame crossed in the oversold area (in a volatile market, set the overbought/oversold levels at 20 and 80, with a calmer price movement - 30 and 70).
- When opening a short position, the conditions should be reversed:
- MACD in the chart H4 should be under zero level;
- The Stochastic lines in the H1 time frame are crossed in the overbought zone.
The MACD - Stochastic strategy aims to limit losses. Stop Loss is set behind the nearest local extremum. Take Profit is not set, the exit from the market is guided by support/resistance levels, or by the opposite signal of the trading system.
At one time, this trading system was popular with many traders and therefore was created based on its trading advisor MACD Stochastic. However, unlike the strategy of the same name, it did not give such stable trading results.
One more quite effective strategy based on MACD is a strategy based on breakout of histogram extremum:
Having broken out the zero level of MACD histogram creates its first point of extremum;
After the formation of the first extremum, a brief pullback follows and it is almost always followed by the formation of the second point of the extremum and the movement continues;
An order is placed immediately after the apparent formation of the first extremum, best of all it is placed behind the candle that formed that extremum;
Limitation of losses is performed by placing a Stop Loss at the level of the zero line;
Exit from the market is carried out through Take Profit, which is set at a distance of 2-3 times the distance of loss limitation.
This strategy is very similar to the scalping trading systems, but the work is done in this case in higher time frames.
Pros and Cons of the MACD Indicator
It is not for nothing that the MACD is one of the most basic and versatile indicators. It is suitable for trading almost all time frames and assets. It is used not only in forex but also in stock, commodities, futures, and even cryptocurrency markets.
In addition, the signals of this oscillator are simple and clear even for a beginner. It gives a bit more information than a Moving Average or a simpler indicator such as Stochastic or RSI.
But this information is still not enough for a full-fledged trade. The MACD is inefficient on its own and gives a lot of false signals. It is necessary to combine this oscillator with other indicators in order to make trading beneficial. Ultimately, the effectiveness of the MACD will depend on the effectiveness of the system it forms in conjunction with other tools.
Tips for Using the MACD Indicator
There are a few nuances of how to use MACD noticed by experienced traders. You should take into account a few tips to improve your trading efficiency:
- Combination of indicators. Even with the most optimal settings, the MACD tends to give a lot of false signals. To filter them, it is better to use other indicators that can confirm such signals.
- Discipline. When working with this tool it is necessary to adhere to the selected strategy and capital management, not to go beyond the predetermined sizes of trades, the ratio of risk/reward, as well as the allowable drawdown.
- Long-term trading. The MACD is not designed to be used in scalper strategies, for this reason, it is better to choose rather higher time frames to work with it.
- The trend. Even the strongest MACD reversal signals do not work well in a strong trend. This should be taken into account, as even multiple divergences in a strong trend can be a false signal more than once.
Observance of these simple recommendations will not guarantee a hundred percent success in trading, but it will increase its probability.
Conclusion
There are two main types of MACD - indicator, and histogram. The principle of their work is the same, as well as the effectiveness. Some problems in working with this algorithm may arise for traders working in the Forex, futures, and commodity markets. However, it should be understood that this means of technical analysis was created primarily for the stock market. Therefore, MACD should be optimized by selecting the most appropriate settings before working on other markets.
Related Articles


Latest updates
Latest updates


Technical Analysis
Latest updates


