Comprehensive Analysis of the KDJ Indicator: Enhancing Forex Trading Strategies
In the fast-paced realm of forex trading, making well-informed decisions is essential for achieving success. A highly effective technique for understanding market dynamics is technical analysis, which leverages historical price data and statistical indicators to predict future price movements. Traders favor this approach because it offers a structured method to examine market trends and uncover potential trading opportunities.
Technical analysis heavily relies on indicators, which assist traders in interpreting market data, spotting patterns, and forecasting future price changes. Utilizing these indicators allows traders to devise strategies based on concrete data rather than mere intuition or subjective judgment. This often results in more consistent and profitable trading outcomes. Among the extensive array of technical indicators, the KDJ Indicator is particularly noteworthy for its distinctive ability to gauge market momentum and detect overbought or oversold conditions.
KDJ Indicator Explained
The KDJ Indicator serves as a momentum oscillator tailored to assist traders in identifying potential shifts in the market. Particularly advantageous in forex trading, it effectively highlights overbought and oversold conditions, empowering traders to make well-informed decisions regarding trade entry and exit points.
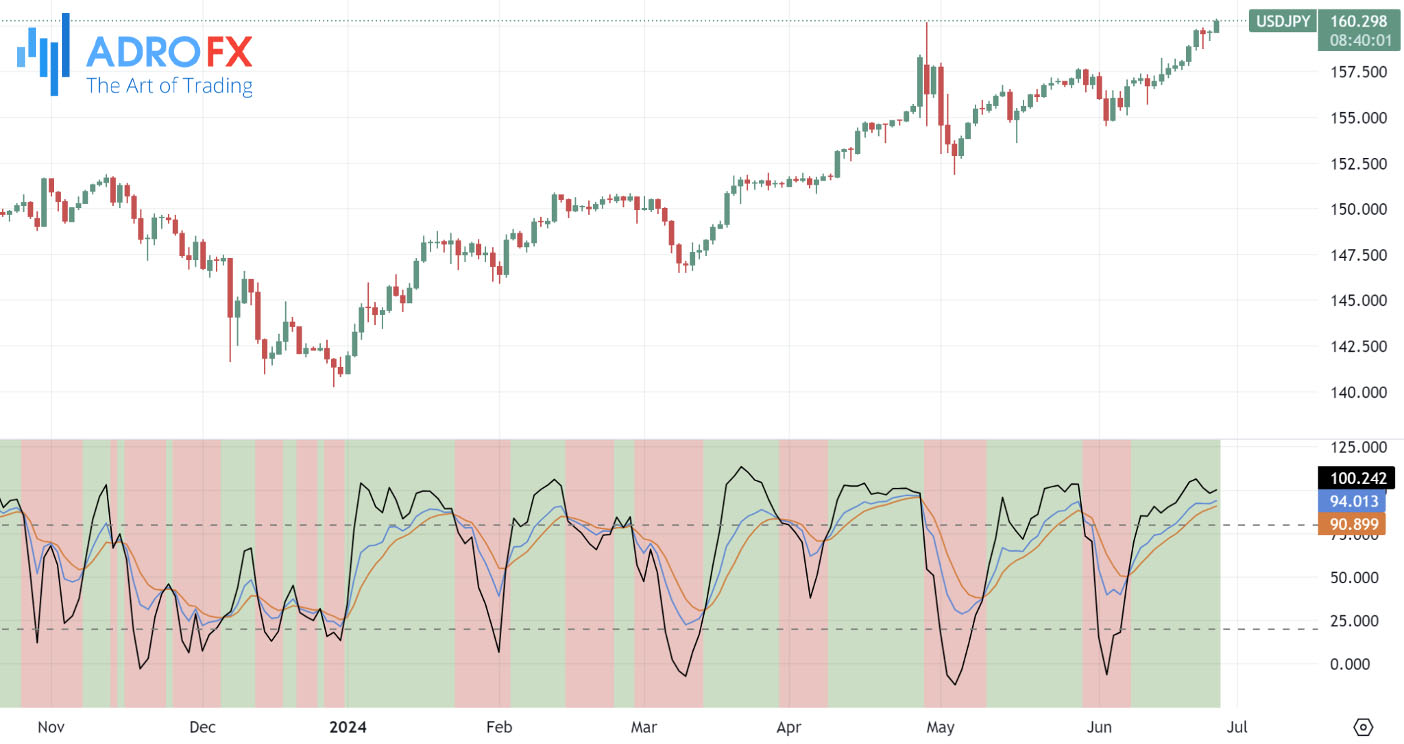
Comprising three distinct lines - the K line, the D line, and the J line - the KDJ Indicator offers nuanced insights into market trends and momentum.
- K Line: Reflecting the current closing price's percentage relative to the price range over a specified period, the K line stands as the quickest and most sensitive of the trio. It promptly responds to price adjustments and typically fluctuates between 0 and 100, akin to the Stochastic Oscillator's %K line.
- D Line: Serving as a signal line, the D line represents a moving average of the K line. It smooths out the K line's fluctuations, reducing volatility and furnishing clearer signals. Traders rely on the D line to discern the overall trend direction and identify potential reversal points.
- J Line: Setting itself apart, the J line showcases the disparity between the K and D lines, often amplifying their signals. Unlike its counterparts, the J line isn't confined to the 0 to 100 range, offering premature indications of extreme overbought or oversold conditions. Its calculation follows the formula J = 3 * K - 2 * D.
By amalgamating these three lines, traders can assess market momentum and pinpoint potential entry and exit points. The KDJ Indicator's adeptness at capturing short-term price movements and signaling trend reversals renders it indispensable for forex traders striving to refine their trading strategies.
History and Heritage
The KDJ Indicator traces its origins back to the Stochastic Oscillator, a renowned momentum indicator created by George Lane in the late 1950s. While the Stochastic Oscillator emphasizes the closing price in relation to the price range over a specific time frame, the KDJ Indicator expands on this concept by incorporating an additional line - the J line. This addition gives traders deeper insights into market momentum and potential trend reversals.
The KDJ Indicator was developed to enhance the Stochastic Oscillator by providing a more responsive and sensitive tool. The J line, in particular, was designed to highlight extreme market conditions and offer early warning signals that might not be as apparent with other indicators. This makes the KDJ Indicator especially valuable in fast-moving and volatile markets like forex trading.
Reading the KDJ Indicator
Interpreting the KDJ lines on a forex trading chart involves understanding several key signals:
Overbought and Oversold Conditions
- When the K line rises above 80, the market is considered overbought, suggesting a potential selling opportunity.
- When the K line falls below 20, the market is considered oversold, suggesting a potential buying opportunity.
Crossover Signals
- A bullish signal occurs when the K line crosses above the D line, indicating that the price may start to rise.
- A bearish signal occurs when the K line crosses below the D line, indicating that the price may start to fall.
J Line Extremes
The J line can move beyond the typical 0 to 100 range. When it exceeds 100, it signals an extreme overbought condition. Conversely, when it drops below 0, it signals an extreme oversold condition. These extremes can serve as early warning signals for potential market reversals.
By understanding these signals, traders can utilize the KDJ Indicator to make more informed decisions about when to enter or exit trades, thereby effectively capitalizing on market movements.
Advantages of Using the KDJ Indicator
The KDJ Indicator provides numerous benefits for forex traders. Primarily, it offers crucial insights into market momentum and trend direction. By examining the interaction between the K, D, and J lines, traders can assess the intensity and duration of price movements, enabling them to identify trends early and anticipate potential reversals.
Another significant advantage of the KDJ Indicator is its capability to highlight overbought and oversold conditions. When the K line exceeds 80, it indicates that the market may be overbought and possibly due for a correction. Conversely, when the K line drops below 20, it signifies oversold conditions, suggesting a potential buying opportunity. This functionality allows traders to enter or exit trades at optimal points, thus maximizing profits and minimizing losses.
Moreover, the KDJ Indicator is user-friendly and suitable for traders at all levels of experience. Its straightforward yet effective design enables traders to swiftly evaluate market dynamics and make informed decisions based on the signals it generates. Additionally, the KDJ Indicator can be tailored to fit various trading styles and time frames, offering flexibility and adaptability in different market environments.
Limitations and Drawbacks
While the KDJ Indicator provides valuable insights into market momentum and trend direction, traders should be aware of its limitations to use it effectively. Here are some potential drawbacks to consider:
- False Signals in Low Volatility Environments
During periods of low volatility or erratic price movements, the KDJ Indicator may produce false signals, leading to suboptimal trading decisions. This issue arises when the indicator fails to accurately reflect changes in market sentiment due to muted price fluctuations. To mitigate this risk, traders might adjust the KDJ Indicator's parameters or use additional technical indicators for signal confirmation. - Lagging Indicator in Fast-Moving Markets
In rapidly changing markets, the KDJ Indicator can lag behind price movements, resulting in delayed signals. This lag diminishes the indicator's effectiveness in capturing timely trading opportunities, especially during volatile conditions. To counter this, traders can pair the KDJ Indicator with faster-moving indicators or rely on price action analysis to verify signals and pinpoint entry or exit points. - Difficulty Adapting to Sudden Market Changes
The KDJ Indicator may struggle to adapt to abrupt changes in market conditions, particularly during periods of high uncertainty or volatility. Consequently, traders might find it challenging to accurately predict market reversals or trend continuations using the KDJ Indicator alone. To address this, traders should use the KDJ Indicator alongside other technical tools and analysis techniques to validate signals and assess the strength of market trends. - Reliance on Historical Price Data
The KDJ Indicator, like many other technical tools, relies on historical price data to generate signals and predictions. While this data can provide valuable insights into market behavior, it's important to remember that past performance does not always predict future results. Traders must be cautious and avoid over-reliance on the KDJ Indicator alone, incorporating fundamental analysis, market sentiment, and geopolitical events into their decision-making process.
By recognizing these limitations and implementing sound risk management strategies, traders can use the KDJ Indicator more effectively within a comprehensive trading framework. Remaining vigilant and continuously assessing market conditions allows traders to adapt their strategies and mitigate risks associated with relying solely on technical indicators.
Integrating KDJ with Other Technical Tools
To bolster the effectiveness of trading signals, traders frequently intertwine the KDJ Indicator with various other technical indicators. One prevalent approach involves pairing KDJ with trend-following tools such as moving averages or trendlines. This strategic amalgamation allows traders to cross-verify KDJ signals with trend indicators, thereby enhancing signal reliability and mitigating the risk of false signals. Moreover, oscillators like the Relative Strength Index (RSI) or the Moving Average Convergence Divergence (MACD) can serve as valuable complements to KDJ, offering supplementary insights into market momentum and divergence. Through a meticulous comparison of signals derived from multiple indicators, traders can cultivate a more holistic perspective on market dynamics and pinpoint high-probability trading setups. For instance, traders might seek out instances of convergence or divergence between KDJ and other oscillators, which could indicate potential trend shifts or continuations. By cross-referencing signals from diverse indicators, traders can validate the robustness of a trend and make well-grounded trading decisions based on a comprehensive analysis of market conditions.
Tips for Beginners
Using the KDJ Indicator effectively requires patience, practice, and a solid grasp of its principles. Here are some practical tips to help beginners navigate its complexities:
- Start with a Demo Account
Practice with the KDJ Indicator in a risk-free environment by trading on a demo account. This helps you get acquainted with the indicator's features and fine-tune your strategy without risking real capital. - Learn to Interpret Signals
Study how the KDJ Indicator generates signals and understand their significance in various market conditions. Learn the importance of overbought and oversold levels and the implications of bullish and bearish crossovers. - Use Multiple Time Frames
Analyze multiple time frames to get a comprehensive view of market trends and price movements. This helps identify potential trading opportunities and confirm signals from the KDJ Indicator. - Combine with Other Indicators
Experiment with integrating KDJ with other technical indicators to improve the accuracy of your signals. Look for complementary indicators that provide additional confirmation and validation of KDJ signals. - Manage Risk Effectively
Implement proper risk management techniques to protect your capital and minimize losses. Set stop Loss orders based on your risk tolerance and avoid overleveraging your positions.
Final Thoughts
In summary, the KDJ Indicator stands as a valuable ally for forex traders endeavoring to decipher trends, assess market momentum, and execute well-informed trading decisions. Through a meticulous examination of the interplay between the K, D, and J lines, traders can glean valuable insights into market dynamics and potential price movements. However, while the KDJ Indicator presents numerous advantages, it also harbors certain limitations that traders must acknowledge. By amalgamating KDJ with other technical indicators, traders can refine the precision of their trading signals and elevate their overall trading prowess. Ultimately, the efficacy of the KDJ Indicator hinges on its integration with other analytical techniques and trading methodologies. With dedication and experience, traders can harness the potential of the KDJ Indicator to navigate the intricacies of the forex market and actualize their trading objectives.

About AdroFx
Established in 2018, AdroFx is known for its high technology and its ability to deliver high-quality brokerage services in more than 200 countries around the world. AdroFx makes every effort to keep its customers satisfied and to meet all the trading needs of any trader. With the five types of trading accounts, we have all it takes to fit any traders` needs and styles. The company provides access to 115+ trading instruments, including currencies, metals, stocks, and cryptocurrencies, which make it possible to make the most out of trading on the financial markets. Considering all the above, AdroFx is the perfect variant for anyone who doesn't settle for less than the best.
Related Articles


Latest updates
Latest updates


Technical Analysis
Latest updates


