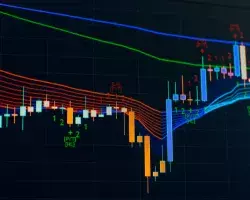
Top Technical Indicators for Day Trading in 2024
Being a day trader means your livelihood depends on executing short-term trades and capitalizing on quick gains. This can prove highly lucrative for seasoned traders but can be a harrowing experience for those lacking experience. Distinguishing experienced day traders from novices lies in their mastery of key trading strategies. Some excel in fundamental trading, while others specialize in technical analysis. A few even possess expertise in both realms.
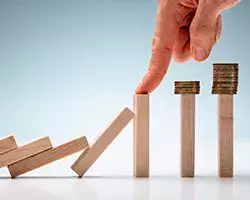
What is a Stop Out Level And How to Avoid It
In a nutshell, a Stop Out is actually a trader's bankruptcy. It occurs when there is not enough capital in the account to maintain open trades, and the broker closes them forcibly. This unfortunate situation is caused not only by losing positions but primarily by inappropriate money management. Today we will analyze why and under what conditions Stop Out occurs, and most importantly, how to avoid this situation.

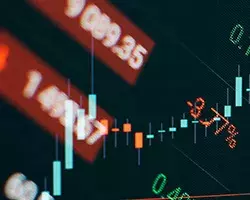
Economic Indicators That Impact The Market | Daily Market Analysis
Every month is full of news that is important to those who follow the financial markets. This is information about various economic indicators. As a rule, it comes from government agencies, industrial organizations, and scientific institutions. Most of this news is released according to a pre-determined schedule. Publicly available information gives an indication of the state of the national economy, such as the unemployment rate, inflation, and consumer spending.
How to Use Murrey Math Levels in Forex Trading
Any trader dreams to see what the crowd can't see, to find that precious tool, which will help to earn where others see only losses. The Murrey levels indicator may not be perfect, but it is very close to it. Beginner traders rarely use Murrey levels due to their perceived complexity (compared to the classic RSI, MACD, and Stochastic). But trading at Murrey levels will dramatically increase the efficiency of almost any trading system.
How to Choose Leverage in Forex Trading
The use of leverage in forex trading can significantly increase the trader's profit, but it also carries a considerable risk of loss. But it is worth remembering that the risk is a controllable and calculable value. This allows the trader to maximize his profits from the used leverage and at the same time to keep the risk at a comfortable level.
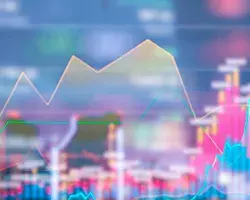
Earnings Season — Meaning, How to Make Its Best Use?
Traditionally, the earning season is a favorite time of year for active traders. This is a time when the potential for making profits increases many times over. The end of each quarter ends with the publication of corporate reports. This is a period of high market volatility, and traders try to make the most of it. As surfers catch a wave, traders try to join the movement, caused by the market's reaction to the publication. It is a very important period for intraday, medium, and long-term traders.
The Ultimate Guide to Cluster Analysis
Cluster analysis is a very useful tool that allows you to find the best points to enter the market, thus increasing the efficiency of the trader. Someone hears about it for the first time, for someone it is familiar but incomprehensible. It can be used to understand how the real picture of the market is presented and what ratio is observed between the buyers and sellers. In this article, we will provide an insight into the cluster analysis, learning in detail what it is and how to apply it competently in trading on the financial markets.
Ichimoku Trading Guide — How To Use The Ichimoku Indicator
Even novice traders, let alone professionals have heard of Ichimoku, but not everyone uses it and not that often, although the indicator is included in many programs for analytical trading. In fact, it is one of the most effective and multifunctional indicators that is meant to determine the price movement, support/resistance levels, and trend zones. So, today we will dive into the Ichimoku indicator: learn how to interpret its readings and apply that information to trading.