Top Technical Indicators for Day Trading in 2024
Being a day trader means your livelihood depends on executing short-term trades and capitalizing on quick gains. This can prove highly lucrative for seasoned traders but can be a harrowing experience for those lacking experience.
Distinguishing experienced day traders from novices lies in their mastery of key trading strategies. Some excel in fundamental trading, while others specialize in technical analysis. A few even possess expertise in both realms.
However, there are various ways to categorize a trader's approach to the market. Will you follow trends, thus exploiting reversals? Will you prioritize trading volume, or perhaps exclusively deal in liquid assets?
In this article, we aim to bring clarity to this conundrum by exploring the most effective technical indicators for day trading.
Qualities of Effective Indicators for Day Trading
While the market teems with technical indicators, not all are well-suited for day trading. Indicators such as accumulation and distribution, Average True Range (ATR), and the McClellan Oscillator are less than ideal for short-term market activities.
So, how do we discern the most suitable indicators for our purpose? Here are some key characteristics of excellent indicators for day trading:
- Swift Reaction Time
A valuable day trading indicator must respond promptly when applied to short-term charts, like those spanning 1 to 5 minutes. Examples of such indicators include Volume Weighted Average Price (VWAP), moving averages, Bollinger Bands, and Relative Strength Index (RSI).
- Data Simplification
A good day trading indicator simplifies complex data, presenting it in an easily understandable manner. For instance, the RSI simplifies the intricate data concerning an asset's rate of change, making it straightforward to understand—values around 70 and 30 denote overbought and oversold conditions, respectively.
- Ease of Interpretation
Perhaps the most critical aspect, a valuable day trading indicator should be readily understandable. For instance, traders using the Volume Weighted Average Price (VWAP) will initiate a buy trade when the price crosses above the VWAP indicator and sell when it crosses below. Similarly, those employing a strategy based on two moving averages execute trades when these moving averages intersect. In contrast, certain technical indicators like the Awesome Oscillator and Accumulation and Distribution can pose challenges in terms of interpretation.
- Harmonious with Other Indicators
Since most traders rely on a combination of two or three indicators, it's vital to choose an indicator that complements others seamlessly. For example, you can pair moving averages with the Relative Strength Index (RSI). In this setup, moving averages depict the prevailing trend, while RSI indicates whether an asset is in an overbought or oversold condition.
- Alignment with Your Strategy
A valuable indicator should align with your specific trading strategy. For instance, if you are inclined toward trend-following, prioritize the use of trend indicators like moving averages and Bollinger Bands. Conversely, if your focus is on identifying reversals, opt for reliable reversal indicators such as the Donchian channels and even consider utilizing Bollinger Bands, which can surprisingly prove effective in this context.
Top Indicators for Day Traders
There exists a vast array of indicators at your disposal, each suited to your unique trading strategy and preferences. Among these, here are 7 popular indicators that traders frequently employ:
The first of these indicators is the MACD, which stands for Moving Average Convergence Divergence. This indicator is a favorite among traders for assessing an asset's price direction. It achieves this by plotting two critical lines: the MACD line and the signal line. The MACD line is calculated by subtracting a longer-term Exponential Moving Average (typically spanning 26 periods) from a shorter-term Simple Moving Average (typically covering 12 periods). On the other hand, the signal line is a moving average of the MACD line, usually spanning nine periods. When these two lines converge, it indicates a potential slowdown in the current trend and a possible reversal. Conversely, when they diverge, it suggests an increase in momentum in the ongoing trend.
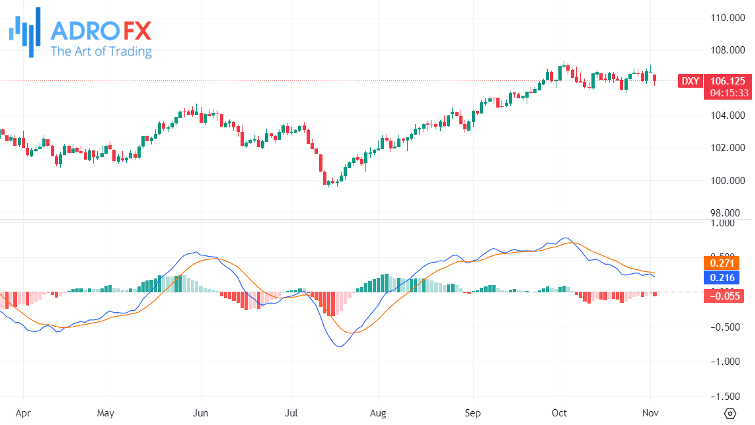
This indicator is highly adaptable for day traders and is especially valuable for confirming conditions that facilitate quick entries and exits. For example, it's often employed in the MACD crossover strategy, generating short-term signals when the MACD line crosses above the signal line, signaling a bullish move, or below, indicating a bearish trend.
The next is the RSI or Relative Strength Index. RSI is a momentum indicator used to assess the speed and magnitude of price movements. Day traders find it particularly useful for identifying overbought or oversold conditions, spotting divergences, validating trends, predicting trend reversals, and understanding an asset's price behavior. The RSI values range from 0 to 100, with readings below 30 signifying an oversold market and readings above 70 indicating an overbought market.
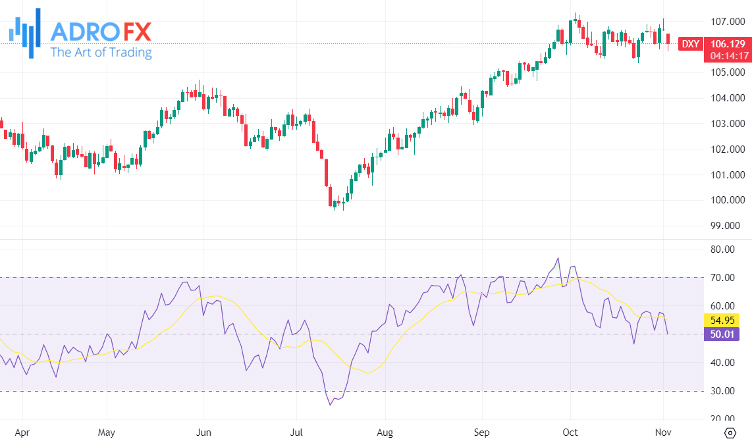
To fine-tune entry and exit points, day traders often lower the RSI period setting, such as within a range of 9-11 periods. This adjustment enhances the indicator's sensitivity and aids traders in identifying potential trade opportunities and tracking market trends effectively.
The third one on our list is the Stochastic Oscillator, another momentum indicator with a unique approach. It compares an asset's closing price to its price range over a specified period, helping traders generate signals, identify potential trade opportunities, and forecast entry and exit points. The readings produced by the Stochastic Oscillator are straightforward: values exceeding 80 indicate an overbought market, while readings below 20 suggest oversold conditions.
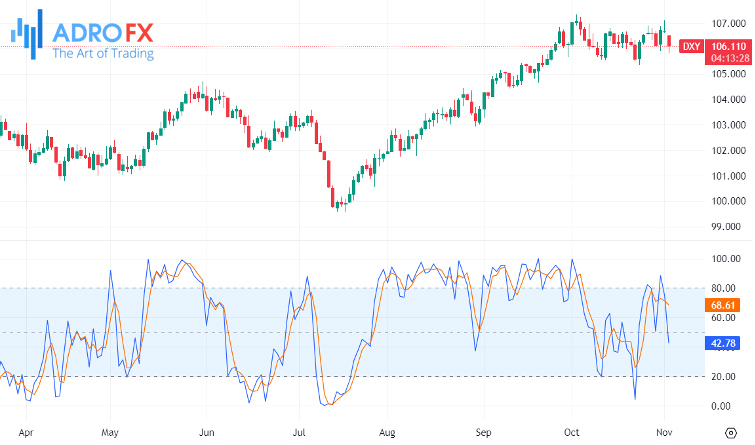
This indicator comprises two lines, %K and %D, typically displayed on a sub-chart below the price chart. %K compares the daily close to the price range over a specific period, while %D represents the 3-period average of %K. To align this indicator with their specific day trading strategies, traders often customize the settings, such as setting a %K length of 14 and a %K smoothing of 1, resulting in more frequent signals for quicker decision-making.
Bollinger Bands are yet another valuable tool in the day trader's arsenal. These bands, a type of momentum indicator, create a visual representation of market volatility. They consist of three lines: a middle band, which represents an asset's average price over a specific period, and two outer bands that depict deviations from this average. The upper band is positioned above the middle band and is calculated by adding two standard deviations to the average, while the lower band is below and calculated by subtracting two standard deviations. These bands expand during volatile periods and contract during periods of low volatility, often moving in sync.
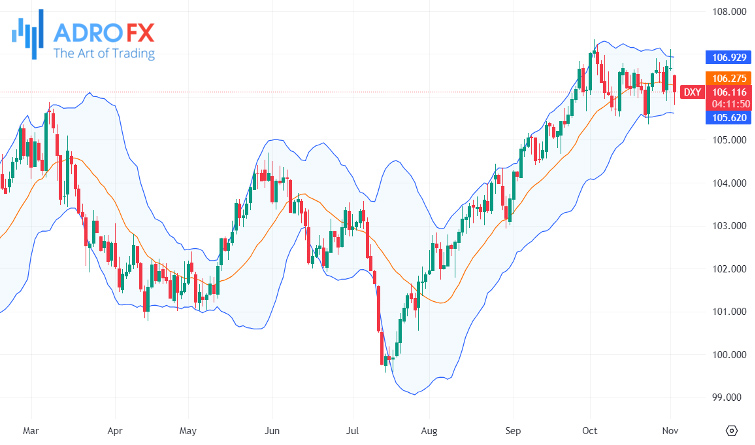
Day traders favor Bollinger Bands due to the multitude of signals they provide and their ability to highlight price patterns. To get the best results for day trading, traders should adjust the indicator's settings to shorter timeframes, ensuring they have enough data to gain a clear understanding of market prices. Bollinger Bands are most effective when used alongside other indicators, providing valuable insights for making informed decisions about price volatility.
Moving on, let's explore the On-Balance Volume (OBV) indicator. This momentum indicator quantifies the pressure of buying and selling in the market by using volume flow to predict price changes. Instead of focusing on specific quantitative values, OBV looks at the pattern of volume movements over time. When both the price and OBV register higher highs and higher lows, it indicates a likely continuation of an upward trend, and vice versa.
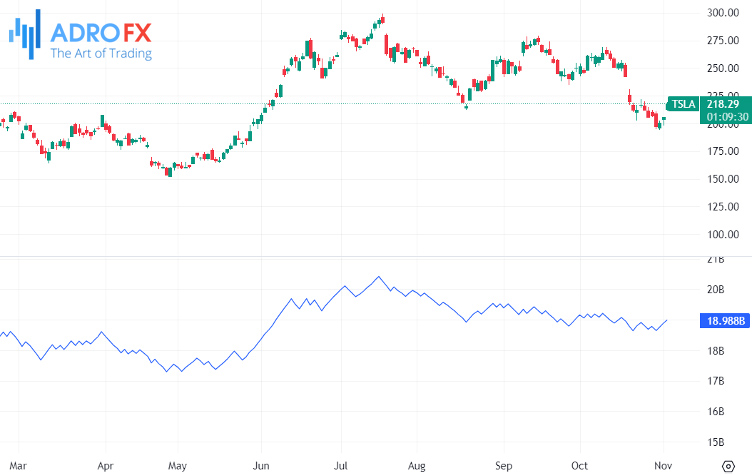
For day trading, it's crucial to fine-tune the indicator's settings to very short timeframes, enabling traders to monitor volume closely or the behavior of a specific asset. For instance, a decreasing OBV during an hourly trading range can serve as a warning of a potential downward breakout.
Our journey through these indicators continues with the Average Directional Index (ADX). ADX helps traders evaluate the strength of a trend and is displayed as an oscillator beneath trading charts. It ranges from 0 to 100, with values above 25 signaling a strong trend and values at or below 25 suggesting a weak trend or no trend at all.
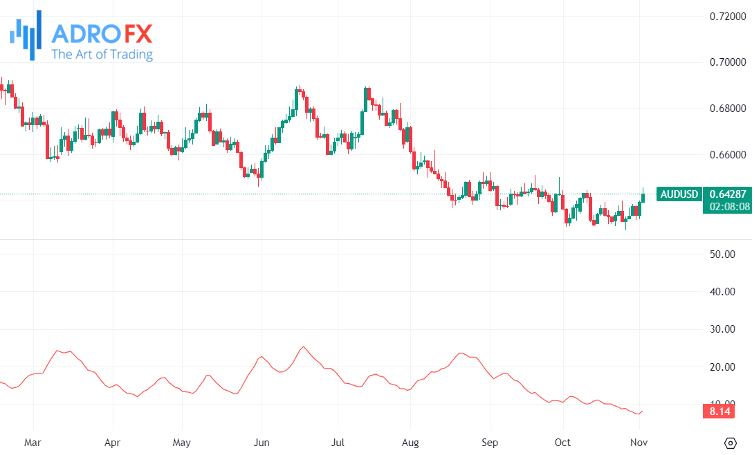
Day traders use the ADX indicator to enhance sensitivity to rapid price fluctuations, providing a deeper analysis of short-term trades. It's often integrated into short-term charts to complement and confirm the emergence of new trends detected by other indicators.
Last but not least is the Parabolic Stop and Reverse (PSAR) indicator. This straightforward tool generates dots on a chart, and their placement offers trading signals. Dots above the current price indicate a declining price, while dots below the price bar signal a rising price. Potential reversals are indicated when the dots cross over the price. A transition from above to below the price might trigger a buying signal, whereas dots moving from below to above could prompt a selling decision.
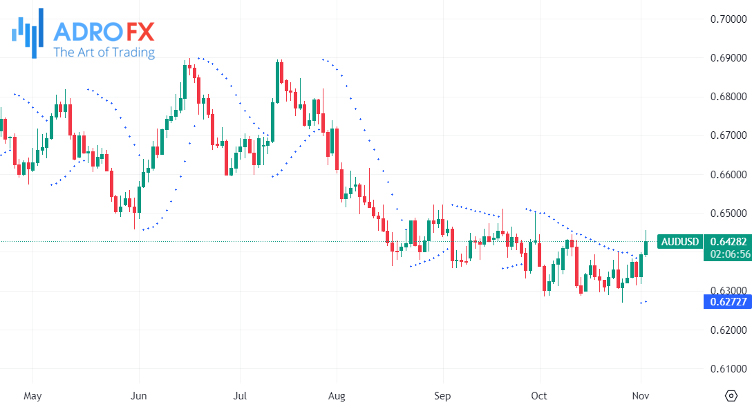
PSAR is a favorite for setting trailing Stop Losses and is well-suited for short-term day trading strategies. Traders can adjust the indicator to shorter timeframes, including hourly, minute intervals, or even seconds, thanks to its simplicity and ease of use on trading charts.
These technical indicators play a crucial role in helping traders make sense of the complex and ever-changing world of financial markets. Whether it's confirming trends, identifying entry and exit points, or understanding the dynamics of price movements, these indicators are indispensable tools for those navigating the high-speed world of day trading.
Conclusion
Day trading is a high-stakes game, where success hinges on quick decisions and effective tools. Seasoned traders stand out with their mastery of trading strategies, whether focused on fundamentals or technical analysis. In this article, we explore the essential technical indicators for day trading.
Effective indicators for day trading share some key qualities. They must react quickly on short-term charts, simplify complex data, be easy to understand, work well with other indicators, and align with your trading strategy.
The indicators mentioned above are valuable tools for traders, offering insights into the dynamic world of day trading. However, remember that no indicator is foolproof, and they work best when combined with other analysis methods and risk management strategies. Success in day trading comes from continuous learning, practice, and a deep understanding of your tools. In the fast-paced world of day trading, preparation, discipline, and a sharp focus on indicators can be the key to success.

About AdroFx
Established in 2018, AdroFx is known for its high technology and its ability to deliver high-quality brokerage services in more than 200 countries around the world. AdroFx makes every effort to keep its customers satisfied and to meet all the trading needs of any trader. With the five types of trading accounts, we have all it takes to fit any traders` needs and styles. The company provides access to 115+ trading instruments, including currencies, metals, stocks, and cryptocurrencies, which make it possible to make the most out of trading on the financial markets. Considering all the above, AdroFx is the perfect variant for anyone who doesn't settle for less than the best.
Related Articles


Latest updates
Latest updates


Technical Analysis
Latest updates


