US Stocks Slide Amid Economic Resilience and Tech Earnings Concerns | Daily Market Analysis

Key events:
- USA - Core PCE Price Index (MoM) (Sep)
- USA - Core PCE Price Index (YoY) (Sep)
- Eurozone - EU Leaders Summit
US stocks experienced a significant decline on Thursday, primarily driven by a drop in tech and tech-related large-cap stocks. This downturn was in response to a mix of quarterly earnings reports and indications of economic resilience, which could potentially lead the Federal Reserve to maintain higher interest rates for a longer duration than initially anticipated.
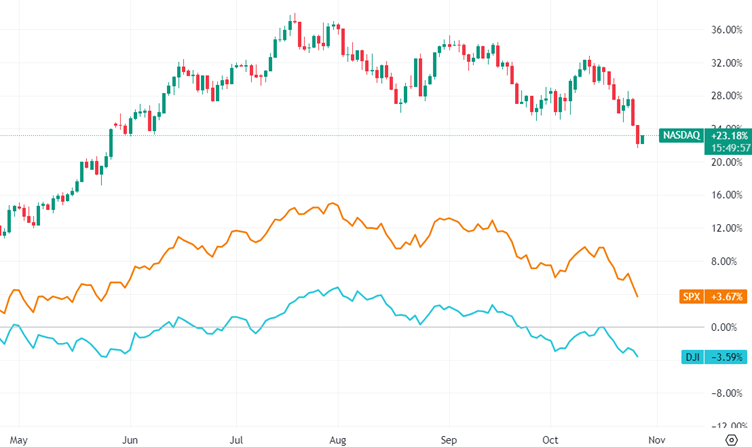
All three major US stock indices closed in negative territory, and they are all poised for weekly losses. Specifically, the Dow Jones Industrial Average fell by 251.63 points or 0.76%, the S&P 500 lost 49.54 points or 1.18%, and the Nasdaq Composite dropped 225.62 points or 1.76%.
The third quarter earnings season is in full swing and is approaching its halfway point, with nearly one-third of the companies listed in the S&P 500 expected to report their results during this week.
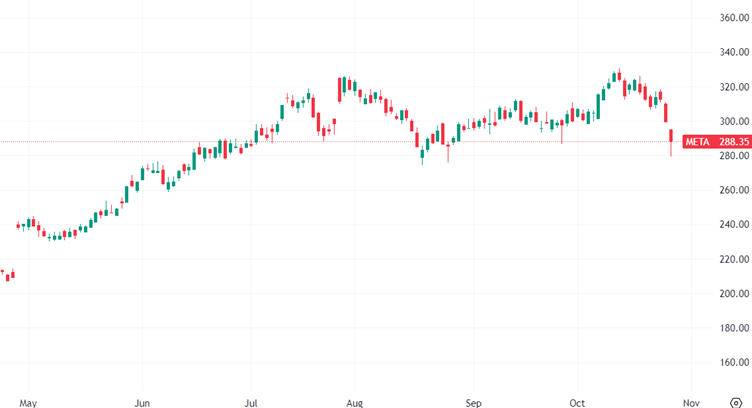
Meta Platforms (NASDAQ: META) saw a decline of more than 3% after noting weaker advertising demand in the fourth quarter. Despite reporting Q3 results that exceeded analyst estimates on both revenue and profit due to cost-cutting measures, concerns about slowing growth weighed on the stock. The company attributed some of the weakness to the impact of the Israel-Hamas conflict on ad spending in the Middle East.
Meanwhile, Treasury yields decreased as data indicated that inflation had moderated more than anticipated in the third quarter, overshadowing preliminary data that showed the US economy experienced its most rapid quarterly growth since 2021.
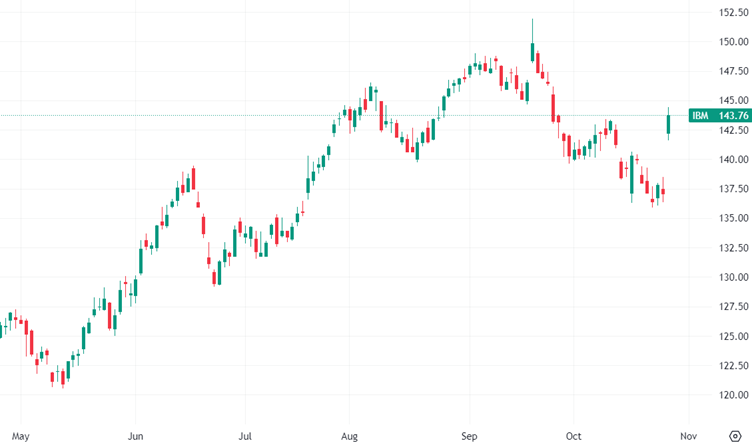
At the same time, IBM (NYSE: IBM) saw a notable 4.9% increase following a quarterly report that exceeded consensus expectations, driven by robust demand for its software solutions.
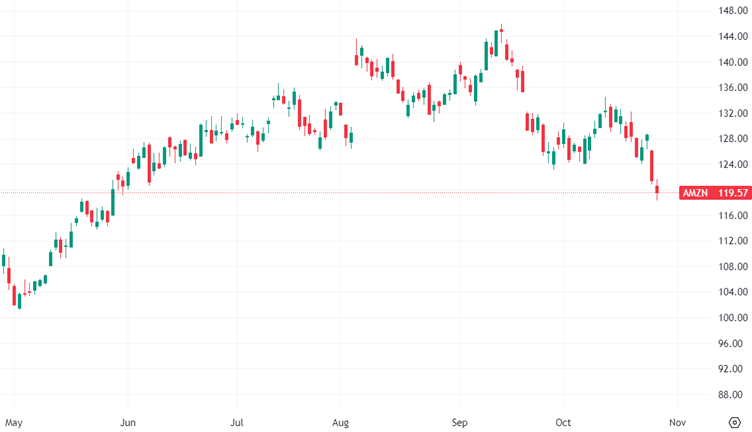
Today, the spotlight shifts to Amazon and its cloud business following Alphabet's slight miss earlier in the week, which resulted in their shares posting their most significant one-day decline since March 2020. Amazon had previously raised its Q3 revenue guidance to a range of $138 billion to $143 billion after reporting in Q2, setting high expectations for today's performance. Investors will be closely monitoring revenue growth in both online stores and Amazon Web Services (AWS), with expectations of AWS revenues increasing to $23.2 billion.
The drop in US Treasury yields was due to the market's emphasis on a slight miss in the core PCE inflation data, while it largely disregarded the better-than-expected Q3 GDP figures and accompanying details.
Looking ahead, there is an expectation that the core price consumer expenditure index data, to be released on Friday, will reveal a slowdown in inflation over the 12 months through September, from 3.9% in the prior month to 3.7%.
Market analysts anticipate that the Federal Reserve will acknowledge the recent strength in economic activity but, given the tightening financial conditions, may revise its guidance regarding the necessity for additional tightening. This is in line with the tone set by Chair Powell in a recent speech. Morgan Stanley, for instance, is forecasting that the Fed will maintain an "extended hold" on interest rates through 2024.
The combination of the prospect of prolonged higher interest rates and earnings downgrades seems to be weighing on equity markets on both sides of the Atlantic. European markets, in particular, are experiencing another negative session, with the DAX retreating to the week's lows. German automakers, notably Mercedes-Benz, are leading the decline following a disappointing set of Q3 results.
The euro has slipped back in the wake of the European Central Bank's (ECB) decision to maintain interest rates as expected. ECB President Christine Lagarde noted that risks to growth were skewed to the downside but also pointed out that inflation remained too high. While the ECB did not provide a clear commitment regarding further rate hikes, considering the economic conditions, rate cuts could likely commence as early as the middle of next year.
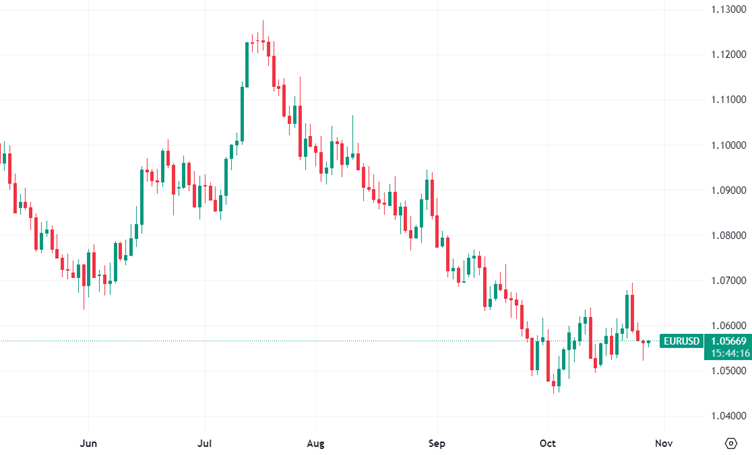
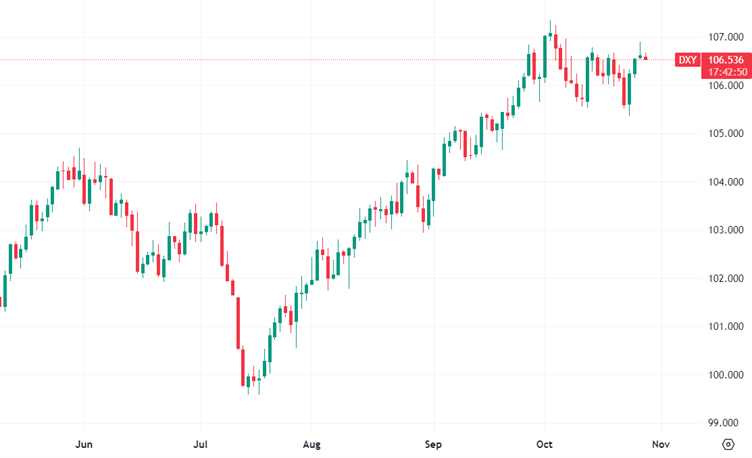
The US dollar received a boost after the release of US Q3 GDP figures, which surpassed expectations at 4.9%, marking the most significant gain since 2021. Personal consumption played a substantial role, contributing 4% to this robust number. Furthermore, core PCE prices for Q3 decreased to 2.4%, creating a favorable scenario that might make the Federal Reserve reconsider its position when it convenes next week.
The Japanese yen continues to weaken against the US dollar, reaching its lowest levels this year. This trend has put the market on alert for potential intervention by the Bank of Japan, which is also scheduled to meet next week for its latest rate decision.
Related Articles


Latest updates
Latest updates


Technical Analysis
Latest updates


