US Stocks Drop Amidst Rally Halt, Alphabet Gains, and Currency Shifts Reflect Global Economic Trends | Daily Market Analysis

Key events:
- USA - GDP (QoQ) (Q3)
- USA - Initial Jobless Claims
- USA - Philadelphia Fed Manufacturing Index (Dec)
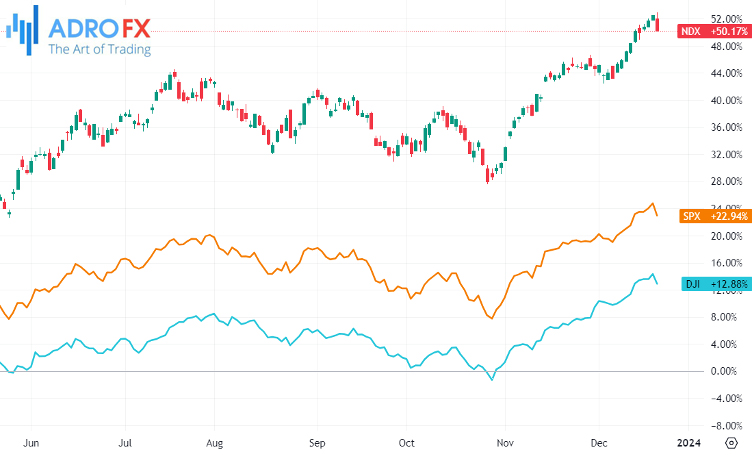
On Wednesday, US stocks experienced a decline as an abrupt mid-afternoon downturn put an end to Wall Street's impressive rally. This rally had been fueled by decreasing interest rates and a more dovish stance from the Federal Reserve. All three major US stock indices ultimately closed 1.3% to 1.5% lower than the previous day's closing.
The Dow Jones Industrial Average dropped by 475 points (1.3%), the S&P 500 fell by 1.58%, and the NASDAQ Composite saw a 1.5% decrease. Investors chose to capitalize on the market's recent gains, which had propelled the Dow to record highs and brought the S&P 500 close to its all-time peak. This resulted in the most extensive market selloff since March.
Earlier in the day, stocks had shown positive momentum, driven by indications of consumer strength and increased activity in the housing market. The Conference Board's confidence index surged to 110.7, the highest level since July 2023 and the second-highest in the past two years. Jefferies noted that this boost was due to "labor market optimism as well as some additional relief on inflation."
Unexpectedly, US existing home sales rose in November, reaching a six-month high with a seasonally adjusted annual rate of 1.56 million units - higher than economists' expectations of a 0.6% increase to 5.44 million homes. Simultaneously, 30-year mortgage rates fell to their lowest level since June.
However, investors took a step back from the prolonged rally as they absorbed disappointing news from FedEx (NYSE: FDX), often considered a barometer for the US economy. FedEx's stock plummeted by 12% as the company revised its full-year revenue guidance downward and reported weaker-than-anticipated quarterly profit. The company warned of headwinds in customer demand due to "volatile macroeconomic conditions" for the remainder of its fiscal year, ending on May 31.
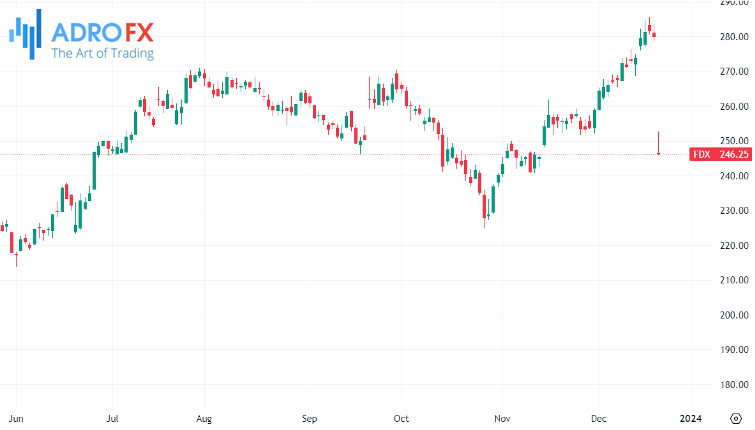
This outlook suggested potential weakness in the typically robust holiday spending activity in the US as consumers grapple with high inflation and elevated interest rates.
Alphabet Inc Class A (NASDAQ: GOOGL) concluded the day with a 1% gain, albeit significantly below its session highs. Reports suggest that the tech giant is contemplating a restructuring of its ad sales business, with an emphasis on increasing automation, including the integration of machine learning.
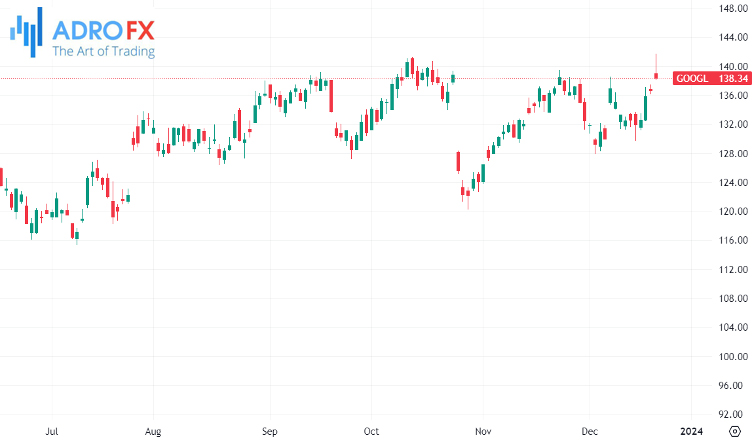
Meanwhile, Apple Inc (NASDAQ: AAPL), Meta Platforms Inc (NASDAQ: META), and Microsoft Corporation (NASDAQ: MSFT) relinquished their gains amid a broader market selloff, closing below the flatline.
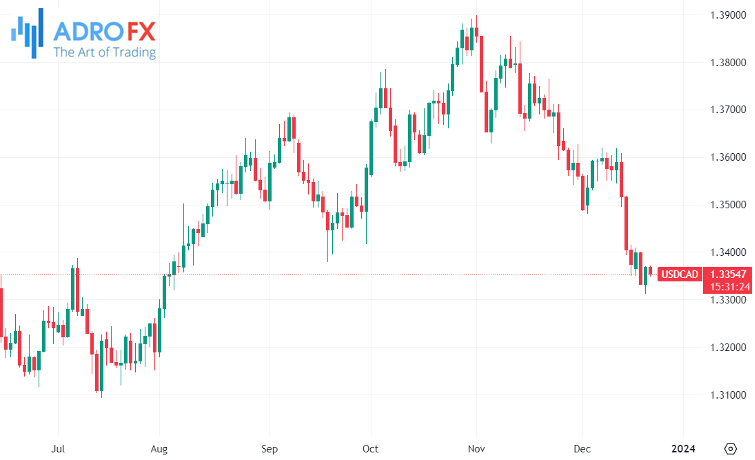
The Bank of Canada recently unveiled the Summary of Deliberations from its December 6 meeting, maintaining a "dovish" stance. According to the document, the Governing Council concurred that the probability of monetary policy being overly restrictive had risen.
Meeting minutes revealed the Council's recognition that monetary policy alone couldn't rectify the structural supply shortage in the housing sector. Concerns were voiced about the possibility of persistent shelter inflation, posing challenges to achieving the 2% inflation target.
Post-release, the Canadian Dollar weakened, with USD/CAD trading at its lowest level since early August, slightly above 1.3300.
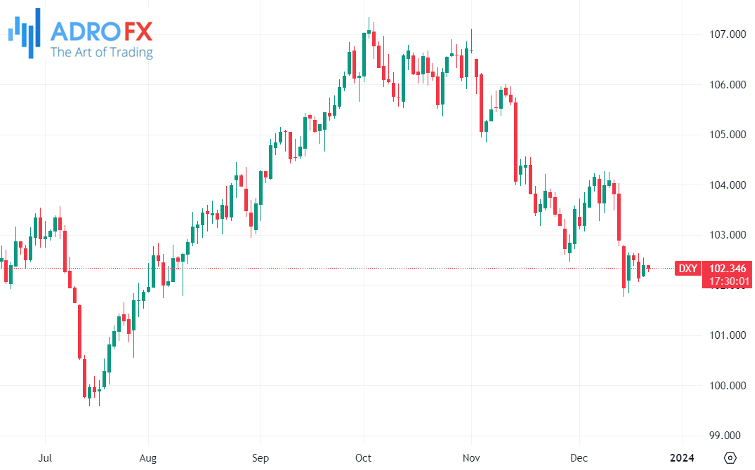
On Wednesday, the US Dollar exhibited mixed trading amid geopolitical risks and inflationary pressures resulting from recent attacks in the Red Sea rerouting vessels. Concurrently, oil prices surged, and OPEC+ enjoyed a favorable market. The US Dollar Index hovered just above 102.00, poised for potential movement later in the week, driven by key US data.
Examining the daily chart, the US Dollar Index appears to be consolidating, indicating a convergence of buyers and sellers with lower highs and higher lows. Once the tipping point is reached, a breakout is expected, aligning with the upcoming publication of US GDP numbers on Thursday and the PCE inflation on Friday.
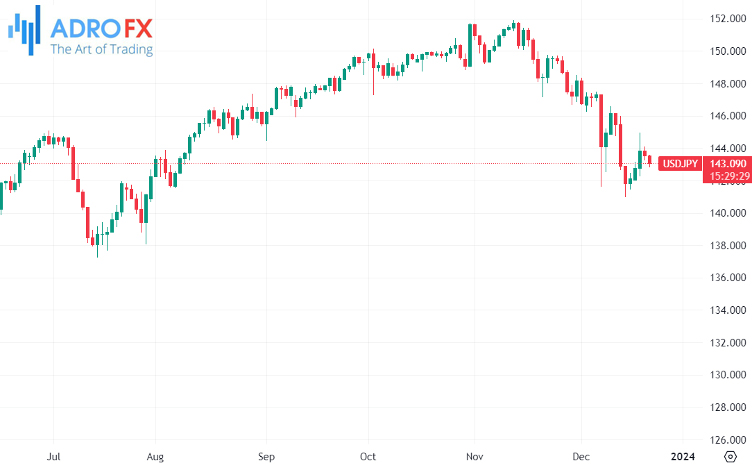
The Japanese Yen continued its upward trend against the US Dollar for the second consecutive day on Thursday, maintaining its intraday gains as the European session approached. The JPY's strength was driven by a slight deterioration in global risk sentiment, evidenced by a late sell-off in US equity markets on Wednesday. Additionally, an upward revision of Japan's economic estimates by the government contributed to the appeal of the safe-haven JPY. These factors, coupled with a modest decline in the US Dollar (USD), led to the USD/JPY pair slipping below the 143.00 level.
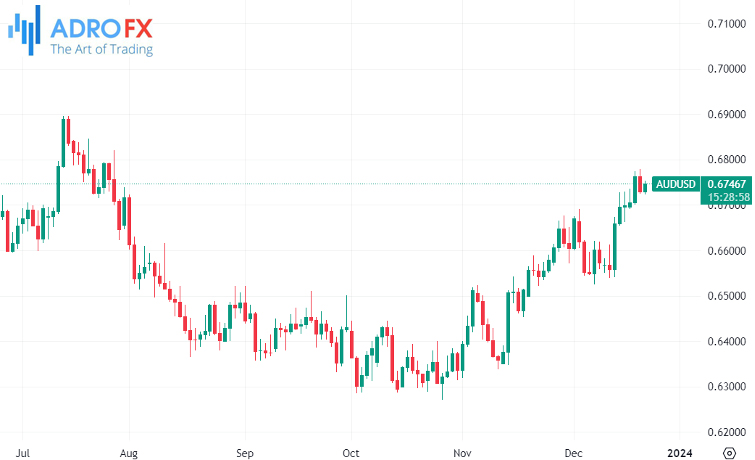
On the other hand, the Australian Dollar retraced its recent losses on Thursday after pulling back from a five-month high at 0.6779. In the previous session, the US Dollar gained ground against the Aussie Dollar following improved economic data from the United States. Consequently, the AUD/USD pair concluded its five-day winning streak.
Economically, leading up to Thursday's US Gross Domestic Product (GDP) data and Friday's Personal Consumption Expenditures (PCE) Price Index, there are few top-tier numbers. US Existing Home Sales defied expectations with an upside surprise, contradicting the earlier decline in Building Permits, suggesting that current rate levels are exacerbating challenges in the housing market.
Related Articles


Latest updates
Latest updates


Technical Analysis
Latest updates


