US Stock Indices Slide Over 1% Amid Nasdaq's Notable Drop, Ahead of Powell's Speech | Daily Market Analysis

Key events:
- USA - Fed Chair Powell Speaks
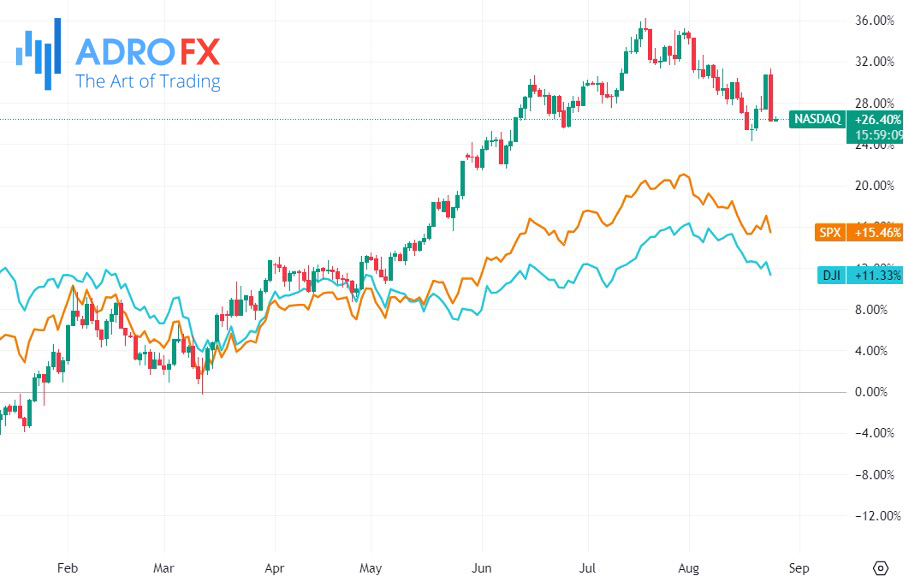
On Thursday, all three major US stock indices concluded with declines exceeding 1% each. The Nasdaq experienced the most significant drop due to recent substantial gains, while investor apprehension loomed ahead of Federal Reserve Chair Jerome Powell's scheduled speech on Friday.
Nvidia's shares (NASDAQ: NVDA) barely maintained a higher position by the session's end, having reached a record peak earlier in the day. In a surprising move, the company announced a robust forecast late Wednesday, buoyed by the demand for its artificial intelligence chips. Moreover, Nvidia revealed plans for a substantial $25 billion stock buyback.
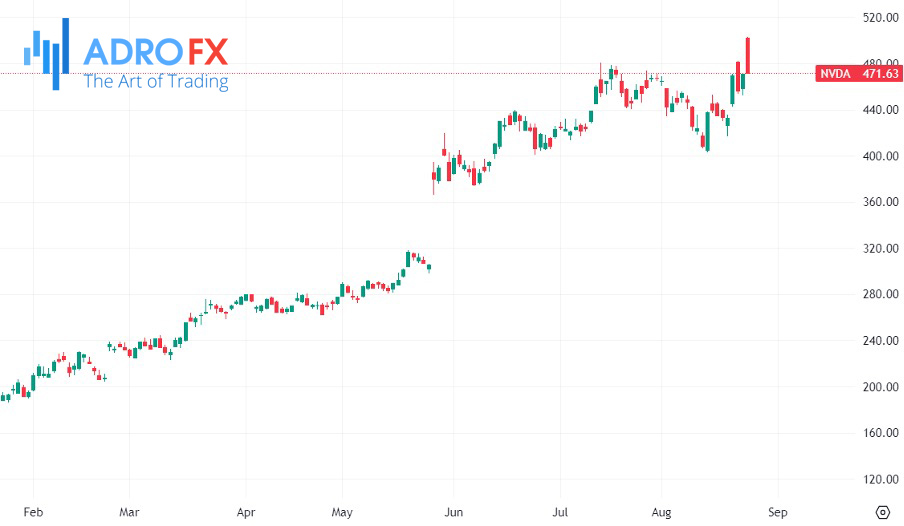
Despite this, every major sector within the S&P 500 registered losses on the day, with semiconductor stocks showing a substantial decline of 3.4%.
At the annual symposium in Jackson Hole, Wyoming, central bankers and other economic leaders convened on Thursday. The eagerly awaited speech by Powell regarding the economic outlook is scheduled for Friday.
Throughout the week, the market had rallied alongside Nvidia, anticipating that the company's forecast might further extend the ongoing tech stock rally focused on artificial intelligence this year.
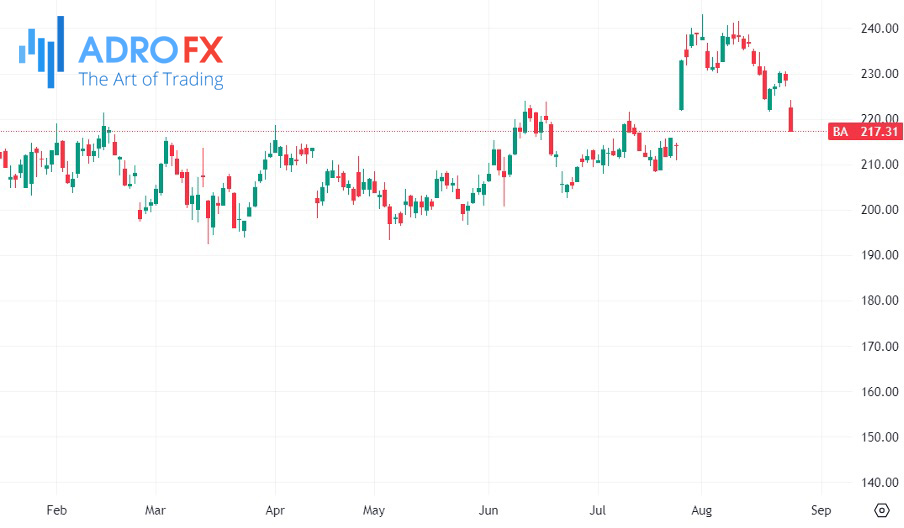
Boeing (NYSE: BA), a significant constituent of the Dow, experienced a decline exceeding 4% following its announcement of a delay in 737 Max deliveries due to new manufacturing challenges.
The Dow Jones Industrial Average plummeted by 373.56 points, equivalent to a 1.08% drop, closing at 34,099.42. Similarly, the S&P 500 recorded a loss of 59.7 points, a decline of 1.35%, ending at 4,376.31. The Nasdaq Composite took the hardest hit, dropping by 257.06 points, or 1.87%, and concluding at 13,463.97.
Earlier on Thursday, data indicated that claims for US unemployment benefits suggested a persistently robust job market. This news could reinforce the Federal Reserve's hawkish stance on maintaining higher interest rates for an extended period. Consequently, Treasury yields inched higher.
Furthermore, investors absorbed remarks from Philadelphia Fed President Patrick Harker, who, during a CNBC interview on Thursday, emphasized the necessity for the Fed to sustain restrictive rates for a considerable duration.
In its efforts to curb inflation, the Fed has been steadily raising rates since March 2022. Investors are seeking clarity on the potential for additional rate hikes and the Fed's intentions regarding the duration of elevated interest rates.
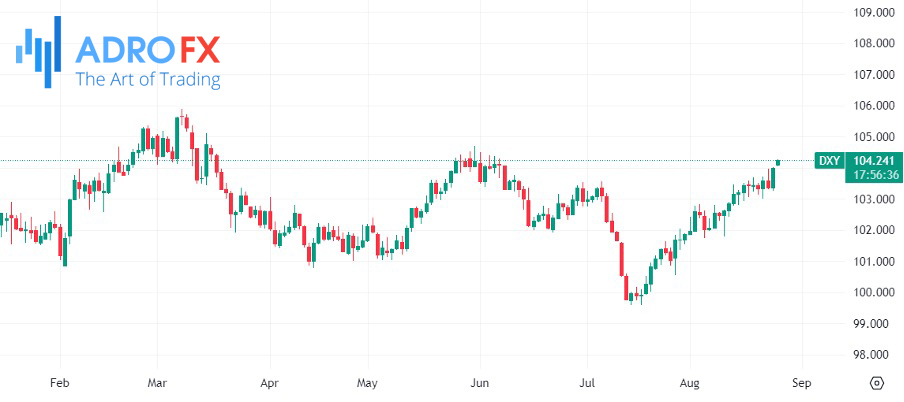
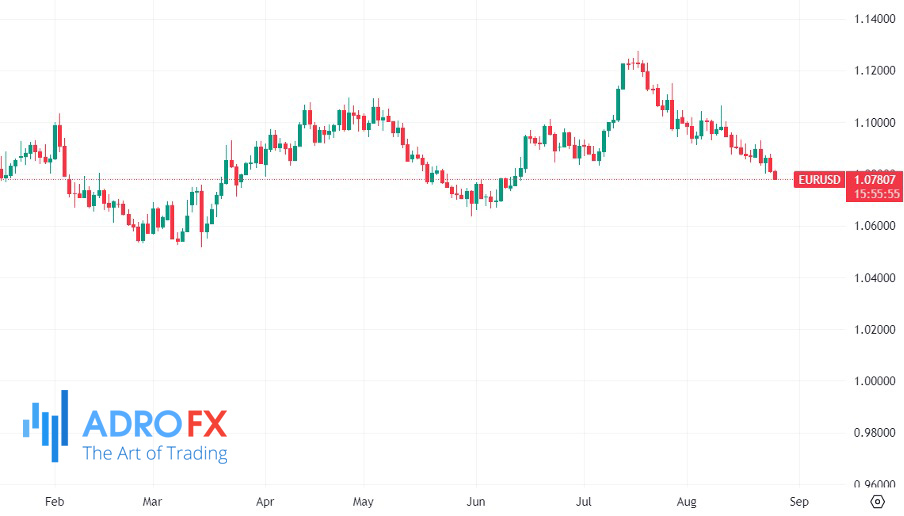
At the same time, the US dollar index, which gauges the currency against a basket of six well-established peers including the euro and yen, surged to a peak of 104.20. This level was last observed in early June.
The euro's value sank to its lowest point since mid-June, reaching $1.07845.
In relation to the Japanese yen, the dollar retraced towards the nine-month peak of 146.545 recorded last week, ultimately settling at 146.15.
Ahead of national figures, Tokyo's consumer price data released on Friday revealed that inflation remained significantly above the Bank of Japan's target. However, there was a second consecutive month of deceleration, implying reduced pressure on the Bank of Japan to make immediate policy adjustments.
The Japanese government bond market experienced limited activity, with the benchmark 10-year note yet to be traded during the day. The yield decreased to 0.645% on Thursday after recently reaching a 9.5-year high of 0.675% in the previous session. Notably, the Bank of Japan unexpectedly doubled the unofficial policy cap on the yield to 1% at the conclusion of the previous month.
Conversely, equivalent US Treasury yields recorded a slight increase, settling at 4.245%. This came after the previous session's low of 4.174%, although it remained notably lower than Tuesday's peak of 4.366%, the highest level witnessed since November 2007.
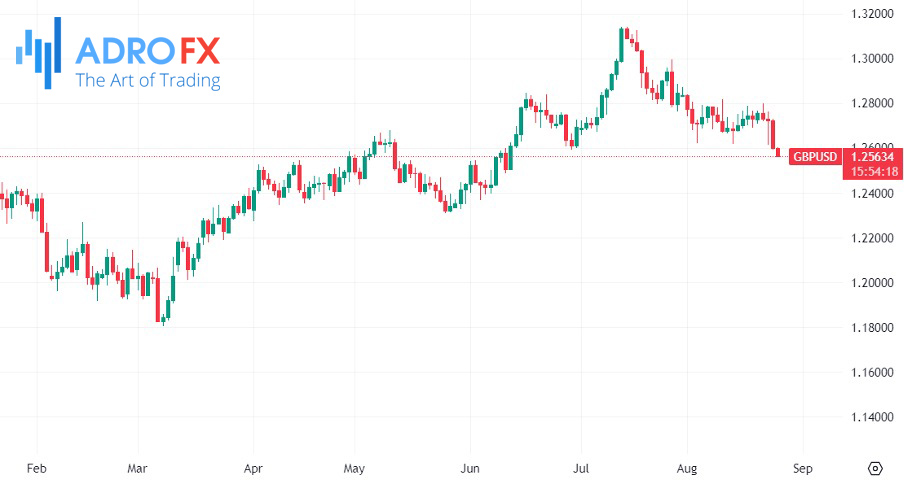
Once more, the pound is experiencing a decline on Thursday, extending its fall over the past couple of days in response to concerning economic data emerging from the UK.
Interestingly, this pound's weakness might be contributing to the FTSE's relatively stronger performance today. Among the European indices, the FTSE stands out as one of the few that remains in positive territory. The early gains observed during the day, unfortunately, lost momentum as time progressed.
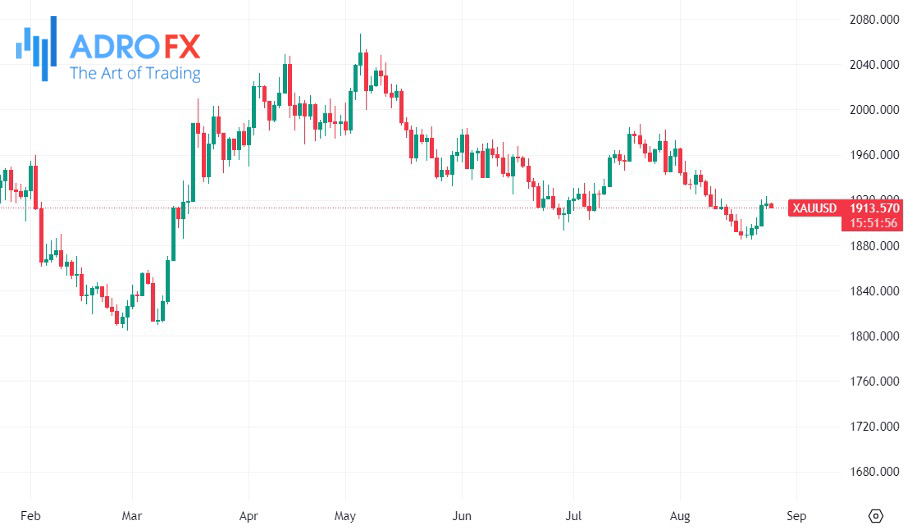
While there is a slight recovery seen in gold's value this week, its movement remains sluggish and lacking vigor even at this juncture. Although a resurgence seemed evident yesterday, that momentum appears to have waned already today.
Related Articles


Latest updates
Latest updates


Technical Analysis
Latest updates


