Unveiling the Power of Japanese Candlestick Patterns: A Comprehensive Guide for Forex Traders
Amidst the continuously evolving landscape of forex trading, Japanese Candlestick Patterns have risen as a priceless asset, furnishing traders with deep-seated insights into market trends and the dynamics of price action. Stemming from 17th-century Japan, these patterns have traversed geographical boundaries, captivating traders globally and cementing themselves as an essential element of their trading arsenal.
Consider this comprehensive guide as your gateway to unveiling the extensive history, inherent significance, profound ramifications, and pragmatic utilization of Japanese Candlestick Patterns. Equip yourself with this understanding to embark on a journey of transformation, enriching your trading strategy to reach unparalleled heights.
A Journey Through History
The roots of Japanese Candlestick Patterns can be traced back to Japan's Edo period, where they initially found application in analyzing rice markets. Munehisa Homma, a renowned Japanese rice trader, stood at the forefront of developing and popularizing these patterns. His acute understanding of market psychology laid the groundwork for a groundbreaking approach to interpreting price movements.
These patterns serve as a visual depiction of price action, encapsulating crucial data points such as open, close, high, and low prices within a designated timeframe. Each candlestick narrates a story, unveiling the ongoing tug-of-war between buyers and sellers and illuminating shifts in market sentiment.
By immersing themselves in these patterns, traders attain a deeper understanding of the underlying forces shaping price dynamics. This comprehension enables them to anticipate potential trend reversals, identify continuation patterns, and pinpoint critical support and resistance levels.
Japanese Candlestick Patterns have traversed geographical borders, gaining widespread adoption among traders worldwide. Whether you're a novice or a seasoned participant in the market, these patterns harbor the potential to enhance your trading decisions and provide invaluable insights.
Harnessing the Power
The hallmark of Japanese Candlestick Patterns lies in their capacity to decipher market sentiment and offer clear signals amid the tumultuous fluctuations in prices. By meticulously analyzing candlestick shapes, sizes, and configurations, traders can identify patterns like doji, hammers, engulfing patterns, and more.
Each pattern harbors unique implications, signaling potential shifts in trends, continuations, or moments of uncertainty within the market. Armed with this comprehension, traders can make well-informed decisions, adeptly manage risks, and refine their entry and exit strategies.
Translating Theory into Action
To excel in the art of trading with Japanese Candlestick Patterns, traders must embrace a systematic approach. This involves accurately identifying patterns within price action, verifying their validity through additional technical indicators or price action signals, and determining optimal entry and exit points based on pattern interpretations.
Effective risk management stands as a cornerstone, entailing the establishment of appropriate Stop Loss and Take Profit levels. As market dynamics shift, it becomes crucial to adapt trading strategies accordingly and continually hone skills through diligent practice and real-world experience.
Ultimate Guide to Japanese Candlestick Patterns
Japanese Candlestick Patterns stand as a visual representation of price action within a designated timeframe. Each candlestick on a chart encapsulates four critical data points: the opening price, closing price, highest price (high), and lowest price (low).
The body of a candlestick delineates the price range between the opening and closing prices, while thin lines, termed wicks or shadows, extend from the top and bottom of the body, portraying the complete price range encompassing the high and low prices.
These patterns offer myriad advantages over alternative charting methods. They furnish a lucid depiction of price action, simplifying the identification of trends, support and resistance levels, and pivotal market turning points.
Moreover, they unveil insights into the psychology of market participants, mirroring the collective sentiment and conduct of buyers and sellers.
The Advantages of Candlestick Charts
Candlestick charts boast unique benefits that can revolutionize your approach to forex trading. Through their visually intuitive depiction of price action, these charts offer a comprehensive snapshot of market dynamics.
By capturing the delicate equilibrium between buyers and sellers, candlestick charts facilitate the identification of trends, support and resistance levels, and significant market turning points. Prepare to deepen your understanding of market sentiment and unlock unprecedented opportunities.
The visual nature of candlestick charts sets them apart from other charting methods. Each candlestick vividly portrays market activity, encapsulating the opening, closing, high, and low prices within a designated timeframe.
The body of the candlestick delineates the price range between the opening and closing prices, while the wicks or shadows extend from the top and bottom, illustrating the complete price range encompassing highs and lows.
This visual representation aids in comprehending the fluctuation of market sentiment. Rising and falling trends, zones of price consolidation, and notable market reversals become readily discernible on the chart.
Candlestick charts facilitate the identification of patterns and formations signaling potential shifts in market direction, aiding in anticipating trend continuations or potential reversals.
Moreover, they excel at highlighting support and resistance levels - critical price thresholds where buying or selling pressure typically emerges - easily identifiable on the chart.
By pinpointing these levels, you gain a strategic edge in your trading decisions, establishing more precise entry and exit points, effectively managing risk, and identifying potential breakout or consolidation zones.
Candlestick Anatomy Demystified
A meticulous exploration of the intricate elements constituting each candle unveils profound insights into the invaluable information it discloses. From the body, delineating the variance between open and close prices, to the wicks and shadows revealing the price range, mastering the shape, size, and placement of these constituents unveils a trove of knowledge about market sentiment and potential price fluctuations.
The body of the candlestick acts as the cornerstone of its narrative, portraying the price range between the opening and closing prices within a designated timeframe. A solid or filled body indicates a closing price lower than the opening price, reflecting bearish sentiment. Conversely, an empty or hollow body suggests a closing price surpassing the opening price, indicating bullish sentiment. The body size offers insights into the intensity of buying or selling pressure.
Extending from the top and bottom of the body, the wicks and shadows enrich the candlestick's story. The upper shadow represents the highest price reached during the timeframe, while the lower shadow signifies the lowest price.
The length of the shadows conveys pivotal information about price volatility and the interaction between buyers and sellers. Lengthier shadows imply a broader price range and heightened market volatility, whereas shorter shadows suggest price consolidation and subdued market activity.
To grasp a comprehensive understanding of market sentiment, it's imperative to closely scrutinize the correlation between the body and the shadows. For instance, a candlestick with a diminutive body and elongated upper and lower shadows—a spinning top—hints at market indecision and a potential trend reversal. Conversely, a candlestick featuring a small body and truncated shadows—a doji—suggests a clash between buyers and sellers.
By dissecting the shape, size, and positioning of these constituents, traders can unearth invaluable insights into market sentiment and potential price shifts. A prolonged bullish candlestick with minimal upper shadow underscores robust buying pressure and the probability of an uptrend continuation. Conversely, an elongated bearish candlestick with a sparse lower shadow signals robust selling pressure and the potential continuation of a downtrend.
Here are visual depictions of some candlestick formations:
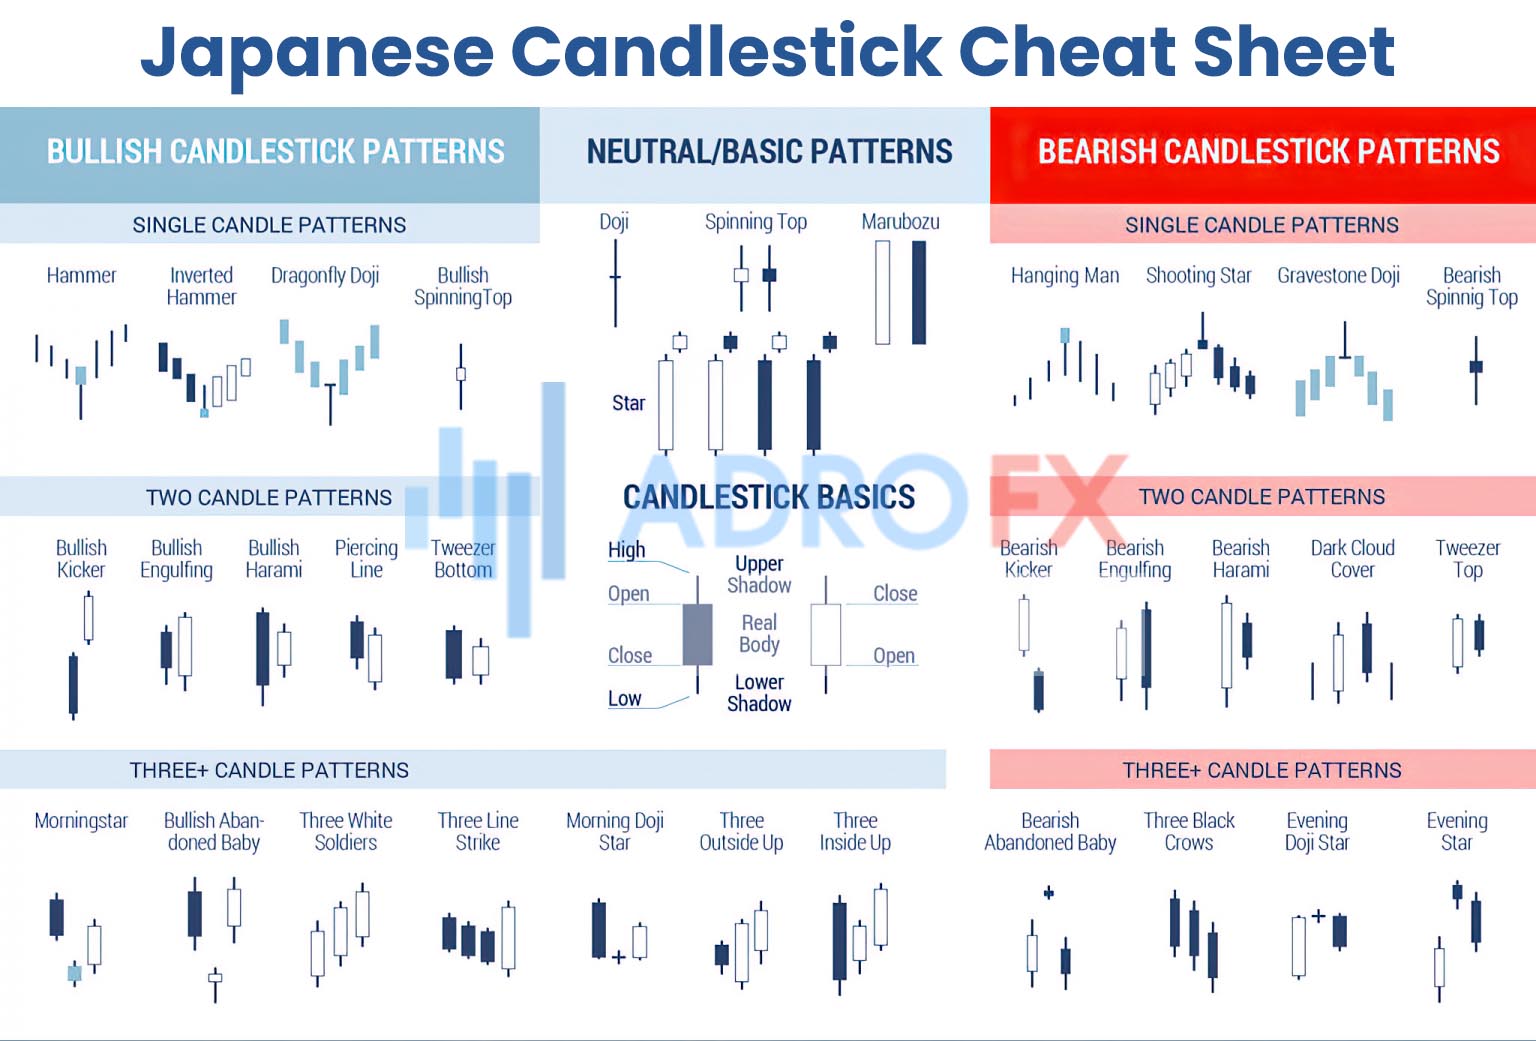
Mastering The Core Japanese Candlestick Patterns
Having explored the historical context and significance of Japanese Candlestick Patterns, let's now dive deeper into mastering these essential tools for achieving success in forex trading. Japanese Candlestick Patterns encompass a diverse range of formations, each carrying its own unique implications for market direction and sentiment. In the subsequent sections, we'll focus on elucidating some of the core patterns every trader should familiarize themselves with:
The Doji
Characterized by its small body and upper and lower shadows of similar length, the doji indicates market indecision and suggests a potential trend reversal, particularly noticeable after prolonged uptrends or downtrends.
The Hammer
Featuring a small body near the candle's peak and an elongated lower shadow resembling a hammer, this pattern implies bullish reversal possibilities, especially potent when appearing after a downtrend, signaling renewed buyer interest to push prices higher.
Engulfing Patterns
These consist of two candlesticks, with the second candle's body fully engulfing the first. A bullish engulfing pattern occurs when the second candle's body exceeds the first and closes above its high, indicating promising bullish momentum. Conversely, a bearish engulfing pattern occurs when the second candle's body surpasses the first and closes below its low, suggesting potential bearish momentum.
Morning Star and Evening Star
Representing three-candle reversal formations, the morning star emerges during a downtrend, comprising a long bearish candle followed by a small-bodied candle (the star), concluding with a bullish candle closing beyond the midpoint of the initial candle, hinting at a potential bullish reversal. Conversely, the evening star appears during an uptrend, starting with a long bullish candle, followed by a small-bodied candle, and ending with a bearish candle closing beyond the midpoint of the initial candle, indicating a potential bearish reversal.
Harami
When a small-bodied candle is nestled within the preceding candle's body, the harami suggests a potential trend reversal, with the small candle representing market indecision.
By mastering these foundational Japanese Candlestick Patterns, traders can gain valuable insights into market sentiment, facilitating informed trading decisions. It's essential to remember that proficiency in utilizing these patterns in your trading strategy is honed through dedicated practice and hands-on experience.
Unlocking the Secrets of Japanese Candlestick Patterns
Japanese Candlestick Patterns have emerged as indispensable tools for traders, offering unparalleled insights into market dynamics. Developing expertise in trading with these patterns can provide you with the accuracy and confidence necessary to navigate the markets successfully.
This comprehensive guide serves as a roadmap to effectively harness Japanese Candlestick Patterns for trading chart patterns, step by step.
Identifying Opportunities Amidst Market Volatility
Mastering Japanese Candlestick Patterns commences with the ability to identify these patterns on your charts. By discerning the unique shapes, sizes, and configurations of candlesticks, you can uncover various patterns amidst the chaos of price fluctuations, gaining a competitive advantage in spotting potential trading opportunities.
Enhancing Analysis with Supplementary Indicators
While Japanese Candlestick Patterns offer valuable insights, augmenting your analysis with additional indicators and tools is crucial. Explore the use of technical indicators such as moving averages, oscillators, or trendlines to validate the signals provided by candlestick patterns. By integrating multiple sources of confirmation, you can enhance the reliability of your trading decisions and bolster your confidence in executing trades.
Precision in Entry and Exit Points for Optimal Outcomes
Effective timing is pivotal in trading, and Japanese Candlestick Patterns can assist in identifying optimal entry and exit points. Learn to interpret patterns within the broader context of market trends, support and resistance levels, and other technical analysis tools. By aligning signals from candlestick patterns with other factors, you can pinpoint favorable entry points to maximize potential profits while minimizing risks.
Protecting Your Capital with Sound Risk Management
Risk management is fundamental to successful trading, and Japanese Candlestick Patterns seamlessly integrate risk management techniques. Establish appropriate Stop Loss levels to protect your capital in case trades move against you, and determine Take Profit levels to secure profits when trades move in your favor. By meticulously managing risk, you can preserve your trading capital and optimize your overall trading performance.
Adaptation to Evolving Market Conditions
Given the dynamic nature of markets, your trading strategy must adapt accordingly. Stay vigilant about evolving market conditions and adjust your approach as necessary. While Japanese Candlestick Patterns offer valuable insights, they are not infallible. Continuously evaluate the effectiveness of your strategy and remain open to refining and adapting it to changing market dynamics. Flexibility and adaptability are key attributes of successful traders.
By following this systematic approach, you can cultivate the confidence and precision needed to effectively trade chart patterns using Japanese Candlestick Patterns. Remember, mastery requires practice, so allocate time to analyze historical charts, practice on demo accounts, and gradually implement your learnings in live trading. With dedication, perseverance, and a profound understanding of Japanese Candlestick Patterns, you can unlock the potential for consistent trading success.
Conclusion
In the ever-evolving landscape of forex trading, Japanese Candlestick Patterns have emerged as a cornerstone, offering traders profound insights into market trends and dynamics. Originating centuries ago in Japan, these patterns have transcended borders, captivating traders worldwide and becoming an indispensable component of their trading arsenal.
This comprehensive guide has been your passport to unraveling the rich history, intrinsic significance, profound implications, and practical application of Japanese Candlestick Patterns. Armed with this knowledge, you're poised to embark on a transformative journey, elevating your trading strategy to unprecedented heights.
We've journeyed through history, tracing the origins of Japanese Candlestick Patterns to Japan's Edo period, where they were first utilized in analyzing rice markets. We've explored how these patterns offer a visual narrative of price action, shedding light on shifts in market sentiment and empowering traders with a deeper comprehension of underlying forces.
From harnessing the power of Japanese Candlestick Patterns to decoding market sentiment and putting theory into practice, we've provided a systematic approach to master these essential tools. By accurately identifying patterns, confirming signals, timing trades, managing risk effectively, and adapting to changing market conditions, you're equipped to navigate the markets with precision and confidence.
The core Japanese Candlestick Patterns we've covered - Doji, Hammer, Engulfing Patterns, Morning Star and Evening Star, and Harami - offer invaluable insights into market sentiment and potential price movements. Mastering these patterns is essential for every trader seeking consistent success in the forex market.
As you continue your trading journey, remember that mastery comes with practice and experience. Dedicate time to analyze historical charts, practice on demo accounts, and gradually implement your learnings in live trading. Stay flexible, continuously refine your skills, and adapt your strategies to evolving market dynamics.
With dedication, perseverance, and a deep understanding of Japanese Candlestick Patterns, you're well-positioned to unlock the potential for consistent trading success. Now, armed with these insights, go forth and conquer the markets with confidence.

About AdroFx
Established in 2018, AdroFx is known for its high technology and its ability to deliver high-quality brokerage services in more than 200 countries around the world. AdroFx makes every effort to keep its customers satisfied and to meet all the trading needs of any trader. With the five types of trading accounts, we have all it takes to fit any traders` needs and styles. The company provides access to 115+ trading instruments, including currencies, metals, stocks, and cryptocurrencies, which make it possible to make the most out of trading on the financial markets. Considering all the above, AdroFx is the perfect variant for anyone who doesn't settle for less than the best.
Related Articles

Latest updates
Latest updates


Technical Analysis
Latest updates


