Trading with Forex Oscillators

In forex trading the price can be in one of two states – either trending or flat (sideways trend, range). Trading during a stable trend, the trader sees that all trend indicators confirm the movement. Trading at such moments is easy and profitable. But when a pause occurs or the trend is over, what then? It is more difficult to trade in the flat. Namely, the forex oscillators are used for analyzing the flat. This is what we will talk about today.
What are Forex Oscillators and Why Do We Need Them?
Often oscillators are not distinguished as a separate group of technical analysis tools and may be called just indicators. Nevertheless, they sufficiently differ from technical indicators. From the perspective of technical analysis, an oscillator represents an expression of price movement for a particular period of time. In the forex trading platform, the oscillators are usually located in the form of a line chart in a separate window under the price chart.
The oscillator is meant to ease the trader`s job and accurately show the state of the market, in particular, to determine whether the underlined asset is in an overbought or oversold condition. On various forex trading terminals, in general, the same oscillators are presented as the most popular and time-time-tested ones. On MetaTrader 4 oscillators are located to the left of the chart in a separate list.
Application of Oscillators in Forex Trading
Oscillators are believed to be able to indicate the future direction of a trend change before it is noticed on the price chart. The main thing that oscillators display and based on which one can make market analysis is the overbought and oversold nature of the forex market.
Overbought is when the price has reached the level, after which further price growth is dubious. Oversold is described as such a low price of the asset, that a further price decline is doubtful. The overbought or oversold condition suggests that the trend will soon reverse. The task of the oscillator is to show the overbought and oversold areas prior to the trend starting to alter its direction.
Oscillators are also used to spot divergences and convergences, which also indicate a trend reversal.
Most traders consider oscillators to be useless in a strong trend and effective in a flat, in this case, oscillators can quickly detect a short-term oversold or overbought. But there is another opinion: oscillators can detect overbought and oversold conditions in a clearly defined trend and they can also detect when the trend is losing its strength.
Anyway, oscillators are most often used in addition to indicators and not as a complete trading tool. Indicators of oscillators are most accurate in a number of cases, they include, in particular, the extremums that the oscillator reaches. This implies that the trend is weakening and there may soon be a reversal. Another situation requiring attention is when the oscillator crosses the zero line and this overlaps with the trend direction.
How Do We Read and Interpret the Forex Oscillators?
Technical analysis tools of the oscillatory type give the trader a lot of signals which inform about certain actions on the market. Depending on the indicator line crossing the existing chart, there are 4 types of signals. In addition to these mark the search for figures on the monitor, which draws the oscillator. This helps to anticipate the trend forming on the market and use it to one's advantage.
Crossover of Oversold and Oversold Lines
The intersection of the oversold line indicates that the market is oversaturated with sales, which means that the lot price of the traded instrument will most likely increase. And vice versa, entering the oversold area indicates the prevalence of purchases, i.e. demand will soon begin to fall and so will the price.
In the settings of each indicator, there are standard oversold and overbought values, which are 20% and 80%. Experienced traders recommend changing them depending on the current market situation.
Beginners are advised to adjust the tool according to the tips of the strategy they are applying. The crossover point of the lines acts as a signal to act.
If the market reverses and goes down, the price of the lot being analyzed decreases, and the trader will be advised to start selling before the value finally drops. The reverse movement will signal the necessity to buy.
Zero-Line Crossover
This signal is better perceived as an auxiliary tool, which helps to verify the earlier decision but not to take the final action. This is explained by the fact that until the moment of crossing with the zero threshold the value passes most of the distance in the current direction, so it is not suitable for opening orders. Such trading will result in little profit (at best) or loss.
As a call to action, the zero-axis crossover can be considered only with some settings and in combination with other analytical tools.
In this case, the signals are interpreted as follows:
- Buy when the axis is crossed from the bottom up;
- Sell when it`s crossed from the top downwards.
Divergence
Divergence is a situation when the price and the oscillator charts show great divergence from each other. As an example, we can take the case when the price chart shows two gradually increasing maximums, while the indicator shows the second maximum value below the first one.
The situation may be the reverse. This signal is considered to be the strongest and tells the trader that the current price potential does not coincide with the figure on the chart.
There are 2 possible variants:
If the price is depicting an increasing high and the indicator is not repeating it, then the rise is not backed by solid fundamentals. This means that the price will soon fall to a fair value.
In the case where the oscillator does not repeat the minimum value of the value (that is, at the minimum value of the second price peak the second indicator is located above the first peak), there is a probability of a reversal of the chart, the price will begin to rise.
Mutual Crossover
The chart of most indicators of the oscillator type has not one, but several lines (slow and fast). Their location (especially their intersection) signals to a trader about the favorable conditions for opening buy or sell orders.
If two lines of the oscillator tend upwards and the fast line touches the slow one during the upward movement, it is a good time to buy. Conversely, if both lines are trending downward and the crossover is from upside down, this is a sell zone.
There are situations when lines are permanently crossed in one time frame, but their direction does not change. This indicates a strengthening of the signal. Another such value is the intersection of the fast and slow lines of the zero axis.
The Most Popular Oscillators
In professional trading, it is not customary to build a tactic of behavior on the market, based only on the readings of oscillator indicators. This is mainly because of the fact that the action of a tool can change quickly depending on market conditions. However, they perform an irreplaceable role as an additional analytical indicator. Traders single out the 7 most popular oscillators in technical analysis.
Stochastic
This type of oscillator forms a graph in a separate window and is represented as 2 curves - %K and %D. Depending on the market situation the Stochastic indicator can take values between 0 and 100%.
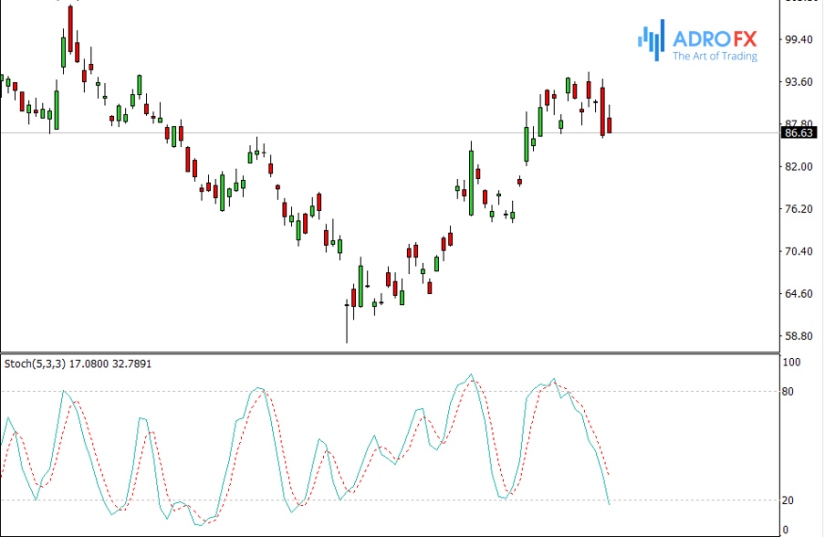
The analytical tool builds in addition 2 levels - overbought and oversold. The layout of the lines can be set individually. The standard settings are 20 and 80 or 30 and 70.
Relative Strength Index (RSI)
The Relative Strength Index takes into account the closing prices as well as the number of profitable and loss-making closes. The oscillator was discovered back in 1978 and is still in demand among stock traders.

The main type of signal is going beyond the overbought and oversold areas. In this situation, it is recommended to use RSI rather than Stochastic, because of the easier perception of the first instrument (the index is equipped with only 1 curve).
The Williams R Indicator
The Williams R Oscillator, or Percent Range, is an inverse version of Stochastic. It is based on the closing prices. The developers planned to use the tool for determining the overbought and oversold areas.
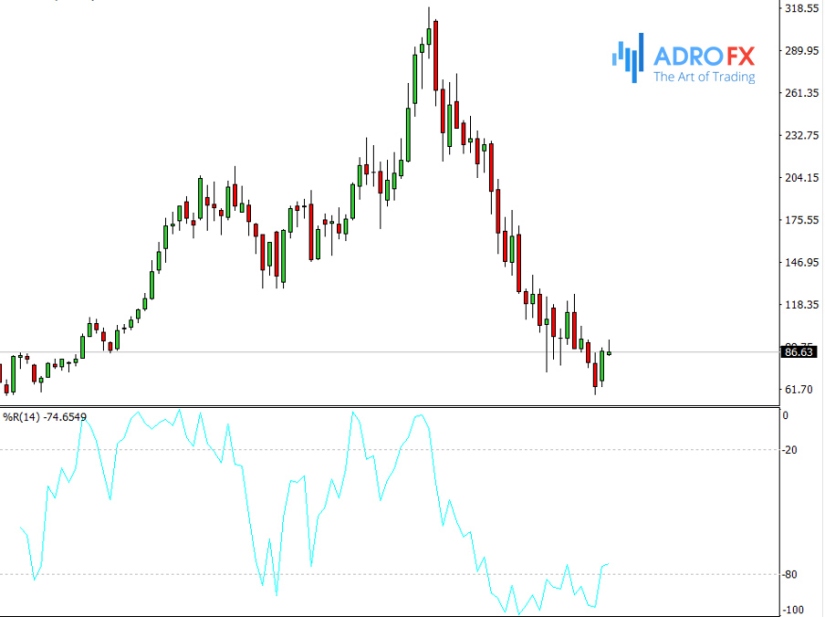
The starting point for placing an order can be considered when the indicator reaches the value of 0 and 100. Such signals are very accurate and almost do not lead to drawdown.
Average True Range (ATR)
It reflects the main function of this indicator.
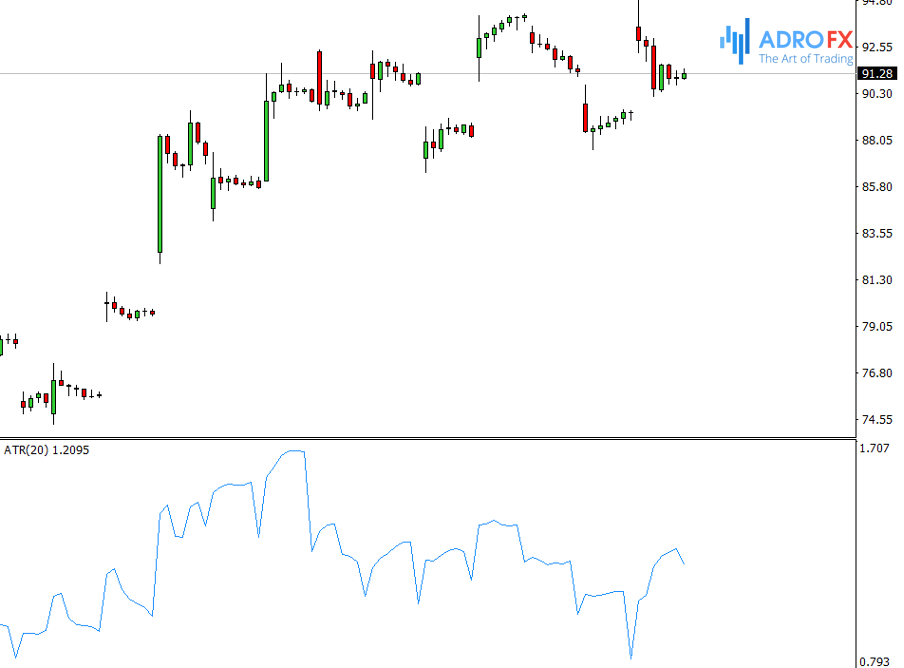
It determines the level of volatility of the analyzed instrument price. If the value of the oscillator increases, so does the volatility. Conversely, if the value of the oscillator decreases, the market calms down and the volatility gradually decreases.
MACD
This instrument has borrowed its major aspects from another analytical indicator - Moving averages (MA). There are two types of MACD - linear and histogram. To calculate its value, 2 Moving Averages with different time frames are used.
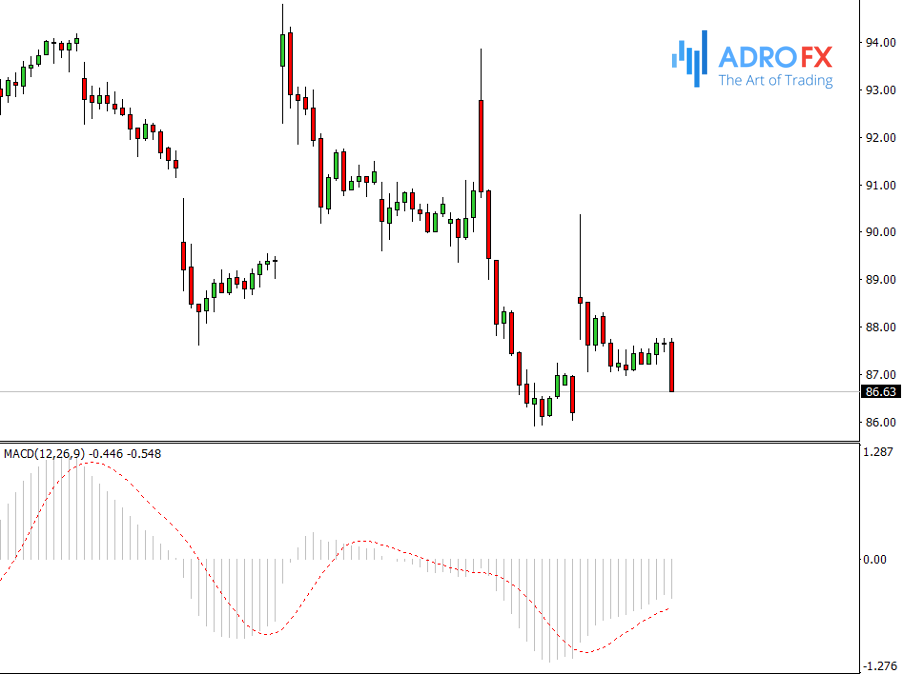
It is calculated according to the following principles:
- MA with a smaller period (standard 12) is subtracted from MA with a larger period (more often 26);
- Then, to smooth the readings and get the signal line, the value obtained above is smoothed by means of an Exponential Moving Average (often with a period of 9).
Momentum
The indicator was created to show the difference between the current value and the price n-periods ago. Thus it is possible to see net growth (uptrend) and a price decline (downtrend), which are not yet masked by volatility. The Momentum Oscillator is calculated as a percentage.
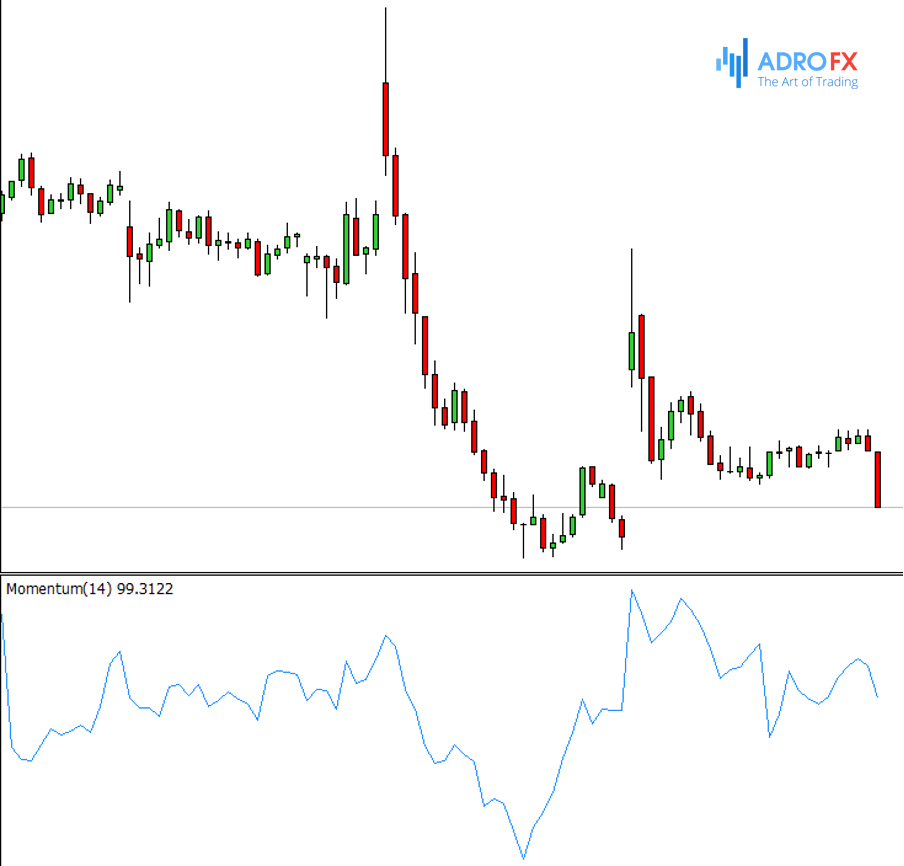
To calculate this indicator the current price of the analyzed financial or stock instrument is divided by the value of n-periods backward. To get the result as a percentage the received number is multiplied by 100.
The formula takes the following form: Momentum = (P(n) / P(n-1)) x 100%, where P(n) shows the current price of the financial instrument and P(n-1) - is the price of the same lot n-periods ago.
Awesome Oscillator
This is the second Bill Williams' oscillator, which is very similar to MACD in its calculation formula.
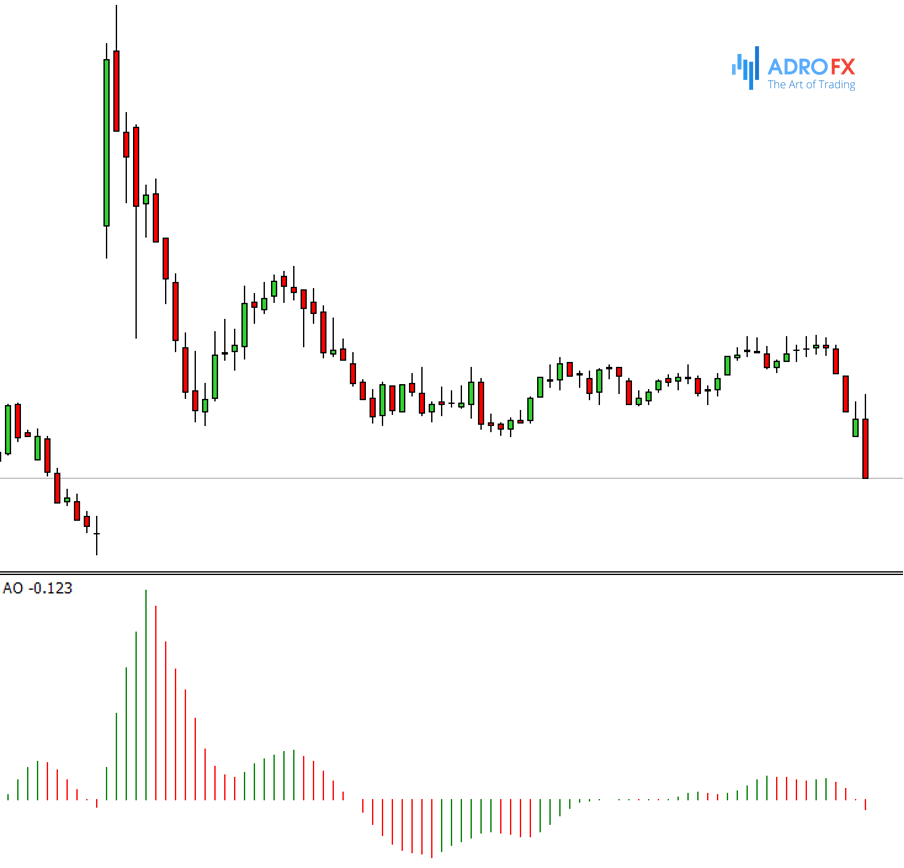
The main difference is that the median price (arithmetic mean of maximum and minimum values of the candle) is used in the calculation of the fast and slow Moving Averages. The second difference is in the periods of Moving Averages, which in this tool are fixed and do not change.
Advantages and Disadvantages of Forex Oscillators
Oscillators differ in effectiveness, situations of preferred use, complexity, and other features that need to be studied before using them in trading.
But oscillators have both common disadvantages and advantages. The advantages include, for example, that they give anticipatory signals about the end of a trend or correction. Most oscillators are easy to understand and easy to tune to a trader's requirements. On the other hand, they can be false, and oscillators can, for example, signal a trend reversal already when a steady trend is formed.
For this reason, oscillators are not used without indicators and their use is limited to a trading range equal to the oscillator's length, then it must be reset.
Conclusion
Each forex oscillator is secondary, that is, dependent on other indicators, so it is not recommended to use only oscillators.
No matter how perfect the indicator (any indicator) may seem to you, you can't base your analysis only on it. The key to profitable trading is an integrated, holistic approach, and you need to remember that the profitability of the trade very much depends on the broker you choose!

Related Articles

Latest updates
Latest updates


Technical Analysis
Latest updates


