Testing and Evaluation of Trading System Efficiency
Testing of created rules is the most important and responsible stage, as a trader's future depends on the results of testing. Testing of trading system rules can be done manually or use a special program.
The manual test takes more time than the computer one. Testing in the program allows faster selection of optimal parameters for indicators, but only those rules can be tested and programmed, which requires special knowledge. The manual test allows a better feeling of the market and the principle of working according to the rules of trading strategy.
In general, if you plan to trade manually afterward, the testing should be done manually as well. If you use an Expert Advisor or robot, the program for testing will be a great help.
Choosing a Testing Period
The testing period depends on the time frame in which the moment of entering the market is determined. There are general recommendations. If you plan to trade in a daily chart, the testing period should be at least five years. If your scale is shallower than a day, then the testing period should be at least one year, to take into account the seasonality factor.
Such recommendations are based on the statistically required minimum amount of data. Testing should include not only periods of rapid economic growth, but also the most recent crisis or recession.
The longer the period tested, the more reliable the results will be.
Why is this necessary? If you look at the behavior of the charts in the phase of economic growth, almost any position in the trend will bring good earnings. The same cannot be said for the recession or crisis phase.
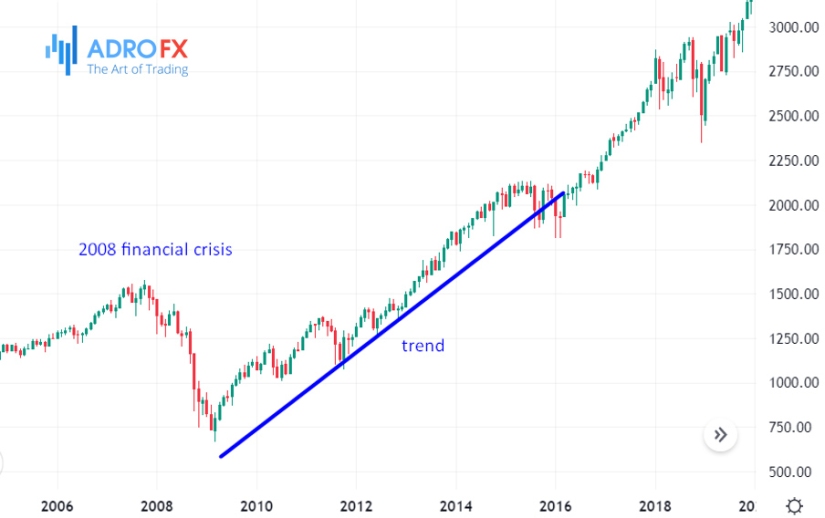
Let's look at a chart of the S&P 500 Index and see that after the 2008 crisis, there was rapid growth for many years. The trend strategy would have shown excellent results during this period. However, when it comes to a prolonged period of sideways movement, during which the results would be less impressive.
The Procedure for Administering the Test
If we're talking about manual testing, you need to understand how and what data to collect.
The test is conducted as follows:
- We move the chart backward, let's say by two years, and put all the necessary tools on it;
- Gradually moving the chart to the left, we will see if there is a signal to enter the market;
- As soon as a signal appears, trying not to look ahead, we define the level of entry for Stop Loss and Take Profit orders;
- Move the chart forward and determine whether or not there was a market entry, and if so, what the final results were.
Usually, everything is summarized in a table like this:
| DATE, TIME | RULE | STOP LOSS | DURATION | RANGE | GAIN & LOSS |
DATE, TIME: fix the date and time of the market entry;
RULE: here we write the serial number of the rule by which the position is opened if there are several of them. If there is only one rule, this column is not required;
STOP LOSS: we record the size of the calculated loss;
DURATION: is the maximum time of an open position's duration before it is closed;
RANGE: maximum price movement before the market reverses and closes the position;
PROFIT & LOSS: These columns are for the two position holding options - close by Stop Loss and Take Profit. These results will be different. It may happen that the price will reach Take Profit, but Stop Loss has not been moved yet, or Stop Loss has already protected some of the returns, but Take Profit has not been reached yet. Accordingly, there will be a loss in one column and a gain in the other.
The result will be a set of data, with which you will need to work later to assess the effectiveness of the trading system, to choose the best option for the position, as well as the time or working schedule.
When you collect in a table the statistical data on open positions with the results obtained at closing, you will need to analyze the test and determine how effective your trading system is, what earnings can be expected from it and what losses will be incurred. To do this, you will need to make some calculations:
- The total number of open positions;
- The number of successful, losing, and parity positions;
- The total return;
- The total loss;
- The total return for the testing period;
- The maximum gain per trade. Consider that the gain is obtained by chance and will not happen again in the future. Therefore we remove it from point 5;
- The maximum loss per trade;
- The maximum number of wins in a row and return;
- The maximum number of losses in a row and the loss;
- The maximum cumulative loss. This is not the same as in point 9, although sometimes the figures coincide. There can be a streak of losing and winning positions but the return does not compensate for the previous loss and the next losing position increases the cumulative loss. For example, -25, + 5, -40, +12, -24, +6, -32 = -98;
- Reliable Gain Factor. This is the sum of all successful positions minus the position with the maximum gain, divided by the sum of all losing positions: (point 3 - point 6) / point 4. If the RPF is greater than one, the strategy is beneficial. Too high values of the RPF create doubts about the honesty and accuracy of testing.
- Restoration factor. It shows how many times the loss can be recovered during testing. It is calculated in the following way: total gain / maximum cumulative loss. Or: point 5 / point 10.
- Minimal deposit = maximum cumulative loss * 2 + 1 lot. Or: point 10 * 2 + 1 lot. Assume that the future will be worse than the past one, that is why we double the cumulative loss.
Then we plot the system's financial potential chart. It clearly shows how the deposit changes as a result of trading.
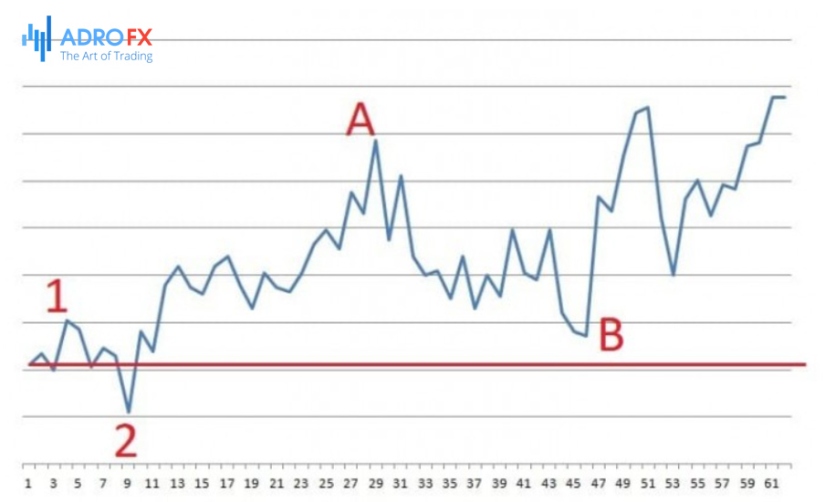
Financial potential chart
The figure shows the results of transactions for several years in percentages, grouped in equal amounts. The period between points 1 and 2 clearly shows the amount of losses that are twice as much as the earnings of the previous period. But that's not the worst of it. Imagine that the beginning of trading was at point A, and then the losses could be much bigger. This is another argument in favor of the fact that entering a trade with the entire deposit is a direct way to lose it.
The maximum increasing loss is much easier to determine on the chart – it is the interval between points A and B.
Also, we can judge the stability of the system by the chart. In general, the system is not very stable because there are quite sharp declines and rises, although the general trend is upward.
You can tell if the system is good or bad by "trying it on". You can see on the chart that the loss-making period lasted several months. Can you stand it?
All of the above requires time and patience, and there are not enough of them. Therefore, you can simply buy a ready-made trading system. The laws of the market work. If there is a demand for trading systems, they will be sold.
However, there are a few things that should alert you:
- The trading system shows a big income. Manipulation of results is a very common practice. Most likely, you will be shown the best period when the trading strategy brought a big gain, and the period with losses – not;
- The system is successful, but it sells for little funds. Think about it, why would you, if you are a seller, sell the system for $20 if it brings 500% annual returns?
- The system uses a lot of leverage. Margin trading only has an advantage when all of your capital is already allocated to assets that produce a steady income. In this case, a small part of the earnings can be allocated to such a trading strategy;
- Free robots or managers who do everything for you. If you think that someone will produce yield for you for free, then most likely the payment for this will be your entire deposit;
- "100% Guarantee! No Risk!" If you hear such a statement, it is a lie. No trading system is completely beneficia .
Regardless of where you get a trading system, it must be tested, that is tested by yourself. Firstly, you will get your results that you can trust. After all, the advertised indicators may be incorrect. Secondly, if it turns out that the system is losing, then the time spent on testing will save some funds. Thirdly, an independent test will give you a better understanding of the rules of the underlying strategy.

About AdroFx
Established in 2018, AdroFx is known for its high technology and its ability to deliver high-quality brokerage services in more than 200 countries around the world. AdroFx makes every effort to keep its customers satisfied and to meet all the trading needs of any trader. With the five types of trading accounts, we have all it takes to fit any traders` needs and styles. The company provides access to 115+ trading instruments, including currencies, metals, stocks, and cryptocurrencies, which make it possible to make the most out of trading on the financial markets. Considering all the above, AdroFx is the perfect variant for anyone who doesn't settle for less than the best.
Related Articles

Latest updates
Latest updates


Technical Analysis
Latest updates


