Mastering Trending Lines: A Guide to Technical Analysis

Trending lines are a fundamental concept in technical analysis, playing a crucial role in identifying trends within financial markets. By connecting a series of price points on a chart, trending lines help traders visualize the direction in which an asset's price is moving, whether upward, downward, or sideways. This visualization aids traders in making informed decisions by highlighting potential entry and exit points, areas of support and resistance, and overall market sentiment. Mastering the use of trending lines can significantly enhance a trader's ability to predict future price movements and develop effective trading strategies.
What Are Trending Lines?
Trending lines, also known as trend lines, are straight lines drawn on a price chart to connect specific data points, typically the highs or lows of price movements. They are used to identify and confirm the direction of a market trend over a given period.
Traders use trending lines to gain insights into the market's direction and strength. These lines help in predicting potential price movements by providing a visual representation of the prevailing trend. By identifying the direction of the trend, traders can align their strategies to capitalize on upward, downward, or sideways movements, thereby enhancing their chances of making profitable trades.
Types of Trending Lines
- Uptrend Lines
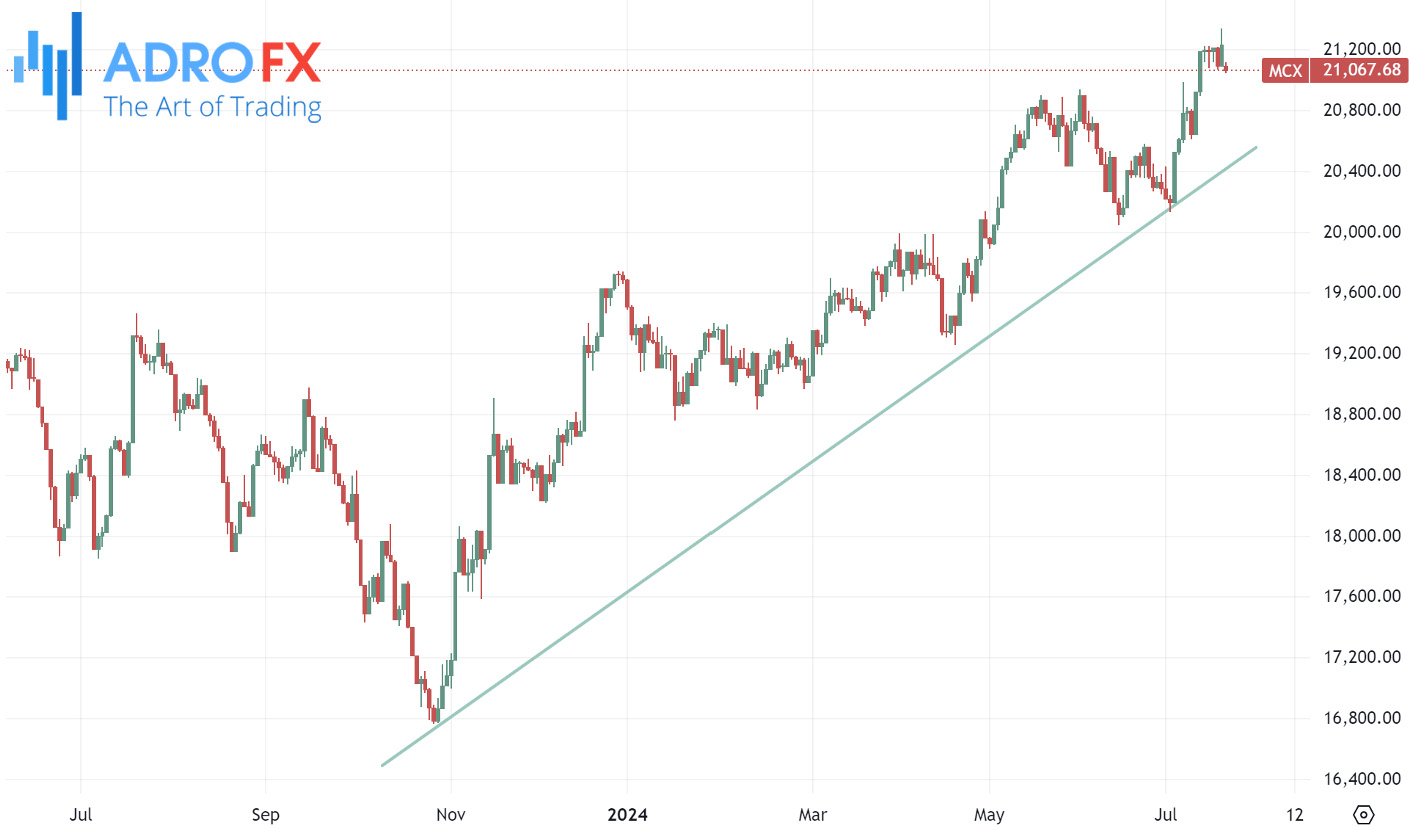
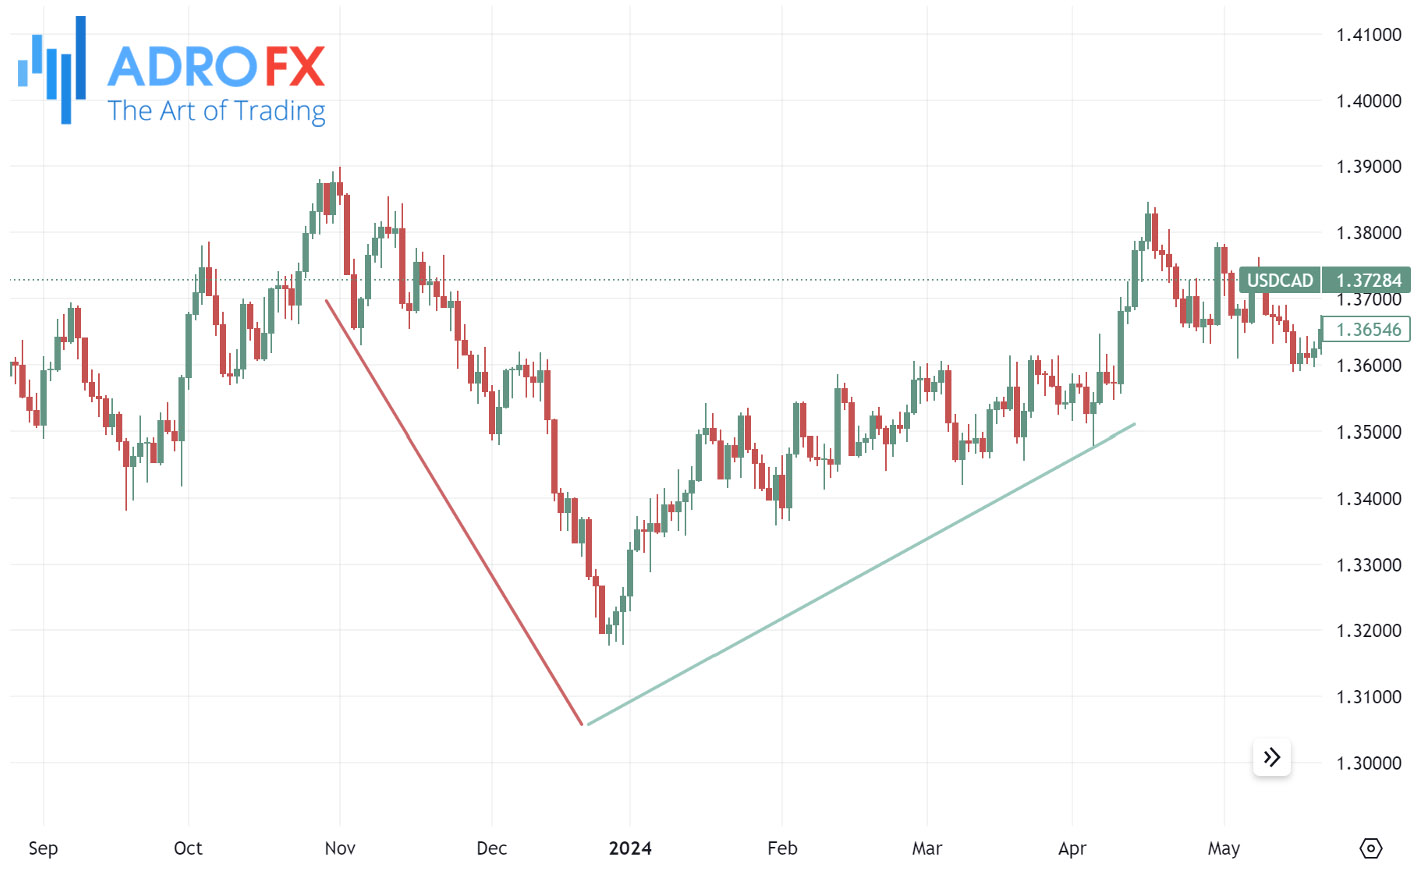
An uptrend line is drawn by connecting the successive higher lows in a price chart. It represents a period during which the asset's price is consistently rising. To draw an uptrend line, start from a significant low point and connect it to subsequent higher lows, extending the line into the future. Uptrend lines act as a support level, indicating that buyers are willing to step in at higher prices, thereby pushing the price higher over time.
- Downtrend Lines
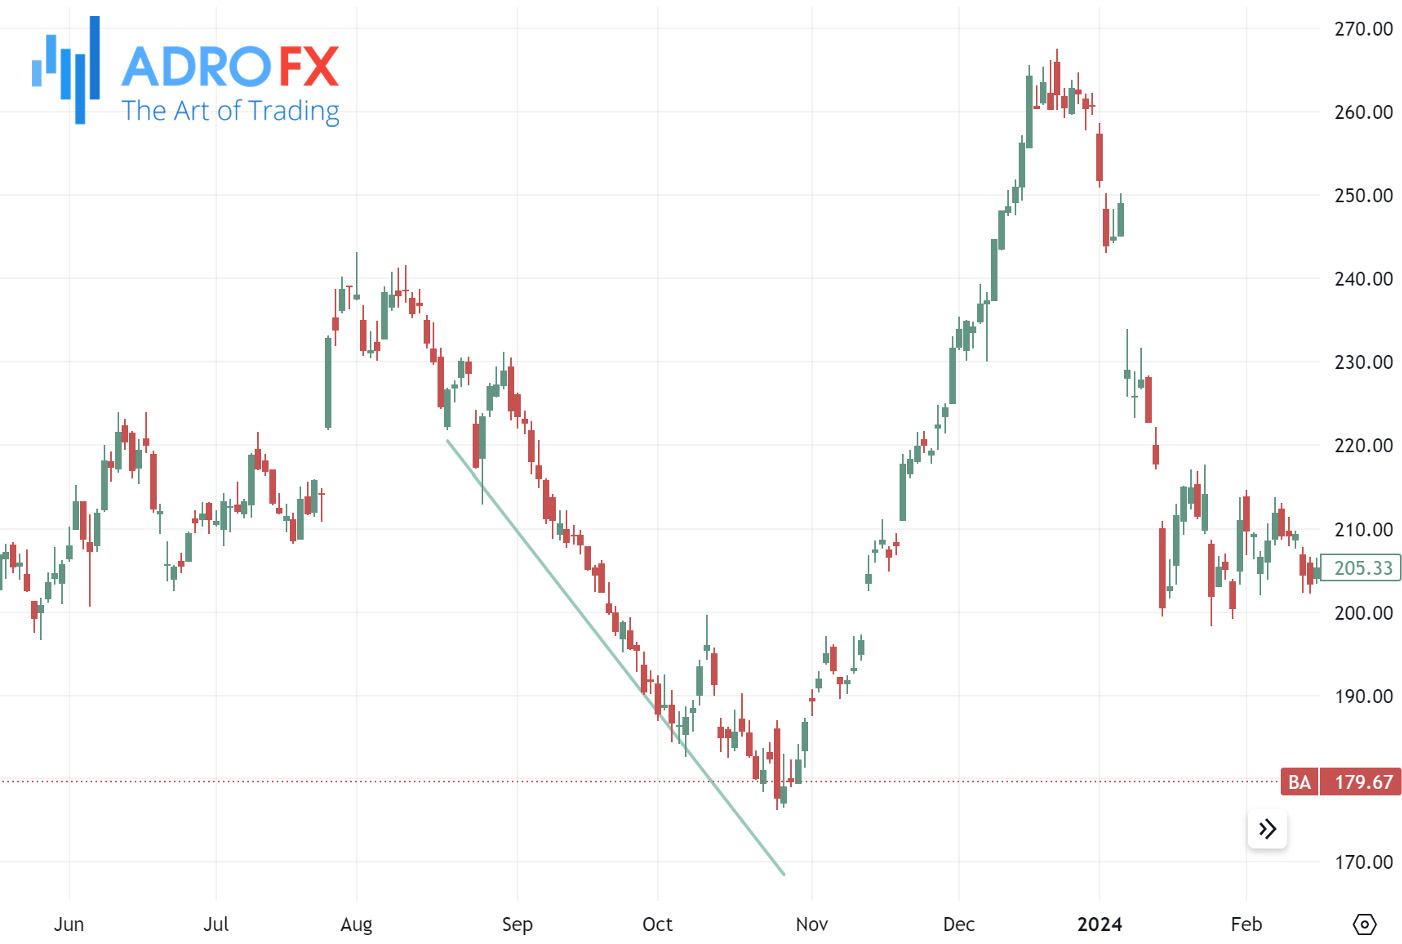
A downtrend line is formed by connecting the successive lower highs on a price chart. It signifies a period of declining prices. To draw a downtrend line, begin from a significant high point and connect it to subsequent lower highs, projecting the line forward. Downtrend lines serve as a resistance level, showing that sellers are consistently pushing the price lower, indicating bearish market sentiment.
- Horizontal Trend Lines
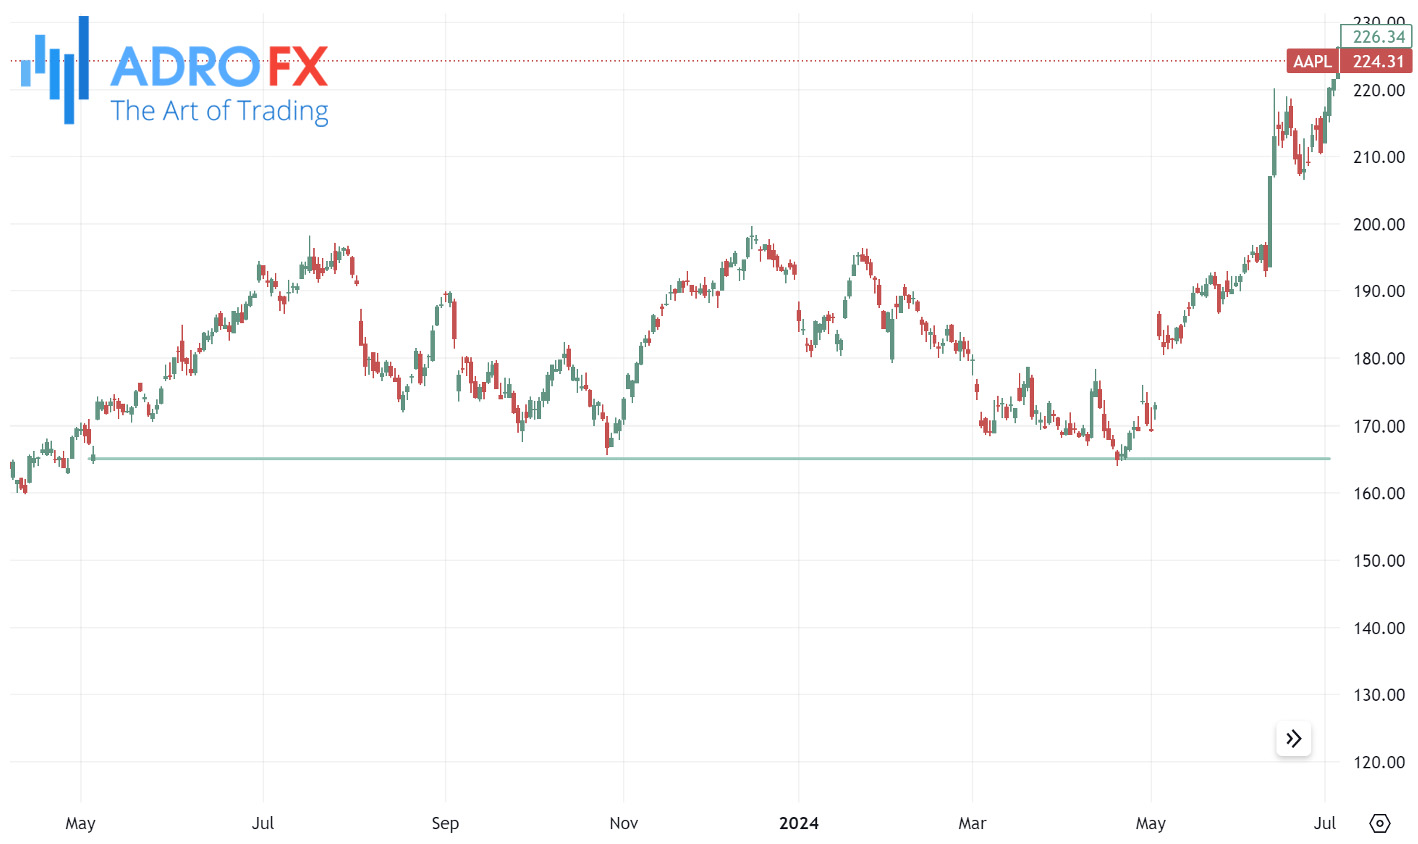
Horizontal trend lines are drawn by connecting price points that are relatively equal over a period, forming a flat line. These lines are significant in identifying areas of support and resistance. A horizontal support line is drawn through multiple low points where the price repeatedly bounces back up, while a horizontal resistance line is drawn through multiple high points where the price consistently hits the ceiling. These lines help traders anticipate potential breakouts or reversals when the price approaches these levels.
Drawing Trending Lines
To draw accurate trending lines, it is essential to identify the correct key points on a price chart. For an uptrend line, these points are the higher lows in an ascending price movement. Conversely, for a downtrend line, the points are the lower highs in a descending price movement. To start, find a significant low point (for an uptrend) or high point (for a downtrend), then connect it to the subsequent higher lows or lower highs. Ensure that the points used are significant and not minor fluctuations, as this increases the reliability of the trend line.
Most trading platforms provide built-in tools for drawing trending lines. These tools typically allow you to click on a starting point and drag the line to your desired ending point, making it easy to connect the appropriate highs and lows. Popular trading platforms such as MetaTrader, TradingView, and Thinkorswim offer user-friendly interfaces for drawing and adjusting trend lines. Utilizing these tools can help maintain accuracy and efficiency in your technical analysis.
When drawing trending lines, consider the following best practices to ensure precision:
- Use Multiple Points
Ensure your trend line touches at least two or more points to confirm the trend. The more points the line touches, the more valid it becomes. - Avoid Biases
Draw trend lines based on actual price movements rather than preconceived notions about the market direction. Objectivity is crucial for accurate analysis. - Adjust as Necessary
Trends evolve over time, and so should your trend lines. Regularly adjust your lines to account for new price movements and ensure they remain relevant. - Combine with Other Indicators
Use trend lines in conjunction with other technical indicators (such as moving averages or RSI) to validate your analysis and increase the robustness of your trading strategy.
Interpreting Trending Lines
Breakouts
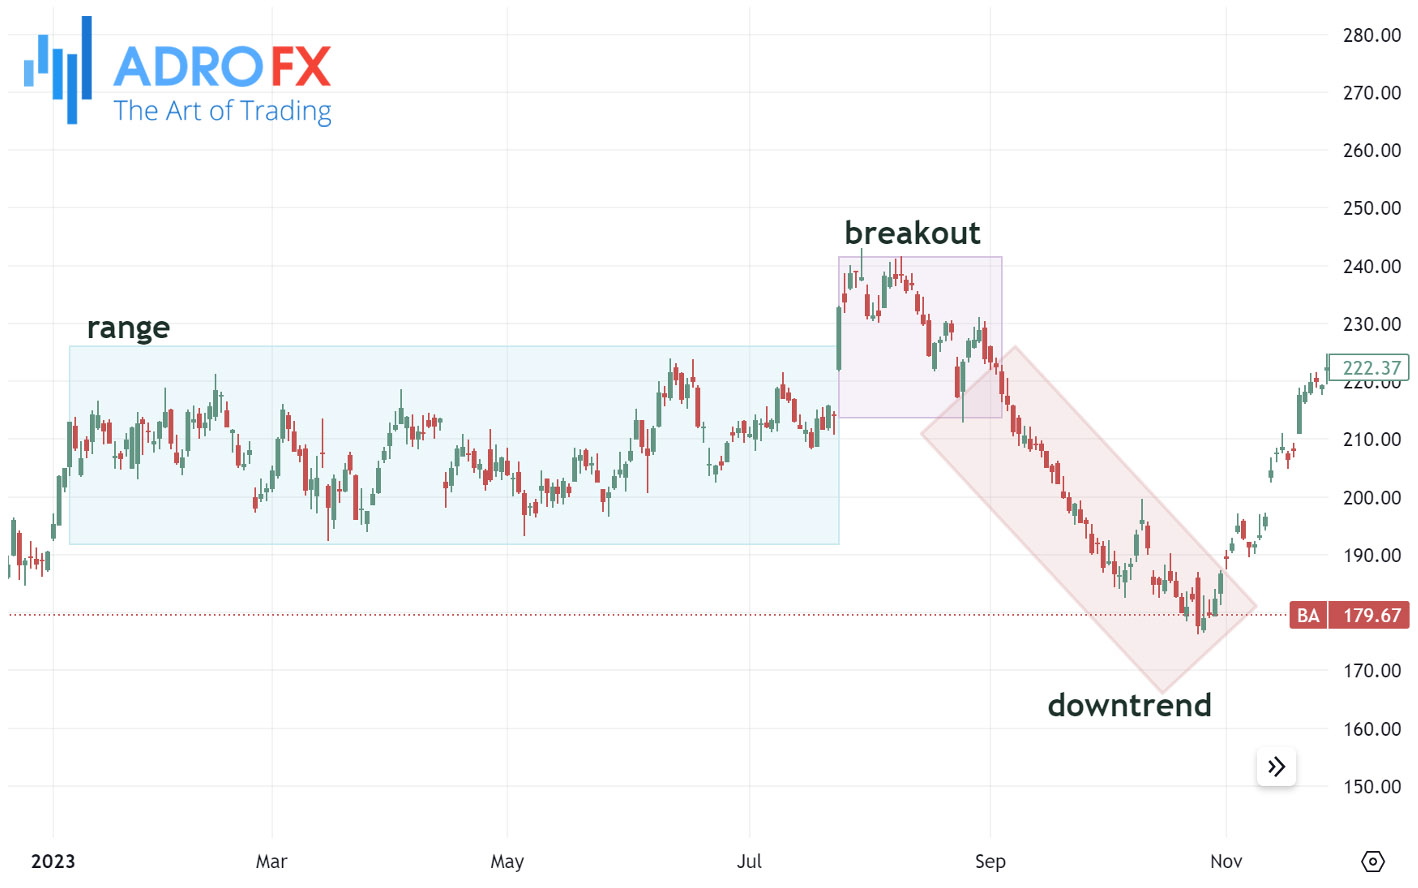
A breakout occurs when the price moves above a downtrend line or below an uptrend line, signaling a potential shift in market direction. Breakouts are often accompanied by increased volume, indicating stronger market interest and confirming the new trend direction. Traders typically look for a sustained move beyond the trend line to confirm a breakout, as this reduces the likelihood of a false signal.
Reversals
Trend reversals happen when the price breaks through a well-established trend line, suggesting a change in market sentiment. For instance, if the price breaks below an uptrend line, it could indicate the start of a downtrend, and vice versa. Identifying trend reversals early allows traders to adjust their positions accordingly, either by exiting current trades or entering new ones in the direction of the new trend.
Fakeouts
Fakeouts, or false breakouts, occur when the price momentarily breaks through a trend line but quickly reverses back within the trend, misleading traders into believing a trend change has occurred. To differentiate fakeouts from true breakouts, consider the following:
- Volume Confirmation
True breakouts are usually supported by high trading volume. Low volume breakouts are more likely to be fakeouts.
- Wait for Confirmation
Avoid acting on the initial breakout. Wait for the price to sustain its move beyond the trend line for a few periods (candles) before taking action.
- Use Multiple Time Frames
Analyze the breakout on multiple time frames to gain a clearer picture of its validity. A breakout on a shorter time frame confirmed by a longer time frame adds reliability.
By understanding how to draw and interpret trending lines effectively, traders can enhance their ability to predict market movements and make more informed trading decisions.
Also read: Taming False Breakouts: Proven Methods For Traders
Using Trending Lines in Trading Strategies
Trend Following
Trend following strategies aim to capitalize on the continuation of an established trend. By using trending lines, traders can identify the direction of the prevailing trend and enter trades in the same direction. Here are a few key components of trend following strategies:
- Entry Points
Traders look for opportunities to enter the market when the price pulls back to a trend line in an uptrend or rallies to a trend line in a downtrend. These points often provide favorable risk-reward ratios.
- Trailing Stops
To maximize profits, traders can use trailing stops, which are adjusted as the trend continues in their favor. This helps lock in gains while allowing the trade to run as long as the trend persists.
- Exit Strategies
Trend followers typically exit their positions when the price breaks through the trend line, signaling a potential trend reversal. By following the trend, traders aim to capture significant price movements and reduce the impact of market noise.
Also read: The Ultimate Beginner’s Guide To Trend Trading
Contrarian Strategies
Contrarian strategies involve betting against the prevailing trend, anticipating a reversal. Trending lines play a crucial role in identifying potential reversal points:
Contrarian traders look for overextended trends where the price has moved too far from the trend line. Overbought conditions in an uptrend or oversold conditions in a downtrend can signal potential reversals.
- Divergences
Contrarians often look for divergences between the price and other indicators, such as the Relative Strength Index (RSI) or Moving Average Convergence Divergence (MACD). When the price forms higher highs while the indicator forms lower highs (or vice versa), it suggests weakening momentum and a possible reversal.
- Entry Points
Contrarian traders enter trades when the price breaks through the trend line, confirming a reversal. They often use tight Stop Losses to manage risk, as counter-trend trades can be riskier.
Combination with Other Indicators
Using trending lines in conjunction with other technical indicators can create more robust trading strategies, enhancing the accuracy of trade signals and improving overall performance:
- Moving Averages
Combining trending lines with moving averages can help confirm trend direction and strength. For example, if the price is above both the uptrend line and a moving average, it strengthens the bullish trend signal. Conversely, if the price breaks below both the downtrend line and a moving average, it strengthens the bearish trend signal.
- RSI (Relative Strength Index)
RSI measures the speed and change of price movements. When used with trending lines, RSI can help identify overbought or oversold conditions. For instance, in an uptrend, if the price is near the trend line and RSI indicates oversold conditions, it could be a good buying opportunity.
- MACD (Moving Average Convergence Divergence)
MACD helps identify changes in the strength, direction, momentum, and duration of a trend. When combined with trending lines, MACD can confirm trend reversals. For example, if the price breaks above a downtrend line and MACD shows a bullish crossover, it signals a stronger buy confirmation.
- Volume
Analyzing volume alongside trending lines provides insight into the strength of a trend. High volume during a breakout from a trend line indicates strong market interest and increases the likelihood of a true breakout. Low volume suggests a potential fakeout.
By integrating trending lines with these indicators, traders can develop more comprehensive trading strategies that account for multiple aspects of market behavior, ultimately leading to better-informed trading decisions and improved outcomes.
Common Mistakes to Avoid
Overfitting
One of the most common mistakes traders make is overfitting trending lines to past data. Overfitting occurs when a trader adjusts a trend line to match historical price movements too closely, making the line appear accurate in hindsight but less reliable for future predictions. To avoid overfitting:
- Use Significant Points
Draw trend lines using significant highs and lows that reflect meaningful price action rather than minor fluctuations.
- Stick to Basics
Keep trend lines simple and straightforward. Avoid adding multiple lines that overly complicate the chart and provide little additional value.
- Test Consistency
Ensure that your trend lines hold up across different time frames and market conditions. A well-drawn trend line should be robust enough to be relevant beyond just the immediate historical data.
Ignoring Fundamentals
While technical analysis, including trend lines, is crucial for understanding price movements, ignoring fundamental analysis can lead to incomplete decision-making. Fundamental analysis evaluates the intrinsic value of an asset based on factors such as economic indicators, company performance, and geopolitical events. To integrate fundamentals effectively:
- Balance Both Approaches
Combine technical analysis with fundamental insights to form a comprehensive view of the market. For instance, if a trend line suggests a buying opportunity, verify that the asset's fundamentals also support a bullish outlook.
- Stay Informed
Keep up with relevant news and economic reports that could impact the asset you are trading. Understanding the broader market context helps validate technical signals.
- Use Earnings and Announcements
Pay attention to company earnings reports, product launches, and other significant announcements that can cause price movements. These events can either reinforce or contradict what the trend lines indicate.
Misinterpreting Data
Misinterpreting data is a common pitfall that can lead to poor trading decisions. This includes misunderstanding the significance of trend line breaks, false signals, and noise within the data. To avoid misinterpretation:
- Understand Breakouts and Fakeouts
Recognize the difference between genuine breakouts and false breakouts (fakeouts). Genuine breakouts are often accompanied by increased volume and momentum, while fakeouts may occur on low volume and quickly reverse direction. - Context Matters
Always consider the broader market context. A trend line break might signal a trend reversal, but if it occurs during a period of low liquidity or unusual market conditions, it might be less reliable. - Use Confirming Indicators
Don’t rely solely on trend lines. Use additional technical indicators, such as moving averages, RSI, or MACD, to confirm signals. This multi-faceted approach can reduce the likelihood of acting on false signals. - Avoid Biases
Be aware of cognitive biases that can affect your interpretation. For example, confirmation bias might lead you to see only the data that supports your existing beliefs. Strive for objectivity and be open to different interpretations.
By being mindful of these common mistakes and adopting a balanced, informed approach, traders can enhance the reliability of their trend line analysis and make more sound trading decisions.
Conclusion
Trending lines are a cornerstone of technical analysis, providing traders with a powerful tool to visualize and interpret market trends. By mastering the art of drawing and analyzing trending lines, traders can identify key market movements, make informed trading decisions, and develop effective strategies that align with the prevailing market direction. Whether following trends, anticipating reversals, or combining trending lines with other technical indicators, understanding how to use these lines can significantly enhance trading performance.
In this guide, we've explored the essential aspects of trending lines, from their definition and types to practical application in trading strategies. We’ve also highlighted common mistakes to avoid, emphasizing the importance of balanced analysis that incorporates both technical and fundamental perspectives. By adhering to best practices and maintaining an objective approach, traders can leverage trending lines to their advantage, navigating the complexities of financial markets with greater confidence and precision.
As you continue to refine your technical analysis skills, remember that trending lines are just one piece of the puzzle. Integrating them with a comprehensive trading plan, ongoing education, and disciplined execution will pave the way for long-term success in trading.

About AdroFx
Established in 2018, AdroFx is known for its high technology and its ability to deliver high-quality brokerage services in more than 200 countries around the world. AdroFx makes every effort to keep its customers satisfied and to meet all the trading needs of any trader. With the five types of trading accounts, we have all it takes to fit any traders` needs and styles. The company provides access to 115+ trading instruments, including currencies, metals, stocks, and cryptocurrencies, which make it possible to make the most out of trading on the financial markets. Considering all the above, AdroFx is the perfect variant for anyone who doesn't settle for less than the best.
Related Articles


Latest updates
Latest updates


Technical Analysis
Latest updates


