Mastering Scalping: A Swift Guide to Benefitting from Short-Term Chart Patterns in Financial Markets
In the dynamic realm of financial markets, traders employ various strategies to navigate the complexities of buying and selling assets. One such strategy, known as scalping, distinguishes itself as a rapid and decisive approach to day trading. Whether executed manually or through automation using trading robots, scalping involves swift transactions within mere minutes. The primary goal for scalpers is not to amass substantial returns per trade but rather to accumulate modest gains through multiple transactions each day. This article explores the intricacies of scalping, highlighting its divergence from other trading strategies and its reliance on chart patterns over fundamental market indicators. Additionally, we delve into the significance of price action analysis and the seamless integration of chart patterns into the scalping methodology.
How Scalping Works
Scalping stands out as one of the numerous day trading strategies employed in the financial market, involving the rapid buying and selling of financial assets within a span of a few minutes. This approach can be executed manually or through automation. Many scalpers now utilize trading robots, also known as expert advisors, for identifying opportunities and executing orders.
The primary objective of a scalper is not to achieve substantial gains per trade but rather to accumulate modest earnings through multiple trades each day. For instance, if the goal is to secure a $50 return per trade ten times a day, the cumulative gain would amount to approximately $500.
Scalping diverges from other trading strategies such as swing trading and position trading. One notable distinction is the limited attention paid by scalpers to market fundamentals like news and economic data. Instead, they concentrate on chart patterns to pinpoint market opportunities. Additionally, scalpers rely on extremely short-term charts, often utilizing 1-minute charts for day trading, as previously discussed in a recent article.
Understanding Price Action
Price action refers to the overall chart pattern of a financial asset, constituting an analysis process where traders make decisions based on the visual appearance of a chart. This form of technical analysis doesn't rely on technical indicators like moving averages and the Relative Strength Index (RSI), making it versatile for traders of all types. Long-term traders leverage price action to identify buying or shorting opportunities, with certain chart patterns like the cup and handle specifically tailored for those with a long-term perspective.
Incorporating Chart Patterns into Scalping
Integrating chart patterns into scalping is a straightforward process involving the identification of patterns and subsequent trade placement. In day trading, two primary types of charts exist reversal and continuation.
Reversal chart patterns signal an impending change in the asset's direction, while continuation patterns indicate that the current bullish or bearish trend will persist.
These patterns fall into two categories: candlestick patterns (such as doji, harami, shooting star, and morning star) and chart patterns requiring more time to form, involving multiple candles. Utilizing these patterns in trading is relatively uncomplicated - identify the pattern on a short-term chart, interpret it, and execute trades accordingly.
Examples of Chart Patterns in Scalping
Flags
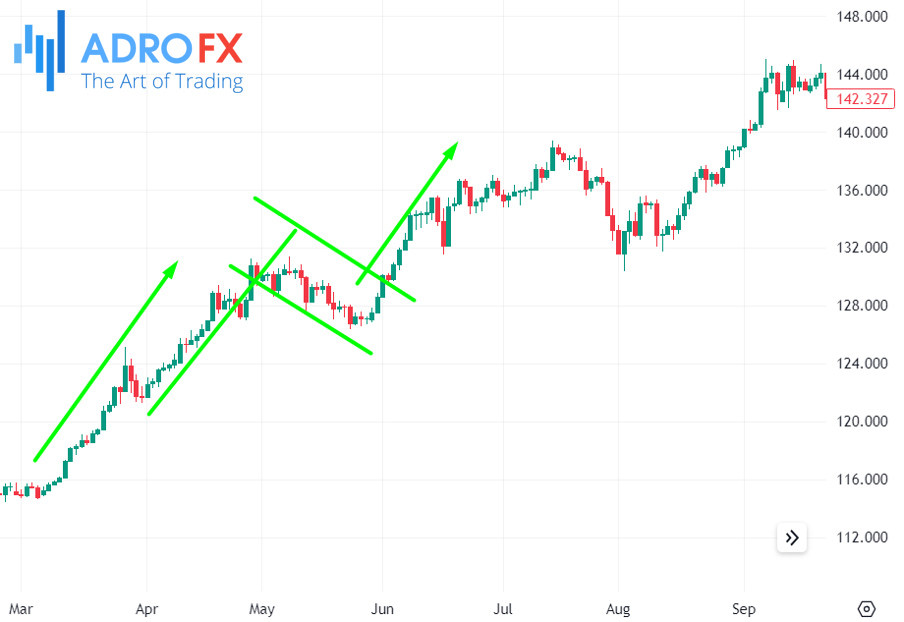
Flag patterns, simple continuation patterns, occur when an asset is either rising or falling, signifying a brief pause between these trends. Comprising a "pole" and a "flag," bullish and bearish flags suggest that the chart pattern will persist in the current direction. An example of a bullish flag pattern is illustrated below, demonstrating how flags emerge when existing trends take a temporary breather.
Doji
A doji, a candlestick pattern, forms when an asset's price closes at its opening level, featuring an extremely small body and short upper and lower shadows. Various doji patterns exist, including gravestone, long-legged doji, and dragonfly doji, each signaling potential reversals. In the chart below, Meta Platform's reversals are identified following the formation of a doji pattern.
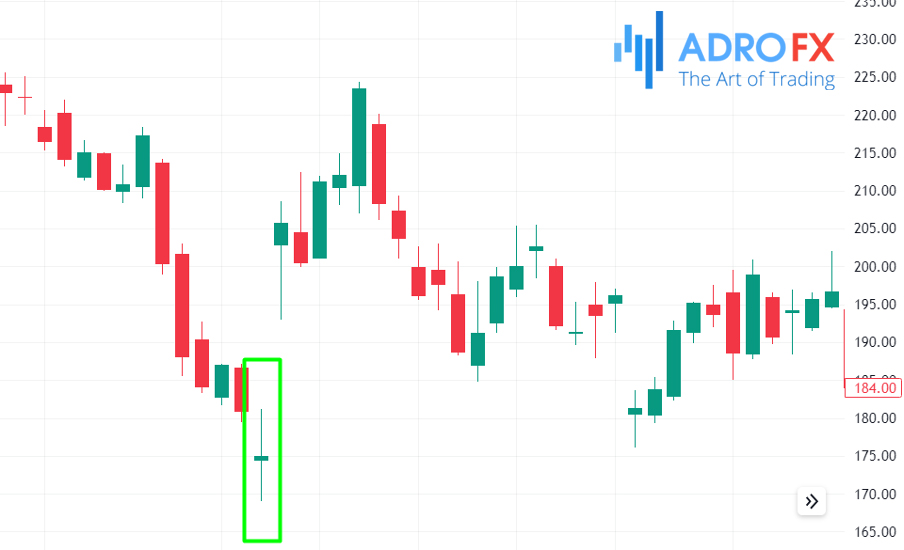
After recognizing a doji, a scalper can execute a bullish or bearish trade based on the preceding chart pattern.
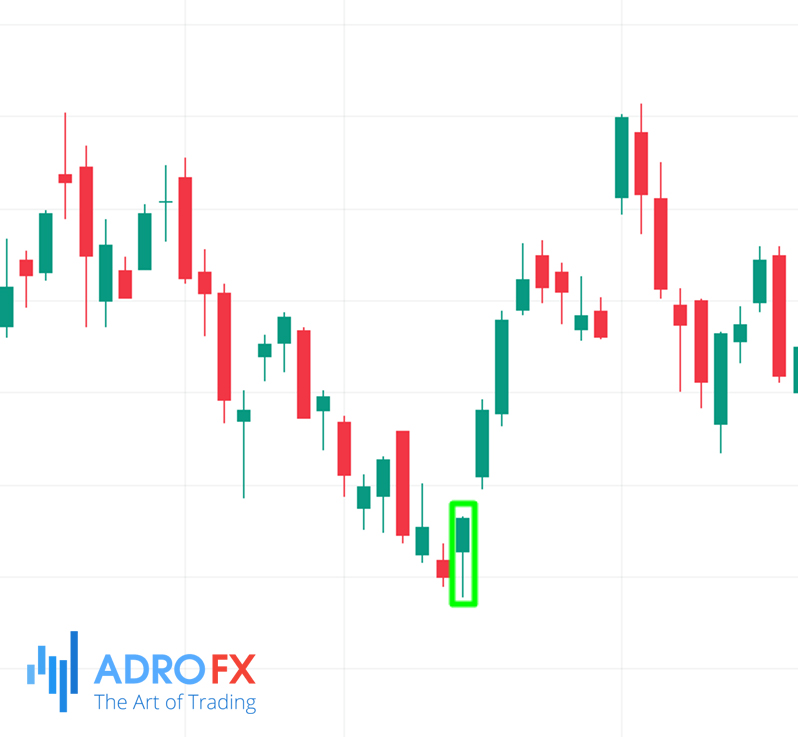
Engulfing Pattern
The engulfing pattern, a two-candle chart pattern, occurs when a prevailing upward or downward trend shows signs of fading. This pattern involves a smaller candlestick followed by a larger one that entirely engulfs it. Following this occurrence, a scalper can initiate a trade in the opposite direction. The chart below illustrates an example, where Tesla shares form a small engulfing pattern, followed by a bullish breakout.
Double-Top Pattern
The double-top pattern, a well-known reversal pattern present in various charts, typically indicates an imminent reversal in the direction of a financial asset. Recognizable by its flat top and neckline, traders can open a trade and set a take-profit at the neckline. In the example below, Tesla forms a double-top pattern at $195, with the neckline set at $190. A scalper can then open a bearish trade, placing a take-profit at $193.
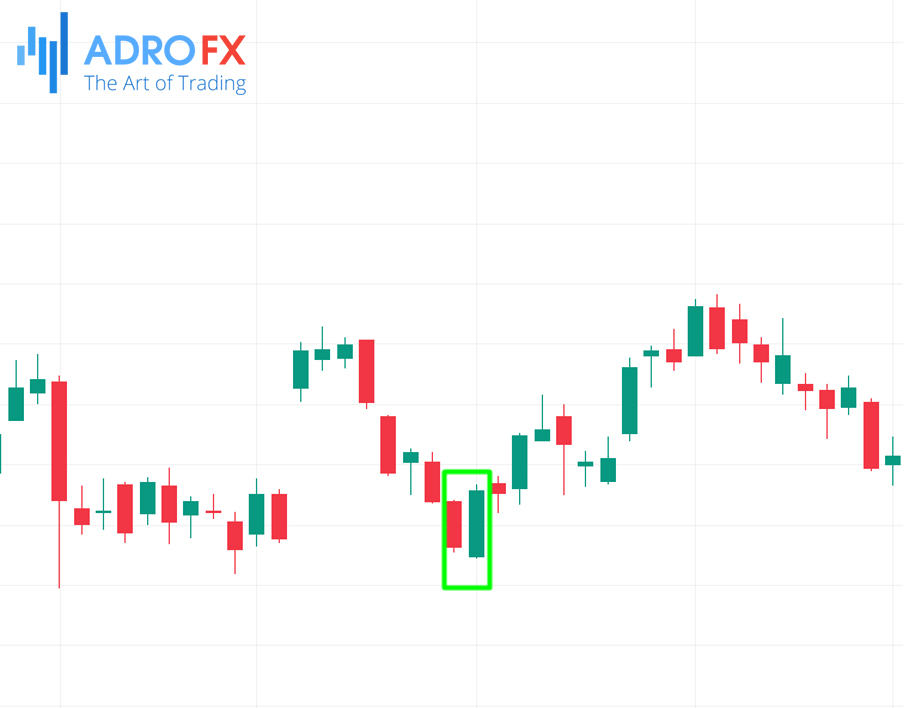
Morning Star Pattern
The morning star pattern bears a resemblance to a doji pattern and is a small pattern occurring at the bottom of a trend. Its occurrence signals an impending reversal in the asset's price in the near term. The chart below exemplifies a small morning star pattern followed by a subsequent reversal.
Conclusion
All in all, the world of trading is multifaceted, offering an array of strategies to suit different preferences. Scalping emerges as a nuanced and agile technique, where traders prioritize quick, incremental gains over prolonged pursuits. By steering clear of extensive analyses of market fundamentals, scalpers focus on the visual cues presented by chart patterns and leverage short-term charts for decisive actions. The incorporation of price action analysis further underscores the adaptability of this strategy, allowing traders to make informed decisions without relying on traditional technical indicators. As exemplified by various chart patterns in scalping, from flags and doji to engulfing and double-top patterns, the art of scalping relies on astute pattern recognition and timely execution. Ultimately, mastering scalping requires a keen understanding of market dynamics, pattern intricacies, and the art of swift decision-making.

About AdroFx
Established in 2018, AdroFx is known for its high technology and its ability to deliver high-quality brokerage services in more than 200 countries around the world. AdroFx makes every effort to keep its customers satisfied and to meet all the trading needs of any trader. With the five types of trading accounts, we have all it takes to fit any traders` needs and styles. The company provides access to 115+ trading instruments, including currencies, metals, stocks, and cryptocurrencies, which make it possible to make the most out of trading on the financial markets. Considering all the above, AdroFx is the perfect variant for anyone who doesn't settle for less than the best.
Related Articles
Latest updates
Latest updates


Technical Analysis
Latest updates


