Harami Candlestick – Bullish & Bearish Harami Pattern

Harami candlestick and/or Harami Cross is a strong candlestick pattern.
Harami means "pregnant" in Japanese. And it is true, if you look at these two-candle formations, you can see that the first candle is much larger than the second, as if the mother is carrying a child.
Some traders consider the Harami candlestick and Harami Cross a single candlestick pattern, while others subdivide it into two, or even three, different types.
It is difficult to say which side is right in this case, let everyone consider these patterns in a convenient way for their trading strategy. We will consider the Harami based on the existence of two patterns "candle" and "cross" for the convenience of mastering the theoretical foundations.
What is a Harami Candlestick and How to Identify it Precisely?
A candlestick pattern is a formation of two Japanese candles, both reversal and confirming the further movement, signaling a reversal of price movement, or its continuation after a long sideways movement (flat).
In simple words, it is two consecutive candlesticks (first big, second small) that can signal either a trend reversal or a sideways flat and further continuation of the trend after it.
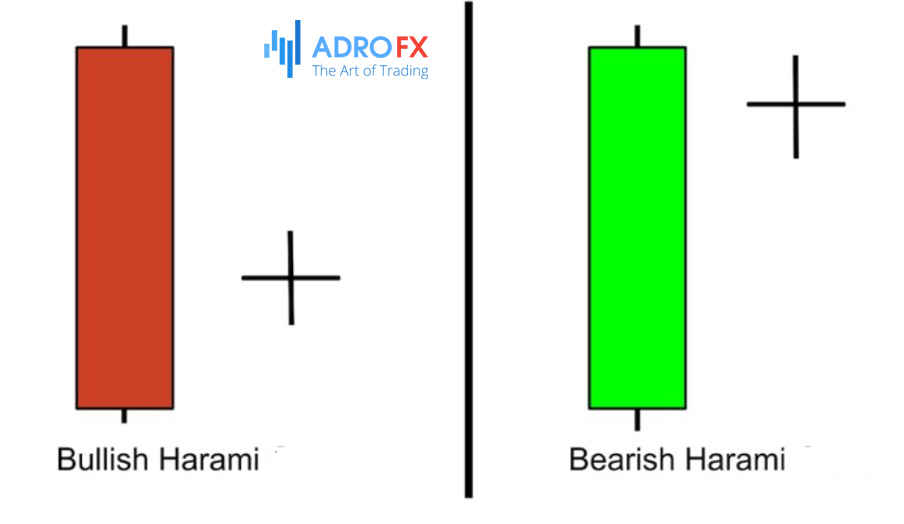
In graphical terms, the pattern Harami candlestick represents two consecutive candles, the first large (mother), and the second small (baby). Most often, they are different colors, but a variant with the same candlestick coloring is also possible. The long body of the first candlestick always covers the short body of the second.
Depending on the location of the second small candle, the pattern can give two different, but in both cases, strong signals.
If the body of a small candle (child) is located closer to the center of the body of a long candle (mother), the signals of the pattern will have a reversal nature. As a rule, such formations appear near significant lines (support/resistance levels).
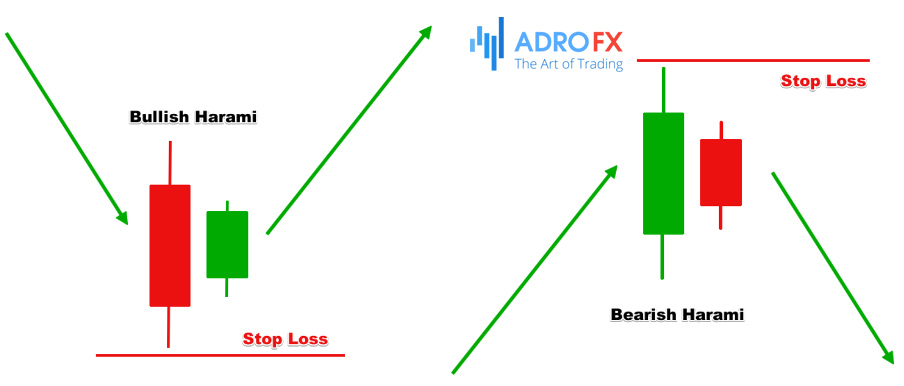
In this case, when the reversal pattern appears on the upward price movement (bearish Harami candlestick), near resistance levels, the trader should consider opening a short position.
Even though the pattern signal is strong, it is recommended to enter the market during the formation of the next candle after the pattern, if it is dark in color (descending candle).
The occurrence of the reversal pattern in a descending trend gives a signal that the growth of quotes is coming - the trader should consider the possibility of opening a long position.
You can also enter the market during the confirmation of the formation signal (bullish Harami candle) followed by a light-colored candle (uptrend candle).
Let's now consider a flattened version of the Harami candlestick pattern. Such a pattern is often called "high-price harami" in an uptrend and "low-price Harami" when it appears in a falling market.
If the short candle (child) is located near the closing price of a long candle (mother) in a rising market, then the appearance of the model in a rising market, formed a prolonged flat, followed by the continuation of the upward price movement - the bullish Harami candlestick or high-price Harami.
On a declining price chart, the Harami candlestick pattern similarly signals a flat movement followed by a breakout of the resistance line downwards, that is, with the preservation of the original trend. This pattern can be safely classified as a bearish Harami candlestick or low-price Harami.
When a flat pattern appears, the trader should consider opening long-term positions in the direction of the price movement. You can try to average an open position when the price will be inside the channel, or trade in the channel with a high probability of price exit in the previously passed direction.
Sometimes one can see a pattern on the chart, in which the second candle does not have a body, i.e. a Doji. Logically, in this case, a refinement is made, for example - Morning Star Doji.
With the Harami Candle, the situation is different, the model with the second Doji candlestick is a separate model, and is called Harami Cross.
In most cases, the presence of Doji strengthens the signal of the pattern.
Harami Cross is the strongest reversal pattern. When the formation of the figure during an uptrend, it is recommended to open a short position - the pattern is classified as a bearish Harami Cross. It, on the contrary, will give a buy signal during a falling market: bullish Harami Cross.
It is possible that in the Harami Cross pattern, the second candle (baby Doji) will be located near the closing price of the first long candle (mother). It is known that the Harami candlestick pattern in this case signals the onset of a flat and the continuation of the trend, it would be too complacent to project this pattern onto the Harami Cross. When this type of formation appears, traders are advised to refrain from entering the market.
How to Trade Using the Harami Pattern
When trading on a candlestick pattern, you should primarily pay attention to the time frame of the chart. Like all the Japanese candlestick patterns, the reliability of the Harami signals is mainly manifested in medium and high time frames (M30, H4, and higher). Additional reliability can be given by the close location to the local maximums and significant lines (trend, support/resistance, Fibonacci, etc.).
The simplest way to trade on the signals of the Harami candlestick or Harami Cross is the following strategy:
When identifying a pattern in an uptrend market, wait for the second candle of the pattern to complete and open a short position on the market. When the price of the asset reaches the required level of profitability, exit the trade. If the pattern in question appears in a falling market, similarly open a long position and also exit the trade when the profit level is reached. To avoid risks, at a reversal of the price movement, it is necessary to ensure the open orders by placing Stop Loss. Limit losses can be placed at the price maximum of the first long (mother) candle or a distance of 10-30 points from it.
To reduce the number of false signals, many traders complicate the above trading strategy - the opening of a position is carried out subject to confirmation of the model by the color of the body of the following figure of a candle. Accordingly, the reversal signal to change the uptrend to a downward trend, the investor expects the appearance of a dark candle after the pattern (falling candle), and vice versa, the change of the downtrend to an upward movement expects a light (rising) candle.
Several trading options are possible when a Harami candlestick or high/low price Harami pattern appears on the chart.
When the high-price Harami pattern appears, the trader shouldn't rush to open a position and to wait for the beginning of the formation of a sideways movement. Having determined the borders of the appeared channel, it is necessary to enter the market with a long position near the lower border of the channel and place Stop Loss at a distance of 30-40 points from the entry price. The position should be closed when the price reaches a specified level of profitability, or when it approaches important lines (resistance, trend, Fibonacci, etc.). It is important to note that the reference point for closing a position should not be the upper limit of the channel (resistance line), as the considered model high-price Harami assumes continuation of the uptrend after the price leaves the channel range.
When trading the low-price Harami signal, one must follow a similar tactic, however, the position, in this case, will be opened at the upper limit of the channel and to sell. Exit from the market, respectively, will be carried out when the price reaches the local minimums and important lines (support, trend, or Fibonacci lines). In this case, when making a decision to close the trade, it is advised to skip the signal of price crossing the lower boundary of the channel (support line). This is necessary because after it is crossed, according to the low-price Harami pattern, the downtrend will continue.
Another option for trading profitably when you have a high/low-price Harami pattern is trading inside the channel.
The advantage in this one will be the knowledge of the price movement direction after the end of the flat (according to the signals of the pattern, the trend will continue). This can significantly reduce the risks of trading - positions will be opened inside the channel, only in the trend direction.
So, when a flat appears on the chart after the high-price Harami pattern, the trader should open a long position near the lower border of the channel. When the price crosses the upper border of the channel (from the bottom up), the position should be held further, and when returning to it, exit the trade.
After the price reaches the lower limit of the channel, similarly re-enter the market and close the position. Thus it is possible to conduct intra-channel trading until the flat ends - the price overcomes the upper border of the channel and will continue to grow.
When identifying the low-price Harami flat pattern on the chart, the trade is carried out in the same way, but another way around.
All of these strategies can be complemented by the simplest technical indicator (RSI, Alligator, MACD, Volumes) to provide more reliable trading signals.
Specific Features of Trading Harami Patterns
When trading on Harami patterns, a trader should take into account a number of features for the correct interpretation of incoming signals:
The most reliable signals of Harami patterns, appear on medium and high time frames (M30, H1, H4, and more);
The appearance of a Doji as the second short candle of the model greatly enhances the reliability of the signal;
When interpreting the pattern it should be taken into account that it is the opposite of the bullish engulfing. Do not confuse them;
The growth of trading volume during the formation of the second short candle considerably strengthens the signal of the formation;
In the ideal Harami pattern, the size of the second candle does not exceed ⅔ of the first, the shorter candle is smaller, the better, if the size of the "baby" candle is more than ⅔ of the "mother" candle, you should refrain from entering the market;
The validity of the pattern is confirmed by its location near important support/resistance levels, the signals of otherwise located patterns should not be taken into account;
Technical trend indicators are also a simple and reliable way to confirm a Harami pattern;
When you form a real Harami pattern, you can very often see oscillators moving out of overbought/oversold areas.
Conclusion
Japanese candlestick patterns Harami and Harami Cross, if interpreted correctly, can give fairly accurate signals for placing profitable trades. This allows them to create separate trading systems, or use them to supplement existing strategies to improve their profitability.
At the same time, it is necessary to take a very responsible approach to the evaluation of patterns on the chart, to the correctness of their definition, and the verification of their reliability.
It was explained above that it makes sense only to enter the market when a pattern is formed near strong price levels. It is important to understand that the Harami candlestick and the Harami Cross are not only reversal formations and can signal the transition to a flat with a subsequent continuation of the trend in the case of the formation of flat versions of the pattern - high-price Harami and low-price Harami.
Problems in determining the formation on the chart may arise because of the similarity of the Harami candlestick and the bullish engulfing. It is important to remember that these are different patterns with completely different types of trading signals.
Based on the foregoing, we can conclude that the trading system based on the signals of the Harami pattern and its derivatives has every chance of success.
However, the main condition for such success will be, in the first place, a high level of training of the trader in the application of candlestick analysis.
About AdroFx
Established in 2018, AdroFx is known for its high technology and its ability to deliver high-quality brokerage services in more than 200 countries around the world. AdroFx makes every effort to keep its customers satisfied and to meet all the trading needs of any trader. With the five types of trading accounts, we have all it takes to fit any traders` needs and styles. The company provides access to 115+ trading instruments, including currencies, metals, stocks, and cryptocurrencies, which make it possible to make the most out of trading on the financial markets. Considering all the above, AdroFx is the perfect variant for anyone who doesn't settle for less than the best. 
Related Articles


Latest updates
Latest updates


Technical Analysis
Latest updates


