Busy Week for Investors: CPI, Earnings & Fed Minutes
Key events:
- USA – EIA Short-Term Energy Outlook
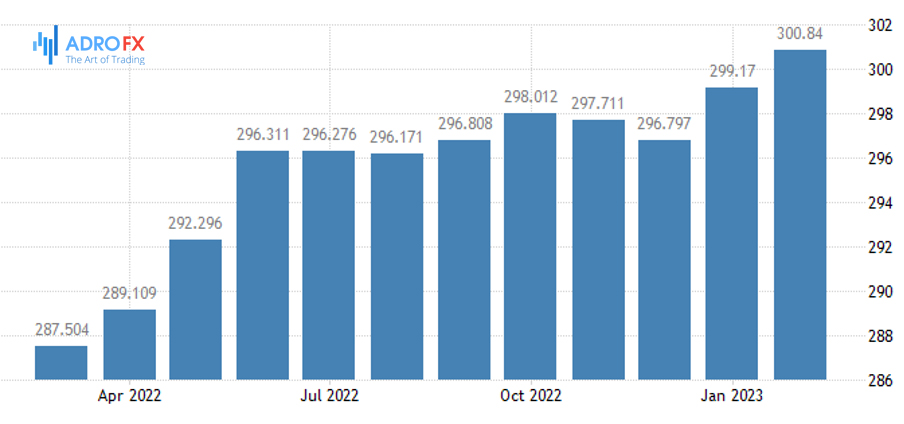
This week, investors have a lot of economic data to consider, including the upcoming release of March's consumer price index and producer price index on Wednesday and Thursday, respectively. Based on these reports, it will become clearer whether the Fed will continue raising interest rates or halt its campaign. Although most investors expect the Fed to continue tightening its monetary policy, the possibility of a pause should not be dismissed.
The US labor market data released on Friday was very strong and this week the focus will shift to CPI. The likelihood of an interest rate hike on May 25 has increased after the strong jobs report, so there's not much else needed from the CPI now. The core indicator only needs to match expectations to prejudge a rate hike.
We are talking about core inflation because that's what matters right now - of the two indicators, it will probably be the core indicator that is higher. The core CPI for March is forecast to be 5.6% compared to 5.5% in February. Analysts have been fairly accurate in their forecasts for core CPI so far, so I don't expect much deviation from expectations. The data will be released on April 12.
Conditions for a 25 basis point rate hike have become more favorable given the low unemployment rate and the increasing share of the economically active population. Thus, the CPI is likely to confirm the likelihood of a rate hike in May, unless it comes in significantly below expectations.
After the jobs report, the odds of a rate hike jumped to 70%, with most Fed policymakers indicating that they believe a Fed Funds rate hike above 5% is necessary. If there are no more bank failures, I don't think the Fed will pause.
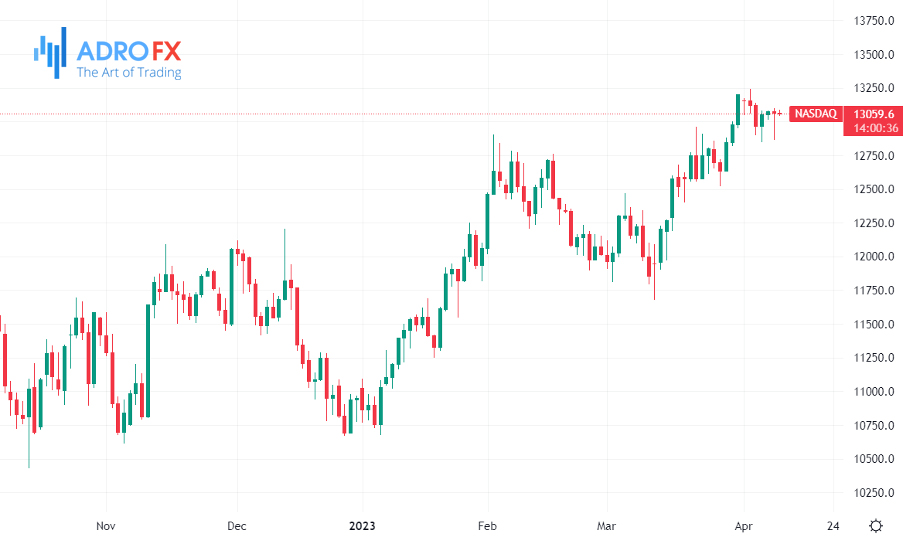
The NASDAQ Composite index is based entirely on declining real rates and if rates start rising again, the NASDAQ will probably decline. The chart below shows the inversion of the Nasdaq 100 relative to real 10-year Treasury yields, which is a convenient way to trace their correlation.
Moreover, later this week, the big banks are set to kick off their latest earnings reporting season.
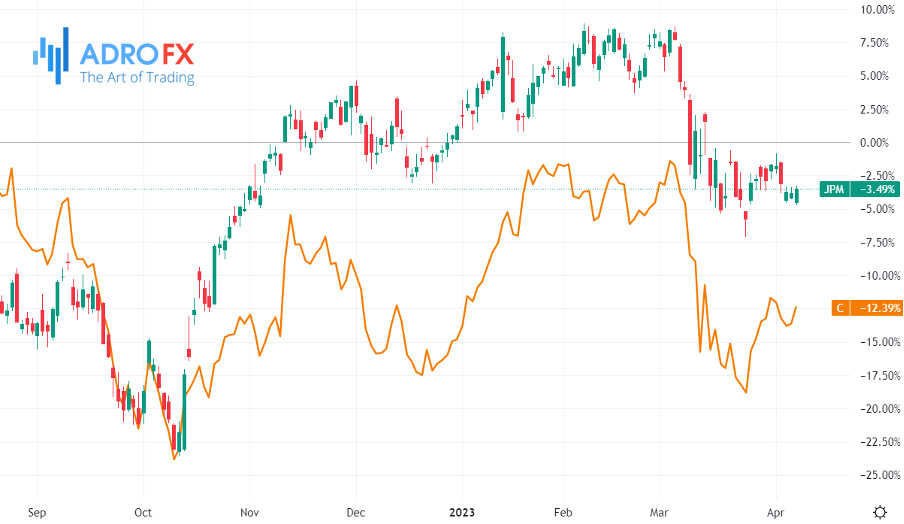
JPMorgan and Citigroup are due to report Friday, followed by Goldman Sachs, Morgan Stanley, and Bank of America next week.
The lion's share of the attention will likely be on the impact of last month's Silicon Valley bank collapse. That collapse sent shivers throughout the financial services industry, as investors especially feared the possibility of a widespread collapse of smaller regional lenders.
There has been some calm in the industry since then. But upcoming reports are likely to provide new insights into the magnitude of the impact of the recent turmoil.
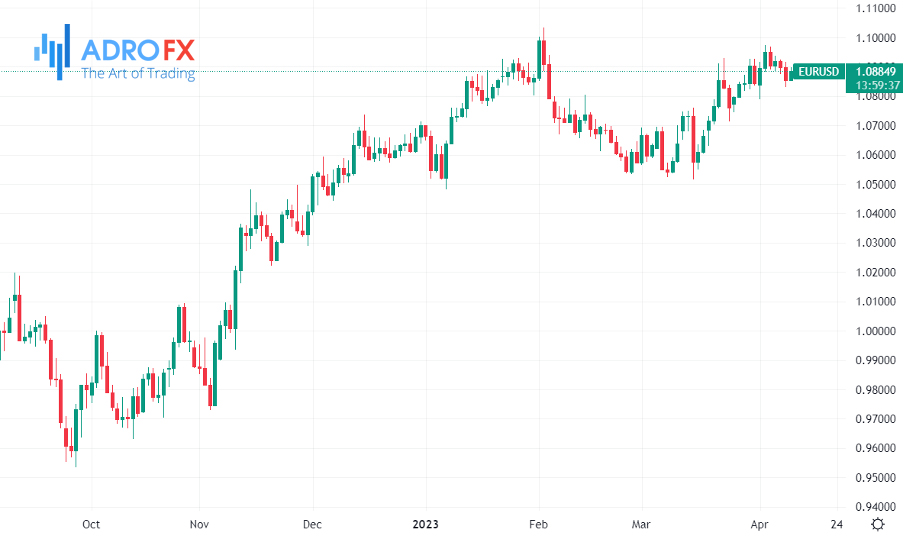
Yesterday the US dollar lost ground during early Monday trading. The EUR/USD pair reached a double peak before traders lost confidence, causing the euro to drop below Monday's opening and break through the 1.0885 support level. This level had acted as the pair's bottom multiple times this month and served as a barrier for a long-term rising trendline. Traders may now focus on 1.0822 and 1.0800 as the next potential downside targets.
After the release of the CPI data, the Federal Reserve is expected to publish the latest meeting minutes of the Federal Open Market Committee (FOMC).
Related Articles


Latest updates
Latest updates


Technical Analysis
Latest updates


