Single Candlestick Patterns: How to Read and Trade Them Effectively
More than 70% of retail traders rely on candlestick charts for their market analysis. These time-tested visual tools have been an essential part of trading for centuries, allowing traders to interpret market sentiment with ease. Whether you're trading stocks, forex, or crypto, candlestick patterns offer valuable clues about potential price reversals and trend continuations.
Unlike complex indicators that require extensive calculations, trading candlestick patterns are intuitive and easy to spot, making them ideal for traders of all experience levels. By studying these trading patterns, traders can anticipate market movements and refine their entry and exit strategies.
This article will focus on single candlestick patterns, a subset of candlestick trading that provides immediate insights into price momentum. These formations appear in isolation on a candlestick chart, yet they hold significant weight in predicting trend shifts. Understanding how to interpret these patterns can be a game-changer for any trader looking to improve decision-making and trade execution.
What Are Single Candlestick Patterns?
Single candlestick patterns are trading patterns formed by just one candlestick on a candlestick chart. Unlike multi-candle formations, which rely on multiple periods of price action, single candlestick patterns provide immediate and concise signals about potential market reversals or continuations.
Each candlestick pattern represents the battle between buyers and sellers within a specific time frame. The shape, color, and size of the candlestick can indicate whether bulls or bears have the upper hand. Traders who understand these nuances can use them to their advantage in candlestick trading, identifying key moments to enter or exit positions.
These patterns are particularly valuable for short-term traders who rely on quick signals to make informed decisions. They are also widely used in conjunction with other technical tools, such as support and resistance levels or trend lines, to improve accuracy.
By mastering single candlestick patterns, traders gain a deeper understanding of price action and market psychology. Whether it's a Doji signaling indecision or a Hammer hinting at a bullish reversal, these formations serve as essential building blocks for a solid candlestick trading strategy.
Also read: Learn to Make the Most Out of Reversal Candlestick Patterns: Key Insights and Strategies
Key Single Candlestick Patterns Every Trader Should Know
Mastering candlestick patterns is essential for traders looking to enhance their market analysis. Among these, single trading candlestick patterns provide some of the most straightforward yet powerful signals on a candlestick chart. These patterns can indicate market indecision, trend reversals, or strong momentum, helping traders make informed decisions. Below are some of the most important single trading patterns every trader should recognize:
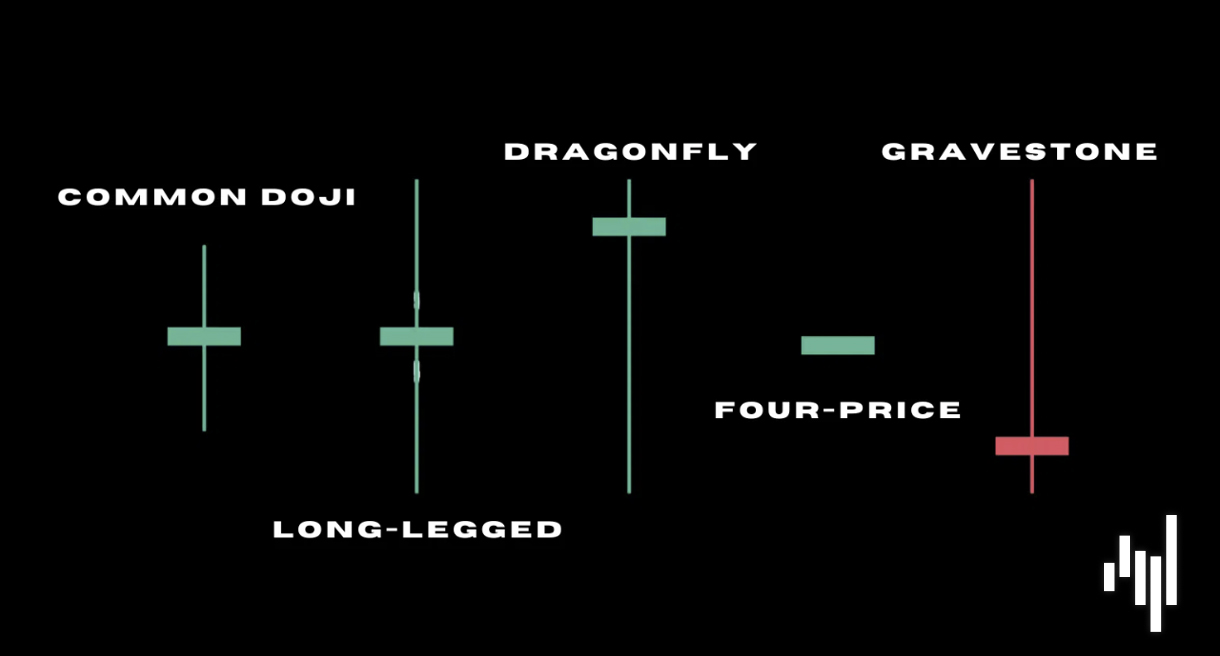
Doji
This pattern appears when the open and close prices are nearly identical, forming a small or non-existent body with long wicks on either side. A Doji signals market indecision, meaning buyers and sellers are at a stalemate. When found at the peak of an uptrend or the bottom of a downtrend, it can indicate a potential reversal.
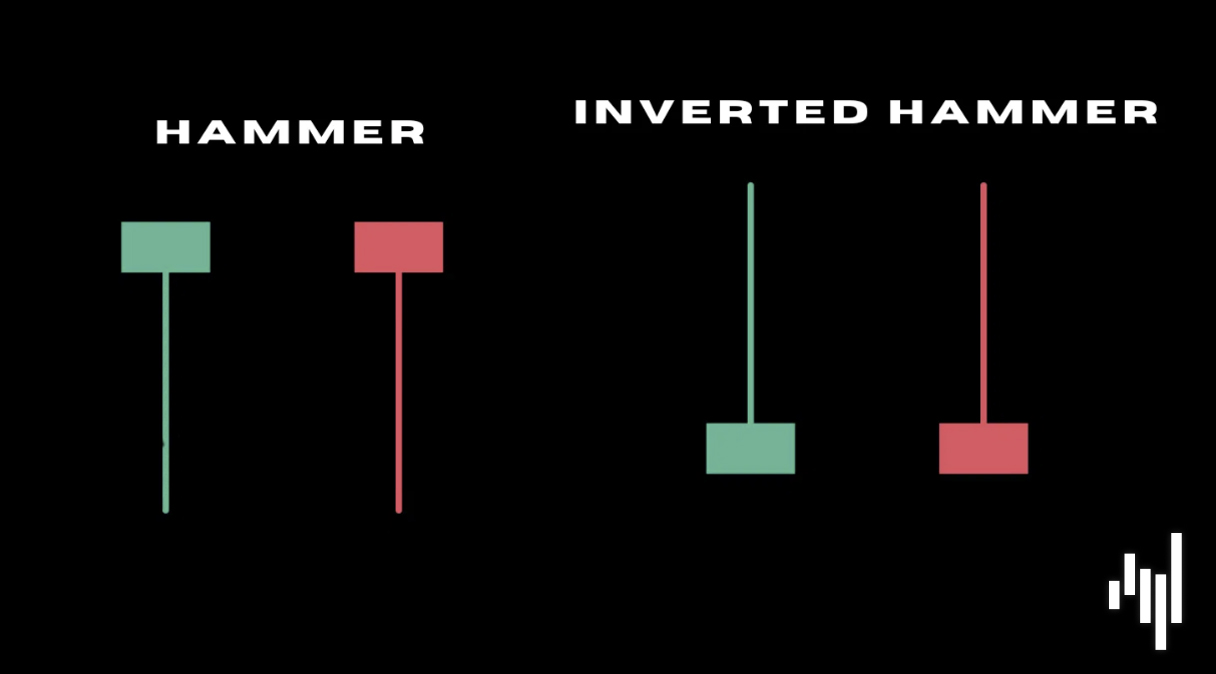
Hammer
The Hammer is a strong bullish reversal signal. It has a small body at the top and a long lower wick, indicating that sellers pushed the price lower before buyers regained control and drove it back up. This candlestick pattern is most effective when it appears at the end of a downtrend, suggesting a shift toward upward momentum.
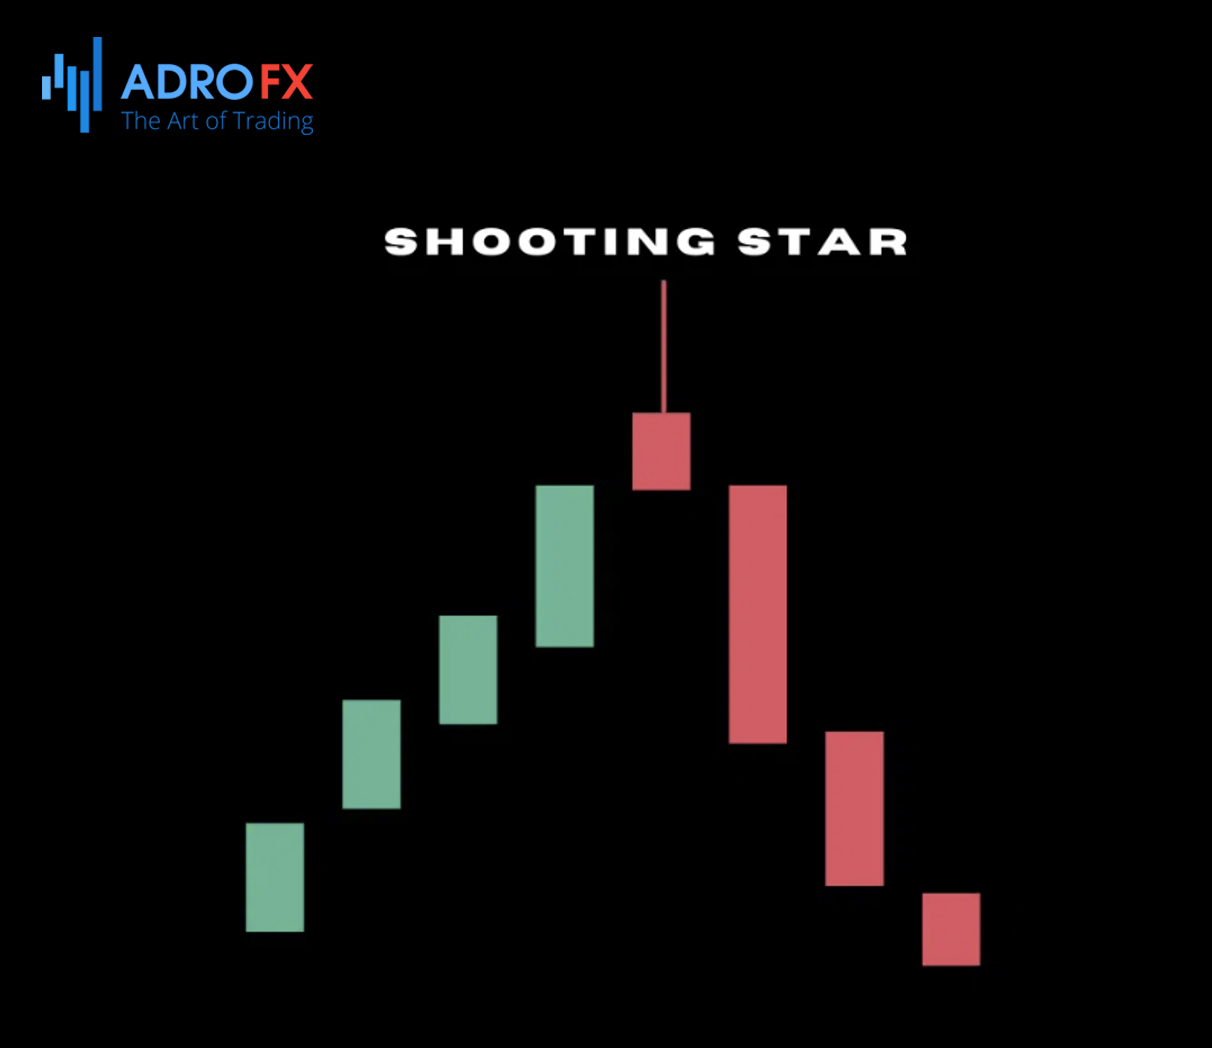
Shooting Star
The opposite of the Hammer, the Shooting Star is a bearish reversal signal. It has a small body at the bottom and a long upper wick, showing that buyers attempted to push prices higher but were overpowered by sellers. This pattern suggests that an uptrend may be losing steam, making it a warning sign for potential downturns.
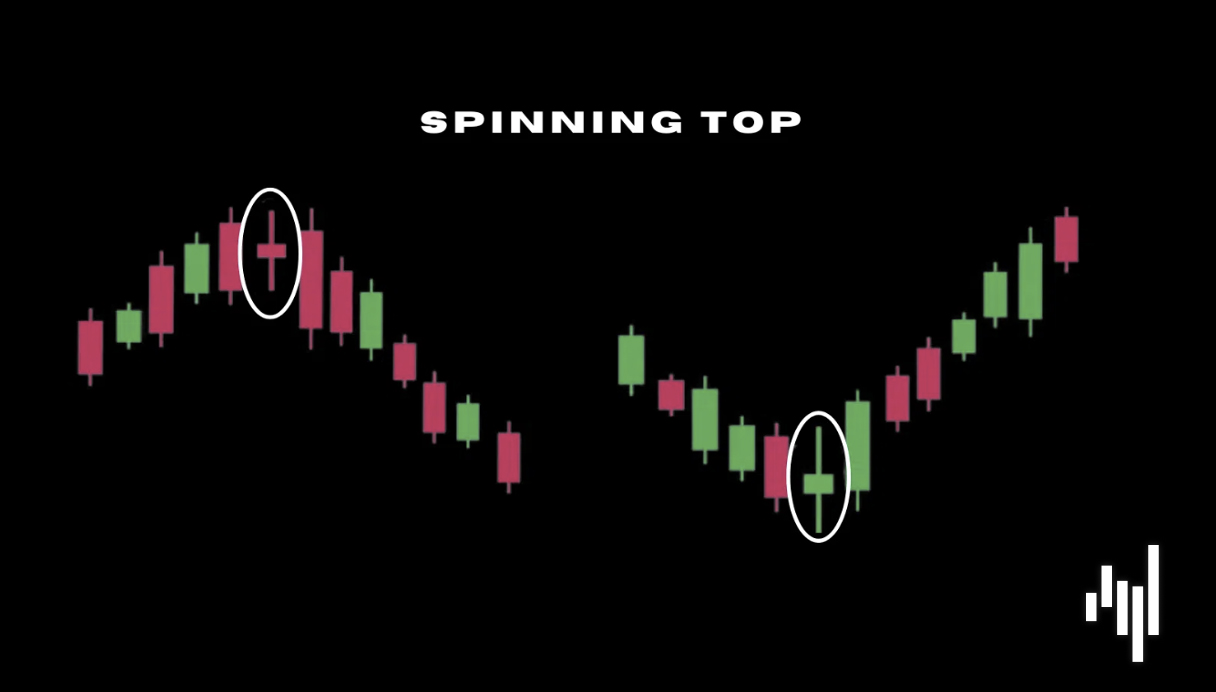
Spinning Top
A Spinning Top has a small body with long wicks on both sides, indicating market uncertainty. Neither buyers nor sellers are in control, which means a trend continuation or reversal is possible depending on the surrounding market conditions. Traders often wait for confirmation before making a move.
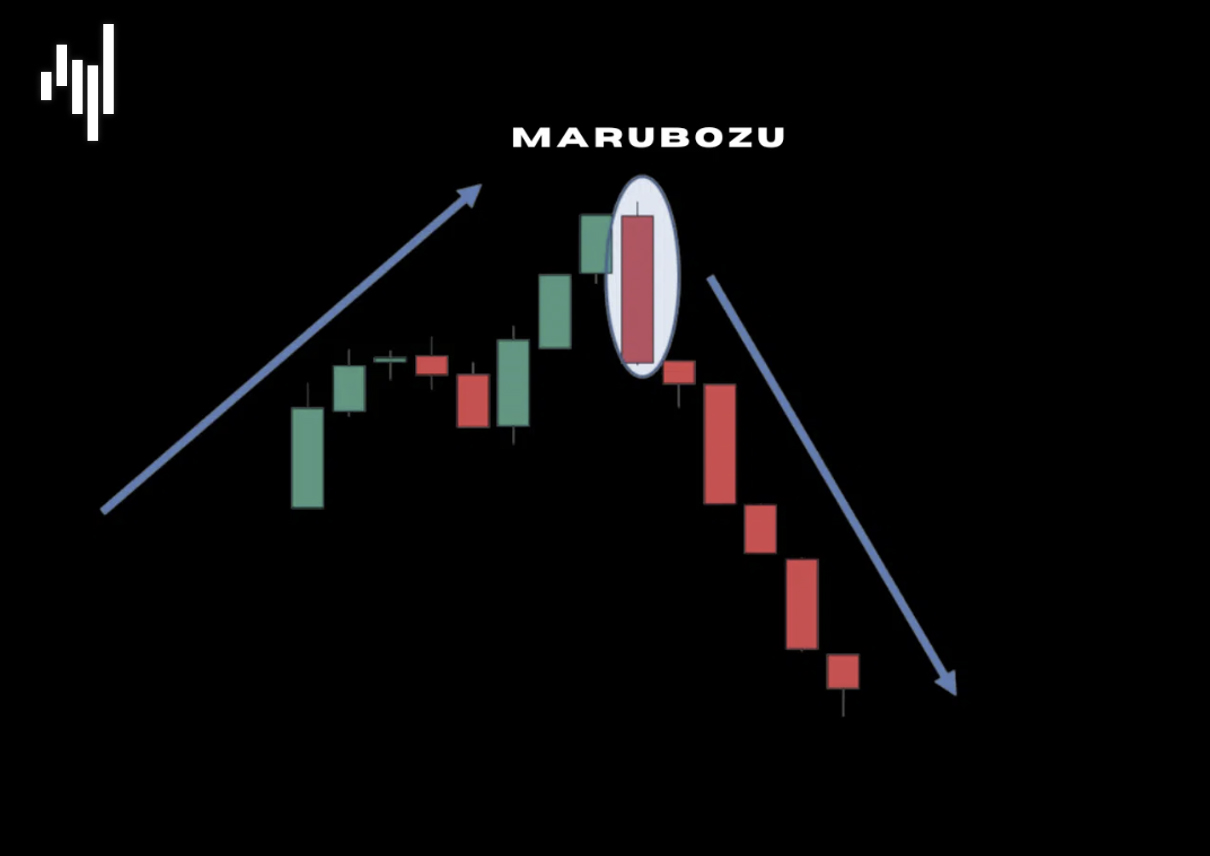
Marubozu
This is a strong continuation signal. A bullish Marubozu has no upper or lower wicks, meaning the price opened at its low and closed at its high, signaling strong buying pressure. A bearish Marubozu, on the other hand, shows the opposite, indicating dominant selling pressure. These candlestick trading signals suggest momentum is firmly in one direction.
Understanding these candlestick patterns can significantly improve a trader's ability to recognize key market shifts. However, using them in isolation isn’t always enough - combining them with other technical tools increases their reliability.
How to Trade Using Single Candlestick Patterns
Recognizing trading candlestick patterns is only half the battle - knowing how to apply them in a trading strategy is what truly makes them valuable. Here’s how traders can leverage single candlestick trading patterns for smarter entry and exit decisions:
Identifying Reversal and Continuation Signals
- When a Doji appears at the end of an uptrend, it may signal a bearish reversal, while a Hammer at the bottom of a downtrend suggests a bullish reversal.
- A Marubozu reinforces trend continuation, indicating strong market conviction in the direction of the trend.
Combining Patterns with Other Technical Indicators
- Moving Averages
If a Hammer appears near a 50-day moving average, confirming strong support, it reinforces the likelihood of an upward move. - Support and Resistance Levels
A Shooting Star forming near a key resistance level adds confluence to a bearish setup. - Volume Analysis
Increased volume when a candlestick pattern forms strengthens its validity. A high-volume Marubozu confirms strong momentum.
Practical Trading Strategies
- Reversal Strategy
Enter a long position when a Hammer appears at support, placing a Stop Loss below its low. Target the next resistance level for profit. - Breakout Strategy
Use a bullish Marubozu as confirmation of a breakout above resistance, entering a trade as the next candle continues in the same direction. - Trend Continuation Strategy
In an uptrend, a Doji followed by a bullish confirmation candle can indicate a temporary pause before the trend resumes.
By integrating these candlestick patterns into a broader strategy, traders can make more informed and precise decisions, reducing risk and maximizing potential gains.
Also read: Breakout Trading Explained: Strategies, Examples, and Best Practices
Common Mistakes When Trading Single Candlestick Patterns
While candlestick patterns can be powerful tools for traders, relying on them without proper confirmation and market context can lead to costly mistakes. Many traders fall into the trap of treating trading candlestick patterns as standalone signals, failing to consider the bigger picture. Here are some common mistakes to avoid when using single candlestick patterns in candlestick trading.
Misinterpreting Patterns Without Confirmation
One of the biggest errors traders make is assuming that a single candlestick pattern is enough to predict future price movement. While patterns like the Doji or Hammer can indicate potential reversals, they should never be taken as definitive signals on their own. Traders must wait for confirmation from the next candle or additional technical indicators to validate the pattern. For example, a Hammer forming after a downtrend might suggest a reversal, but if the next candle is bearish, the signal weakens significantly.
Trading Based on One Candle Without Market Context
A candlestick chart does not exist in isolation - each pattern must be analyzed within the broader market context. A Doji appearing in a strong uptrend, for instance, does not automatically mean a reversal will happen. Instead, it could simply indicate a temporary pause before the trend continues. Understanding where a trading pattern forms - whether at a support or resistance level - can make all the difference between a winning trade and a premature entry.
Ignoring Volume and Trend Strength
Volume is a critical factor in confirming candlestick trading signals. Many traders overlook this, assuming that a pattern alone is enough to enter a trade. A Hammer or a Shooting Star forming with low volume may be less significant than the same pattern appearing with high trading volume. Strong volume reinforces the validity of a pattern and increases the likelihood of follow-through in the expected direction.
Additionally, failing to account for trend strength can lead to poor trading decisions. A Marubozu in an already weak trend may not be as reliable as one in a strong, established trend. The key is to use candlestick patterns in conjunction with trend analysis for a clearer picture.
Over-Relying on Single Candlestick Formations Without Additional Indicators
Relying solely on single candlestick patterns without considering other indicators can lead to false signals. While these patterns provide useful insights, combining them with tools like moving averages, RSI, or Bollinger Bands significantly improves accuracy. For example, a Shooting Star at a key resistance level confirmed by an overbought RSI reading increases the probability of a successful short trade. Traders who neglect these additional tools risk entering trades based on weak or misleading signals.
By avoiding these common mistakes and incorporating candlestick patterns into a well-rounded strategy, traders can improve their decision-making and reduce unnecessary risks.
Advantages and Limitations of Single Candlestick Patterns
Like any trading tool, single candlestick patterns come with both advantages and limitations. Understanding their strengths and weaknesses allows traders to use them effectively within a broader candlestick trading strategy.
Advantages of Single Candlestick Patterns
- Quick Insights into Market Sentiment
Candlestick patterns provide instant visual cues about the market’s psychology. A single pattern can indicate whether buyers or sellers are gaining control, allowing traders to react quickly to price movements.
- Easy to Identify and Interpret
Unlike complex technical indicators, trading candlestick patterns are straightforward and can be recognized with minimal training. Patterns like the Hammer or Doji are widely used and understood by traders of all experience levels.
- Useful for Short-Term Traders
Since single candlestick patterns often form within one trading session, they are particularly beneficial for day traders and scalpers who need quick entry and exit signals. These patterns can highlight potential reversals or trend continuations within shorter time frames.
- Applicable Across Multiple Markets
Whether trading forex, stocks, or commodities, candlestick patterns remain universally applicable. This versatility makes them a valuable addition to any trader’s toolbox.
Limitations of Single Candlestick Patterns
- Require Confirmation for Accuracy
A single candlestick pattern alone is rarely enough to make a trading decision. Traders must look for confirmation from the next candlestick or other indicators before acting.
- Can Be Misleading Without Market Context
As mentioned earlier, the location of a pattern within the broader trend significantly impacts its reliability. A Doji forming in a strong uptrend may not hold the same weight as one appearing near a major resistance level.
- Not Always Reliable in Volatile Markets
High volatility can lead to false signals, making it difficult to trust trading candlestick patterns in choppy market conditions. Using Stop Loss orders and risk management strategies is crucial when trading these patterns.
- Limited Use in Long-Term Trading
While great for short-term analysis, single candlestick patterns are not as effective for long-term investment decisions. Longer-term traders often rely on multi-candlestick formations, fundamental analysis, and macroeconomic factors.
Understanding both the advantages and limitations of candlestick patterns ensures traders can use them effectively without falling into common pitfalls.
Also read: Trade Management Essentials: Maximize Profits and Control Risks with Proven Strategies
Conclusion: Enhancing Your Trading Strategy with Single Candlestick Patterns
Mastering single candlestick patterns can be a game-changer for traders looking to improve their market analysis and execution. These trading patterns provide valuable insights into price action, helping traders identify potential reversals, trend continuations, and key entry or exit points.
However, successful candlestick trading goes beyond just recognizing patterns - it requires confirmation, market context, and the integration of additional technical indicators. By combining candlestick patterns with tools like moving averages, support and resistance levels, and volume analysis, traders can significantly increase their accuracy and confidence in making informed trading decisions.
If you’re looking to refine your candlestick trading skills and develop a more effective strategy, start exploring different trading candlestick patterns today. Learn how to apply them in live markets and enhance your trading approach with AdroFx. Sign up now and take your trading expertise to the next level!

About AdroFx
Established in 2018, AdroFx is known for its high technology and its ability to deliver high-quality brokerage services in more than 200 countries around the world. AdroFx makes every effort to keep its customers satisfied and to meet all the trading needs of any trader. With the five types of trading accounts, we have all it takes to fit any traders` needs and styles. The company provides access to 115+ trading instruments, including currencies, metals, stocks, and cryptocurrencies, which make it possible to make the most out of trading on the financial markets. Considering all the above, AdroFx is the perfect variant for anyone who doesn't settle for less than the best.
Related Articles
Latest updates
Latest updates


Technical Analysis
Latest updates


