Williams Percent Range Essentials: Strategies, Pros, Cons, and Avoidable Mistakes
The Williams Percent Range (Williams %R) stands as a widely embraced momentum oscillator utilized by traders to discern overbought and oversold conditions within financial markets. Conceptualized by Larry Williams, this oscillator swings between 0 and -100, furnishing insights into market dynamics and potential reversals in price trends. Its intuitive computation and user-friendly nature render it a sought-after instrument among traders of all skill levels. This piece delves into the core principles of the Williams %R, encompassing its computation method, strategic applications, juxtapositions with alternative indicators, and a nuanced exploration of its merits and demerits.
Exploring the Williams Percent Range Indicator
The Williams Percent Range, commonly abbreviated as Williams %R, epitomizes a momentum oscillator that fluctuates within the confines of 0 and -100. Its primary function revolves around the identification of assets teetering on the brink of overbought or oversold territories, operating akin to the Stochastic Oscillator.
Larry Williams, renowned for his astute market insights, crafted this indicator to gauge an asset's closing price relative to its highest and lowest points over a designated historical period. This comparative analysis aids traders in pinpointing opportune moments to initiate or liquidate positions within a market.
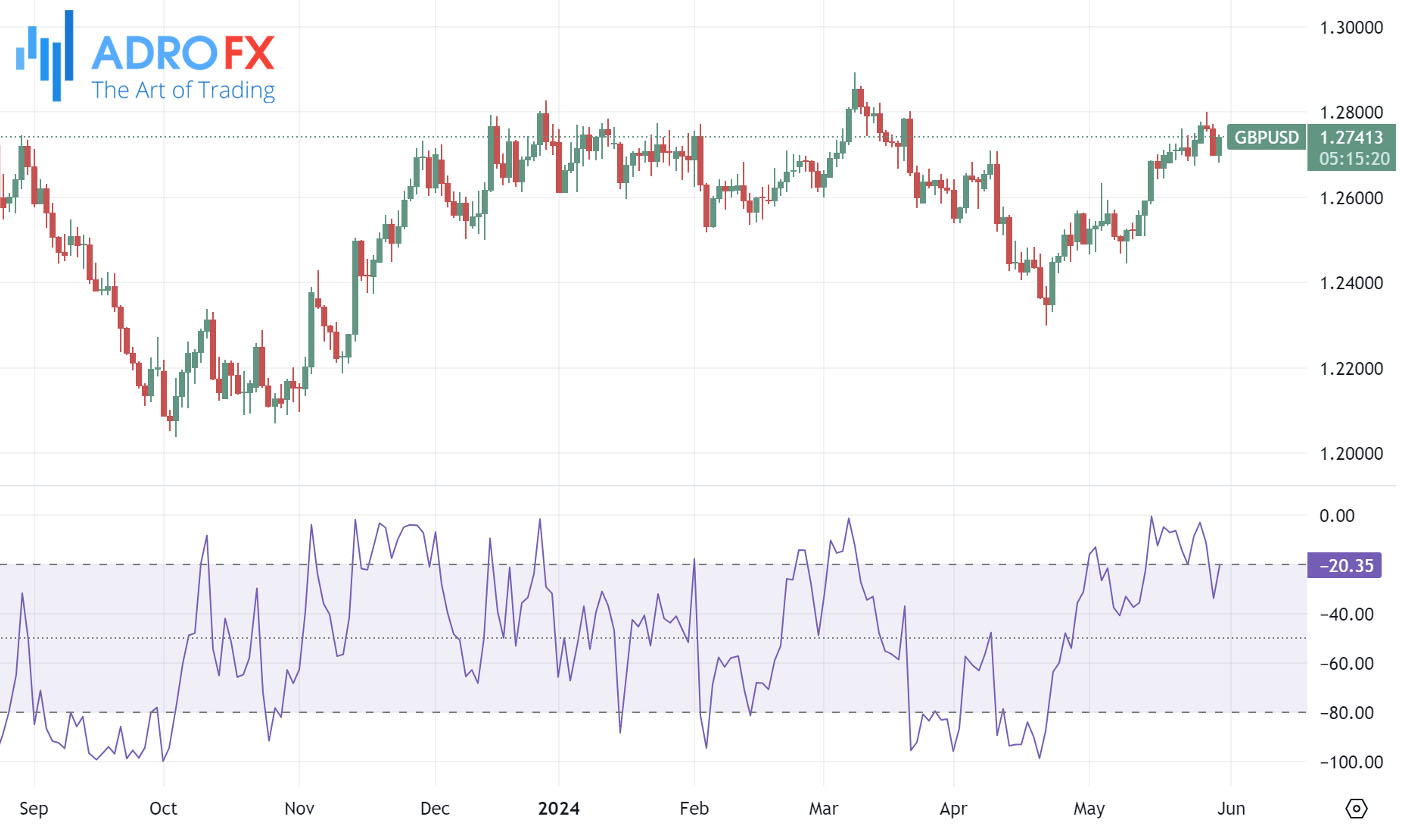
Oscillators, exemplified by the Williams %R, serve as invaluable aids for traders in pinpointing overbought and oversold scenarios. As per Larry Williams' stipulation, an asset enters the overbought spectrum when the Williams %R oscillates between 0 and -20, while traversing -80 to -100 signifies oversold territory. Traders frequently interpret these thresholds as proxies for an asset's resilience or vulnerability concerning its current market valuation.
Predominantly nestled in the lower panel of trading platforms, the Williams %R emerges as a crucial apparatus for dissecting market trends. A practical illustration of its utility is showcased through its application to the GBP/USD currency pair.
How Is the Williams Percent Range Calculated?
The Williams %R indicator is popular partly because of its straightforward calculation. The formula for the Williams %R is:
Williams %R = ((Highest High - Close) / (Highest High - Lowest Low)) * -100
Where:
- Highest High is the maximum price during the period in question.
- Close is the closing price for the period in question.
- Lowest Low is the minimum price during the period in question.
Typically, the Williams %R is calculated over 14 periods, but this can be adjusted to any preferred number of periods. Most trading platforms have the Williams %R indicator built-in, so manual calculation is rarely necessary. You can find it in the indicator section of your trading platform.
Leveraging the Williams Percent Range Strategy
Functioning as an oscillator, the Williams %R assists traders in discerning an asset's overbought or oversold status. An asset is considered overbought when the Williams %R value falls below -20 and oversold when it rises above -80. These levels indicate the proximity of the current price to recent highs or lows but do not inherently predict price reversals.
Utilizing the Williams Percent Range for Momentum Burst
In robust uptrends, the Williams %R may dip below -20, signaling a potential reversal in price. Should prices persistently ascend while the %R remains below -20, a bearish reversal is indicated. Conversely, during pronounced downtrends, a %R plunge to -80 or lower suggests a bullish reversal. It's advisable to corroborate these signals with additional indicators for confirmation.
Implementing the Williams Percent Range for Trend Continuation
To capitalize on trend continuation, focus on instances where the Williams %R crosses the -50 threshold, distinguishing between overbought and oversold conditions. A crossover of the %R and its movement in tandem with the market trend signal a continuation in price trajectory. Traders can initiate positions aligned with this direction until the %R reaches extreme levels or crosses the -50 mark anew. An %R value above -50 implies overbought conditions, while a value below -50 indicates oversold conditions. To validate a momentum shift, observe the %R transitioning from extreme levels (-20 or -80) and consistently crossing the -50 mark, indicating market consolidation.
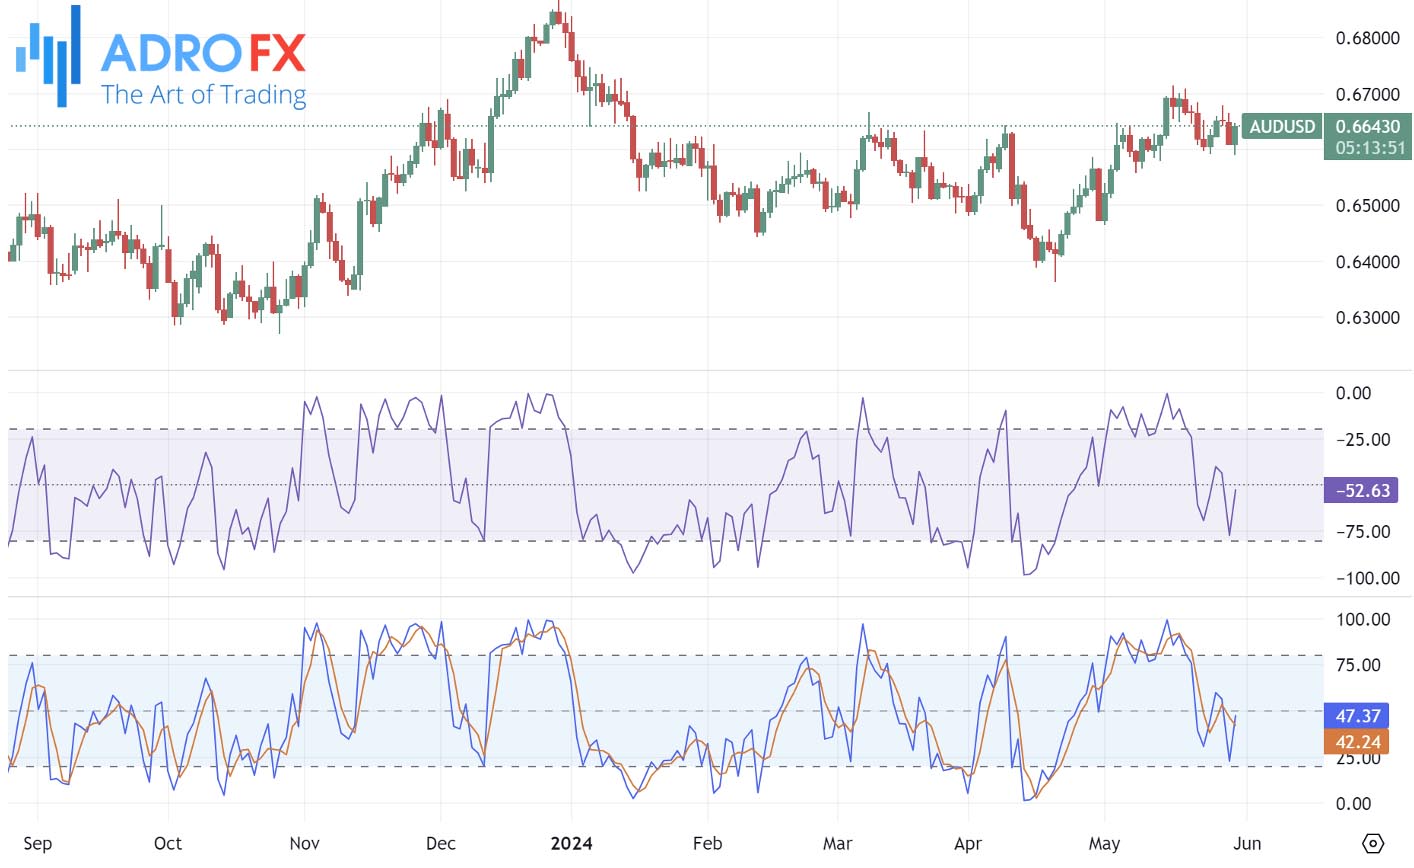
Contrasting the Williams Percent Range Oscillator with the Stochastic Oscillator
Both the Williams Percent Range and the Stochastic Oscillator are pivotal momentum indicators employed to ascertain an asset's overbought or oversold status, albeit with differing calculation methods and applications.
The Williams %R gauges the disparity between the highest price and the closing price within a period, presenting values within the -100 to 0 range. Proximity to 0 suggests overbought conditions, while nearness to -100 indicates oversold conditions. Conversely, the Stochastic Oscillator juxtaposes the closing price with the price range over a specified period, yielding values ranging from 0 to 100. Readings surpassing 80 denote overbought conditions, while those below 20 signify oversold conditions. Additionally, the Stochastic Oscillator incorporates a smoothing element, the %D line, which furnishes supplementary signals through crossovers.
In trading, the Williams %R aids in identifying potential price reversals and trend continuations, facilitating traders' decisions regarding entry and exit points based on overbought and oversold levels. Conversely, the Stochastic Oscillator generates buy and sell signals via its line interactions, with a %K line crossing above the %D line in the oversold region indicating a potential buy, and vice versa in the overbought region suggesting a potential sell.
Despite their analogous functions, the Williams %R and the Stochastic Oscillator offer distinct perspectives and insights, empowering traders to make well-informed decisions by leveraging these indicators to dissect market conditions and predict price movements.
Pros and Cons of Utilizing the Williams Percent Range
The Williams Percent Range stands as a widely embraced technical indicator, offering both advantages and drawbacks for traders. Its simplicity serves as a major asset, rendering it easily comprehensible and applicable for traders across all proficiency levels. By adeptly pinpointing overbought and oversold conditions, it facilitates informed decision-making regarding entry and exit points, proving particularly invaluable in detecting potential price reversals and capitalizing on shifts in market momentum. Moreover, the Williams %R contributes to confirming trend continuations, furnishing supplementary insights into market trends and aiding traders in fine-tuning their trades.
However, there exist certain limitations to relying solely on the Williams %R. A notable drawback lies in the susceptibility to false signals, especially prevalent in volatile or erratic markets. In such instances, the Williams %R may indicate overbought or oversold conditions devoid of corresponding price reversals, potentially leading to premature trades and consequent losses. This dilemma is exacerbated during robust trends, where assets may persistently ascend or descend despite Williams %R signals to the contrary, resulting in missed opportunities or misguided trades.
Additionally, the Williams %R falls short in providing insights into trend strength or duration. While adept at identifying potential turning points, it neglects to gauge the underlying momentum propelling price movements, thereby limiting its efficacy in comprehensive market analysis. To mitigate these shortcomings, traders often amalgamate the Williams %R with other technical indicators or analytical methodologies. Combining it with tools such as moving averages, trend lines, or volume indicators aids in validating its signals and augments overall trading accuracy.

Common Errors to Steer Clear of
While leveraging the Williams Percent Range can greatly assist in pinpointing overbought and oversold conditions, traders frequently find themselves ensnared in common traps when integrating it into their trading methodologies. By recognizing these missteps and taking proactive measures to sidestep them, traders can optimize the efficacy of the Williams %R indicator and elevate their overall trading performance.
Over-dependence on Overbought/Oversold Levels
Despite the utility of the Williams %R in identifying overbought and oversold conditions, traders often commit the error of overly relying on these thresholds for decision-making. It's crucial to acknowledge that markets can persist in overbought or oversold states for prolonged periods during robust trends, potentially resulting in missed opportunities or premature exits.
Disregarding Confirmation Signals
A prevalent pitfall involves neglecting to corroborate Williams %R signals with other technical indicators or analytical methods. Relying solely on the %R without validating signals from alternative tools can heighten the risk of erroneous readings and misguided trades.
Omitting Market Context
Traders sometimes fail to consider the broader market context when interpreting Williams %R signals. Factoring in variables such as market trends, volatility, and fundamental analysis alongside %R readings is imperative for making well-informed trading decisions.
Inadequate Risk Management
A significant oversight is the failure to implement robust risk management strategies. While the Williams %R aids in identifying potential entry and exit points, it does not guarantee profitable trades. Employing Stop Loss orders and position sizing techniques is essential to mitigate risks associated with trading based on %R signals.
Neglecting Price Action
Traders may disregard price action patterns when utilizing the Williams %R, fixating solely on oscillator readings. Integrating price action analysis can furnish supplementary validation and enhance the accuracy of %R signals.
Blindly Accepting Default Settings
Although the default period for calculating the Williams %R typically stands at 14, it's imperative to customize this parameter based on market conditions and individual trading preferences. Experimenting with various timeframes facilitates the identification of settings aligning with one's trading style and objectives.
Absence of Patience and Discipline
Impatience and a lack of discipline often culminate in impulsive trading decisions based on Williams %R signals. Resisting the urge to chase trades or deviate from the trading plan in response to transient fluctuations in %R readings is paramount.
Failure to Adapt to Evolving Market Conditions
Markets undergo continual evolution, rendering strategies effective in one market environment potentially ineffective in another. Regularly assessing the efficacy of one's Williams %R-based trading approach and being willing to adapt the strategy accordingly are crucial for maintaining adaptability and profitability.
By sidestepping these common pitfalls and adopting a comprehensive approach to trading with the Williams %R indicator, traders can refine their decision-making process and fortify the consistency of their outcomes.
Conclusion
In conclusion, the Williams Percent Range emerges as a potent and accessible tool for traders seeking to identify overbought and oversold conditions across diverse assets. Its simplicity in calculation and interpretation positions it as a valuable addition to traders' arsenals. By juxtaposing the closing price against the highest and lowest prices over a specified period, the Williams %R empowers traders to make informed decisions regarding market entry and exit points. However, while the indicator excels in spotting potential reversals and confirming trend continuations, it harbors limitations such as false signals and a lack of trend strength assessment. These challenges underscore the importance of integrating the Williams %R with complementary technical indicators to bolster trading accuracy and reliability. Despite these caveats, the Williams %R persists as a favored and effective tool for traders navigating the intricacies of financial markets.

About AdroFx
Established in 2018, AdroFx is known for its high technology and its ability to deliver high-quality brokerage services in more than 200 countries around the world. AdroFx makes every effort to keep its customers satisfied and to meet all the trading needs of any trader. With the five types of trading accounts, we have all it takes to fit any traders` needs and styles. The company provides access to 115+ trading instruments, including currencies, metals, stocks, and cryptocurrencies, which make it possible to make the most out of trading on the financial markets. Considering all the above, AdroFx is the perfect variant for anyone who doesn't settle for less than the best.
Related Articles


Latest updates
Latest updates


Technical Analysis
Latest updates


