What is the Marubozu Candlestick Pattern
Candlestick analysis in financial markets is an integral part of trading. Even if it is not used as the main method of predicting and finding entry points, it is very often used as an additional tool for the formation of signals. Let us consider one of the candlestick patterns called the Maribozu candle. What is it, what does it look like and what does its appearance on the chart tell us?
Understanding Maribozu Сandlestick
Traders in the forex or stock market are well aware of doji candles, pin bars, and engulfing patterns. Maribozu candle is different in that it is a single pattern, a special signal type of candle. In Japanese, the word "marubozu " actually means bald or shaved, and the candle in this pattern has no shadows.
This pattern has two types - rising and falling. Or - bullish and bearish (white and black). A bullish marubozu is a rising candle without shadows. A bearish marubozu is a falling candle without shadows. How should we evaluate the appearance of this pattern on the chart?
Let's remember how a Japanese candle is formed. Those who have been studying forex, remember that the body of the candle is formed by the opening and closing prices of the period, during which the candle was formed. And the shadows are the connection with the maximum and minimum values, which were during that period.
What does the shadow's appearance tell us? It proves that the opening price was the same and that the participants tried to sell the level but failed and the price returned. And if the price opened and moved only in one direction before the session or time frame closing, there will be no shadows. In fact, the extremums coincided with the opening and closing prices.
Such dynamics indicate that the chart, regardless of whether it was the stock market or forex, formed under the pressure of one type of market participants: buyers or sellers. Consequently, the movement will continue further. Thus, the Maribozu candle, when it is formed on the unidirectional movement, is a continuation pattern.
White Marubozu
Represents a fairly high candle without shadows. Sometimes very small shadows may be present, but they are a minimal percentage of the body. If the shadows are over 20%, it has nothing to do with the pattern.
When such a pattern appears on the chart, it can only mean one thing - a fairly powerful uptrend is approaching. This is what the complete absence of shadows demonstrates. The market has run out of doubts and the bulls have gone on a serious and powerful offensive.
Observing the white marubozu in the market, you should immediately open a buy position, because the movement will be very strong, and you just will not have time to make all the profits.
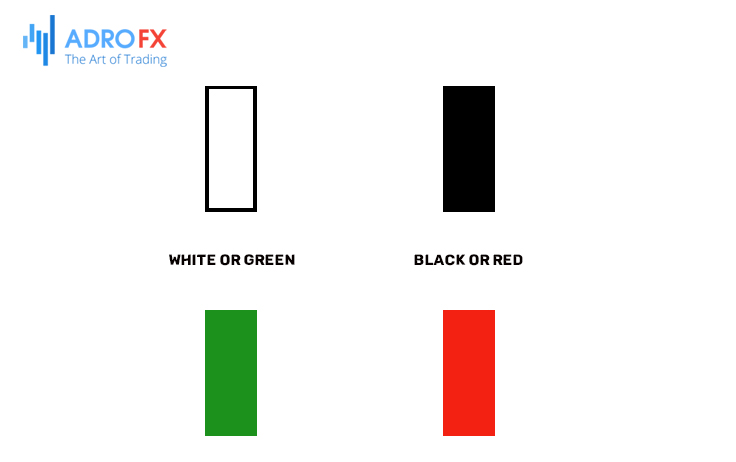
Black Marubozu
Works by analogy with the white, only in this case the market is predicting a powerful downward movement. The black candle is also very long, with no shadows. If you see that it has already formed, it's time to open a sell position.
For a white marubozu, there is the possibility of a small shadow forming at the top, and for a black candle - at the bottom. When the candlestick shadows are quite enlarged, it's already a transformation of the pattern into others, for example, a hammer. These patterns also predict changes in the market, but of a slightly different plan.
How to Trade Marubozu Candlesticks?
Maribozu candlesticks have modifications and they don't always completely lack shadows. There is an opening marubozu, which is when a bullish candle has only an upper shadow, or a bearish candle has only a lower shadow. By analogy, there is a closing marubozu. A bullish pattern will have only the lower shadow, while a bearish pattern will have only the upper shadow. It's easy to remember them because the absence of shadow is observed only at the opening or only at the closing of the candle.
Since the appearance of this type of candlestick indicates a strong directional movement and is a continuation factor, so they can be seen as a signal to enter a position on the trend. The marubozu candlesticks must coincide with the direction of price movement. Often they can be found at the end of a consolidation, which can indicate a new momentum and form an entry point into a trade.
If you have learned to recognize these patterns on the chart, it will be quite easy to trade them. To do this, it is advisable to use an indicator that draws support and resistance levels on the chart. For example, if a black marubozu breaks out a support level, then the chart will not necessarily go strictly downwards. It is quite possible that there will be a small rebound and then the movement in the bearish direction will resume for a long time.
The situation is similar for a bullish marubozu. If a white candlestick breaks out the resistance level from the bottom upwards and closes behind it, you can expect active price growth. However, even here, sometimes a corrective movement occurs, after which the trend will purposefully go upwards.
How to Improve the Accuracy of the Marubozu Signal
If you are using a candlestick chart rather than a Renko chart, it's time to learn how to spot marubozu candlesticks. It is best to use them as an additional signal to enter a position. What to combine marubozu candles with?
Technical levels. If a bullish marubozu is formed from a support level, it's time to buy. But if the price rebounds from resistance, forming a bearish marubozu, it is a sell signal.
Patterns of technical analysis. If the marubozu candle and, for example, a pennant or flag pattern coincide, which are also trend continuation patterns, the movement will be and it is necessary to open a position in the direction of the trend.
Indicator strategies. Strategies using indicators can be different: only based on a trend, using a combination of trend and oscillators. And here it is important to understand that, having determined the main direction and having seen a confirmation in the form of a marubozu candle, the trader can open a position.
Conclusion
Summing up, it is worth noting that if a marubozu candle appears on the chart, the trend is not going to reverse or slow down, let alone go into a flat. This is just an indicator of which direction will prevail in the near future. When several similar patterns appear on the chart, it can already be considered a reversal. But to confirm it, it is necessary to analyze the readings of other technical indicators.

About AdroFx
Established in 2018, AdroFx is known for its high technology and its ability to deliver high-quality brokerage services in more than 200 countries around the world. AdroFx makes every effort to keep its customers satisfied and to meet all the trading needs of any trader. With the five types of trading accounts, we have all it takes to fit any traders` needs and styles. The company provides access to 115+ trading instruments, including currencies, metals, stocks, and cryptocurrencies, which make it possible to make the most out of trading on the financial markets. Considering all the above, AdroFx is the perfect variant for anyone who doesn't settle for less than the best.
Related Articles
Latest updates
Latest updates


Technical Analysis
Latest updates


