What Is The Market Facilitation Index and How to Use it in Forex Trading
Trading volume is the main measurable indicator in determining price levels in the market. The trading volume increases at the highest activity and can influence the price trend, either strengthening it or changing its direction.
Actually, the main reason for studying this indicator is an objective analysis of the market situation at the moment. Most traders prefer the Market Facilitation Index (MFI) indicator, as it perfectly copes with the above tasks. Let's take a closer look at the functionality, setup, and application of this tool.
MFI Indicator Description
MFI - Market Facilitation Index is designed to estimate the amplitude of the price for a certain period, depending on the volume of forex trading for a certain period of time.
The formula for its calculation is as follows: MFI = (High - Low)/Volume, where High is the maximum price for a certain period, and Low is the minimum price for a certain period, Volume is the trading volume.
Forex MFI indicator was developed by Bill Williams, a famous millionaire trader, a supporter of using technical analysis when trading on financial markets, and the founder of the famous trading school "Profitunity Trading Group". He is the author of several more indicators, such as Alligator, AO, and AC, which he described in his book "Trading Chaos".
Initially, MFI was used for stock trading but later it turned out that it also can be effectively used in the Forex market.
The principle of operation of the MFI is based on the comparison of the dynamics of trading volumes and prices during a certain period. Based on these changes, it is possible to confirm or refute a trend. Measurements are made relative to the previous index value. It means that if MFI is more than the previous index, the prices will grow. The index is connected with volatility, which is typical for the asset at the moment of measuring. MFI does not give signals for entering or exiting the trades, it is used as an additional indicator when trading. It can be used in any time frame.
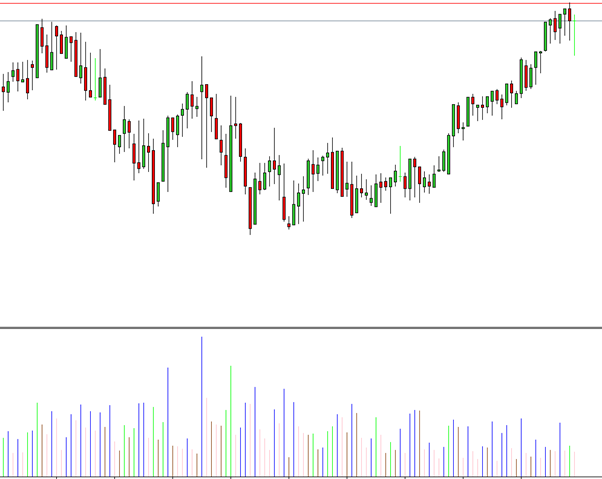
The MFI is presented in the form of a bar chart with bars colored green, brown, blue, and pink, depending on the market situation. These are standard colors, the trader can choose other colors in the trading terminal. MFI is estimated as generating quite a lot of false signals, but overall it gives quite accurate information.
Even though MFI is quite actively used in forex trading as a trader's tool and quite a simple and understandable indicator, to a greater extent, it is a market analysis tool, the main purpose of which is to give the trader a deeper understanding of the market, to show clearly what sentiment prevails in the market at a particular time.
How to Use the MFI Indicator
This indicator gives signals when there is a divergence between the price of a trading instrument and the oscillator line. When the price is rising, the falling MFI line indicates a price reversal shortly. Such divergence is called class A divergence. An example of such a market situation can be seen in the figure below.
The marks 20 and 80 indicate oversold and overbought areas, respectively. When the oscillator line passes above or below these marks, a signal for a reversal of the price of the trading pair is generated.
When the price and the MFI peaks coincide, it means the dominating ascending trend will soon be replaced by a bearish one or the price will correct. Conversely, if the current price movement is directed downward and the indicator reaches the 20 level or lower, the probability of the price change to the upside is high.
In a situation where the price movement coincides with the direction of the oscillator line, there is confidence in the inflow of capital into the market and the strengthening of the trend. However, if the price decreases and the indicator line is directed downwards it means that most traders fix their positions and exit the market.
Not always the divergence of price and indicator chart is confirmed by the actions of traders, in this case, you should wait for the best opportunity to open positions and observe the market on the sidelines.
The divergence on the chart can intensify over several time bars, so you should not open a position if you have not received signals of a trend change from other instruments or candlestick combinations.
With the MFI oscillator, you can observe and analyze the overall market picture, detect overbought or oversold assets, and most importantly, suggest price peaks from which the asset can change direction.
You can use the Bollinger Bands, the Keltner Channel, or the Alligator to help you analyze the MFI, thus reducing the risk of mistakes in analyzing the chart.
How to Read the MFI Colours
Bill Williams, teaches us to pay attention not to the size of the bars, but their color. Exactly the color of the bar is the key parameter for working with this instrument. Below we will suggest considering what this or that color of the column means. And since it is easy to get confused in their color relative to the rise and fall of MFI and volume, you can look up the pointing cheat sheet at any time in the indicator parameter panel. Specifically in the "colors" tab.
The green color of the MFI
The coloring of the bar in green means that for the selected period of time there has been growth in both the MFI and the volume. That is, it can be interpreted that the market price of the asset, was rising or falling, exactly in proportion to the formed ticks. In other words, this financial instrument has demonstrated the active interest of traders, during the bar/candlestick.
The developer of this indicator himself compares the green color with the green traffic light color. Assuming quite an obvious analogy, the move is allowed. But we should not associate this permissive signal with entering a position. The green line here signals only the price itself. Of course, it is not in the direct sense - we are speaking in the language of metaphors.
Bill Williams warns that in the presence of a green bar, you should not tempt fate - to enter the position. Because this color means the presence of the activity of players. And entering a position at the moment of a green traffic light is similar to jumping into "the last carriage of the departing train".
Thus, the green color of the index shows, that is, gives the trader confirmation that the price direction only increases. And if in the presence of a green column we already stand in a position in the direction of the trend, then we can breathe deeply.
The brown color of the MFI
The color of the column in brown signals to us that in this time interval both the MFI index and the volume of ticks decreased. These market events can be interpreted as a "settled" balance between the buyers and sellers. But another, no less rational understanding of this market situation can not be excluded; Thus, it can be assumed that the interest of market participants in this asset has simply disappeared. No one buys or sells this instrument, and the price is gradually decreasing its movement (in either direction) - hence the balance.
Here you will ask; "Then why is there a brown stick at all? After all, if no one is buying and selling, then it would be logical to say that there should be no brown index at all!" The answer lies in observing the process of calculating the index. That is, if the volume of ticks decreases, then the divisor is minimized. And therefore the quotient decreases. But the price moves a little, doesn't it?
For it to be as you say, i.e. for the full absence of the brown index, the price must stop and there must be no traders at all. Suppose, at least for 1 minute (time frame M1). As you can understand it is impossible! Hence the logical conclusion and, at the same time, the statement of Bill Williams that this brown index signals to us the slowdown of the current trend.
By the way, this brown bar is also not used for making trading decisions. It serves only as additional filtering. Both in price analysis and direct trading. The natural strategist Bill Williams associates the brown color of the index with the adjective state of the market "decrepit", "withering" or "withering". By this, he means the loss of traders' interest in a given asset and/or current trend.
The blue color of the MFI
When the blue bar appears in the MFI histogram, the following player interactions take place: the MFI index is growing, respectively its growth can be explained by the fact that according to the formula the divisible is growing (High - Low), and the divisor (Volume in ticks) is decreasing. But what can such interaction be related to? And there is only one reasonable explanation:
The decrease of volume on the background of an increasing trend is explained by the absence of interest of traders, but at the same time, the market dominates previous initiative trades. And while the price is in the potential of movement, the decline in volumes tells us that there are not enough counterparties for the initiative players acting in the market yet.
However, there is another, not less rational explanation. Thus, the decrease in volumes against the background of price tendencies may indicate that the big players are trying to establish some control over the movement. Provoking the adventurers to enter the market against the real trend. And we all understand the consequences of trading on the "artificially" created changes in the rate value of the asset! In the simplest terms, the MFI grows and the volumes go down.
Williams cautions his followers that during the formation of the blue bar, traders should refrain from trading. This recommendation applies especially to beginners, who are not yet able to assess all variables as objectively as possible. Bill Williams assigned this index a blue color because of the association that the blue color is characterized as, "fake", or "unnatural".
The pink color of the MFI
The pink color of the MFI, and in our case the red color of the bar, opposite the blue bar, tells us that the index is declining and the volume is increasing. Of the entire palette of colored bars, the pink bar is the only index that can refer to signal indicators to a greater or lesser extent. The creator of this tool, with an analytical mindset, thinks that special attention should be paid to the formation of the pink bar.
Because it is with the pink bar fixed (at the end of a period/candlestick/bar), the trend has priority in stopping the movement. And in the consequence, and not a bad potential to change the trend direction! In any case, entering into a position on the pink signal is an optimized trade decision. And confirmation of a correct trading decision, as you have already guessed, is the appearance of a subsequent green semaphore.
The red histogram element is characterized as a "landing" one. But what happens when the bulls and bears get so angry? If we analyze the volume growth when a red index is falling, it means that the traders' activity is taking place. However, if the MFI is decreasing, then the price slows down. This leads to the conclusion that either the initiator counterparties enter the market, or the initiators themselves withdraw from their positions.
Advantages and Disadvantages of the MFI Indicator
Every indicator has its benefits and drawbacks. The MFI is no exception. Let's first consider its pros:
- Versatility. This indicator can be used for any assets on any market, you can trade with it in different time frames.
- Independence. The indicator is good on its own, it is possible to build a good trading strategy, using only MFI. Although some traders recommend supplementing its signals with other indicators, it is not necessary.
- Accounts for volumes. Because this indicator takes into account not only the price changes but also the volumes of these changes, it gives more accurate signals.
- High sensibility. When the price changes MFI reacts much faster than many other indicators, which tend to lag. This allows the trader to get more relevant information and signals.
- It helps to identify the points where the price can perform a reversal. The intersection of the 80 and 20 marks of the MFI curve is just such points.
Speaking about the disadvantages of the indicator, we can mention the following points:
- Variability in the growth of the index. Yes, it is the bars of the histogram that have the ability to both, the growth and the decline of the index itself. We are sure that after reading this article you have already understood what it is connected with. But let's repeat it just to fix the material. As interpreted, concerning this product, MFI and instrument volatility are two inseparable concepts. Of course, we don't understand it literally now but somewhat exaggerated.
Thus, when the MFI histogram index declines (or rises), we can argue in two ways. Depending, again, on the color of the bar. But goodness, we remember that the value of the index has no weight. Therefore, the consistent arrangement of MFI is not so important for us as the next disadvantage of this tool. - Variability in the color of the index. Exactly this disadvantage does irreparable damage to the reputation of this product of Williams. Because it often happens that we seem to have entered at the most favorable moment. And the next green bar calmed us down. But just before the close of this bar, the green traffic light suddenly changed to any other semaphore signal.
And this is where the problems begin. Depending on market conditions. And there are, as you understand, quite a lot of them: entries into the trades, exits from the market, partial closing of positions, "reversals", or Martingale "doubling"... And if we reduce the number of "optimal" combinations of successive indexes to a minimum, then there will be an excess of such developments. Exceeding, at the same time, the normative limit concerning "production errors".
Based on the information from the downtrend bar, a trader can accurately assess the situation and enter the market at the best moment. But for this purpose it is necessary to use other indicators, the MFI is not informative enough. Bill Williams suggested using the MFI with MACD indicators, Fractals, and Fibonacci retracement. Also, the indicator is actively used in strategies using Elliott Waves.
MFI-Based Trading Strategies
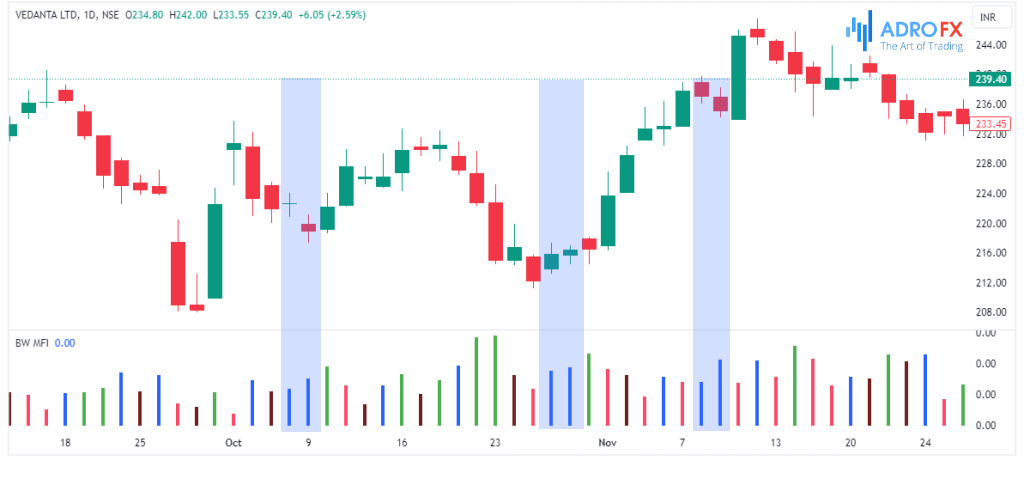
One of the strategies using the MFI is to focus on the pink bar. It can be seen on the chart that the pink bars of the MFI indicator generally correspond to the trend reversal start points.
The trader, focusing on the indicator readings, assesses the further movement of the trend, placing both buy and sell orders simultaneously, close to the extremums of the pink bar of the indicator. After the triggering of the order, the other order is canceled if the indicator forms a green bar, this confirms the correctness of the trader's actions.
That is, in this case, the indicator allows the trader to enter the trade before the trend is formed, and the MFI is triggered as a leading indicator. It is possible to trade with the MFI alone, but it's an unreliable strategy. Additional tools would be appropriate here to determine the point of entering the trades more precisely.
For example, a Moving Average (MA) could be such a tool. The strategy implies that the MFI confirms the signals of the MA. To implement the strategy, it is necessary to add МА to the chart and set the required period in the indicator settings window.
The trader notices when the price crosses the MA from top to bottom, it is assumed that the trend is changing, which is confirmed by the pink bar. And a sell order is placed below the local minimum. If the opposite situation occurs, the price crosses the MA from below upwards, orders are placed above the local maximum. Make sure to set Stop Losses while applying this strategy.
A rather high time frame is chosen for trading. It is believed that the combined use of these indicators gives very accurate leading information about the market situation. If a strong uptrend is seen on the chart, a green bar is formed on the MFI and a green bar is also formed on the Volumes indicator, a trader can open a long position. In this case, the green MFI bar can even serve as a signal, although in other cases it only confirms the correctness of the trader's conclusions regarding the trend direction.
Bill Williams suggested using a strategy where Elliott Waves and MACD are applied. In this strategy, if the pink bar MFI is in the predicted target zone of the Elliott wave and at the same time the MACD shows a divergence, it almost certainly means a trend reversal. That is why Bill Williams believed that in such a situation, it is possible to place a buy order slightly above the maximum and a sell order slightly below the minimum and wait to see where the trend reverses. This strategy is recommended in time frames from 4H.
Another strategy with MFI for short-term trading involves assessing the situation using other Williams indicators. Parabolic, Moving Averages, and Alligator are added to the chart. The signal to enter the trade is determined by the pink bar formation on MFI, and other indicators confirm or deny this information.
MFI is an effective trading tool in combination with Parabolic, Moving Average, and Alligator indicators.
The strategy is used in any time frame, but time frames from 4H are preferable because there are more false signals in lower time frames.
Three indicators are used in the following strategy as if forming a single trading tool. Standard indicators CCI, MFI, and OBV should show the maximum values, which is a signal to open and close a position, because the entry point is formed very clearly, at the intersection of the three indicators.
There is also a very simplified strategy that is used on some currencies on the candlestick chart, which uses only the green MFI bars. You enter the trade when a green bar is formed, taking into account which candle is formed, bearish or bullish, and the corresponding trade is opened.
The strategy requires considerable trading skills, as it shows a lot of false signals, but their number decreases with the use of additional indicators. Also, this strategy requires practice on a demo account and selection of appropriate trading pairs.
MFI Trading Tips
The recommended time frame for the MFI is 4 hours and higher.
It is not recommended to use the MFI as an independent indicator. If you have experience, you can try but make sure to use patterns. To make your work easier, use Pattern Graphix to identify patterns on the chart.
The MFI indicator is a great trading tool. Although it does not give information about the volume of all the funds in the market, its signals are reliable for trading.
The MFI showed the greatest efficiency in exchange-traded instruments. Still, you can also use the oscillator when analyzing the futures, because their value always correlates with the price of currency pairs.
With the MFI, you can understand in which direction the funds are currently invested, and thus understand the direction of the main price movement of the asset. You can combine it with any indicators, as well as use it to filter signals from Stochastic.
Conclusions
The MFI indicator is a standard indicator from the series of tools developed by Bill Williams. It is mostly an analysis tool of the market situation, but it is also actively and effectively used in forex trading together with other indicators, as MFI alone does not show the best entry points into trading.

About AdroFx
Established in 2018, AdroFx is known for its high technology and its ability to deliver high-quality brokerage services in more than 200 countries around the world. AdroFx makes every effort to keep its customers satisfied and to meet all the trading needs of any trader. With the five types of trading accounts, we have all it takes to fit any traders` needs and styles. The company provides access to 115+ trading instruments, including currencies, metals, stocks, and cryptocurrencies, which make it possible to make the most out of trading on the financial markets. Considering all the above, AdroFx is the perfect variant for anyone who doesn't settle for less than the best.
Related Articles


Latest updates
Latest updates


Technical Analysis
Latest updates


