What is the Alligator Indicator, and How Do You Use It in Forex Trading?
The forex market, like other financial markets, has its nature. The use of trend lines, horizontal levels, and candlestick patterns are the basis of price movement analysis, but they are often not enough to find good signals to open trades, especially during a flat. Every kind of asset, whether it is a stock, a bond, or, in our case, a currency, moves in different ways.
The foreign exchange market, just like others, is about 70-80% of the time in the flat, or sideways movement, and the rest 20-30% of the time it is in a trend. The main problem of technical indicators and oscillators is signal correction. Today, we will consider a classic indicator from the legendary trader Bill Williams, Alligator. This tool does not have the above disadvantages and is one of the most popular algorithms among modern traders.
What Is the Williams Alligator Indicator?
Alligator is a trend indicator designed to allow you to trade in a moving market. It means that according to the signals you can determine the phase of the market, and there are also rules of entry. That is, up to a certain point, the Alligator indicator does not give any trading signals, which means a flat state, that is sideways. Given that much of the time the market is in this state, we can conclude that trading on this indicator will not be very active.
On the other hand, no qualitative method of analysis ensures a large number of market entries, so it is necessary to maintain the balance between quality and quantity. Scalping strategies work well, but this is a completely different type of trading with significant technical risks.
The Alligator indicator is based on Moving Averages. It is a universal method of trend analysis, and almost all trend indicators estimate the average price value in one way or another. There is no other way. Because of this, many traders give up any modifications of the Moving Averages and use the usual variant.
Let us now analyze why the Alligator indicator is better than a Moving Average:
It consists of three Moving Averages with different periods, which can resemble a fan strategy of MAs.
It uses a smoothed calculation method, which for some unknown reason many people do not use, preferring the more volatile exponential options.
The price value expressed as the average between the maximum and minimum, the so-called median price, is used for calculations.
The indicator uses a time shift, a function that is not often seen in strategy descriptions. And given how old the indicator is, there is no doubt that it is effective.
Like many classic indicators, Alligator is designed to be used and traded in high chart periods, starting from H4. At the same time, MAs periods remain quite small. That is it can be called scalping in high time frames, which are much less subject to sudden changes in trend and large-scale fluctuations. This is understood as a large trend of steadiness.
The Significance of the Indicator Curves
Before you add the Alligator indicator to your chart and read how to use it in real trading, you need to understand the purpose of the curves. There are three of them, and each one is responsible for the estimation of volatility in its period.
Lips (as a rule, the green line) is a Moving Average with the smallest period - 5 and is smoothed by three bars on subsequent values. It estimates the recent trades period, and quickly reacts to the price changes;
Teeth (as a rule, the red line) - the middle period of a Moving Average, it serves to determine the balance price for a longer period (8 candles), it is smoothed by 5 bars;
Jaw (usually blue line) - smoothed average with the longest period and shift (13, 8), and therefore, the slowest. It should represent the fair price in the market, provided that no new factors (e.g. - news) act on it. Williams called this curve a "balance line". When the price is above the jawline, the market positively evaluates the factors affecting it (the price goes up). At a break below - the assessment becomes negative, and the price decreases.
Using Williams' terminology, we can say that when all three curves are close to each other, the alligator "sleeps" and volatility is close to the minimum. But the longer the alligator sleeps (and the consolidation continues), the hungrier he wakes up. The awakened "predator" comes out hunting for the price, "opening its mouth" wider - the curves diverge.
The increased distance between curves is a trading signal used by Bill Williams in the Alligator strategy.
However, Moving Averages have one important drawback - they give out a lot of false signals, especially on those currency pairs, which are characterized by a sharp reaction to the news background. Some range indicators, such as Bollinger Bands, should be used additionally for successful trading. But if we can do without calculation of the standard deviation of the price and the dynamic range, nothing can replace the second important part of Williams' strategy.
The combination of the Alligator indicator and fractals in real trading will be considered below. It is necessary to install and configure the Alligator indicator in the terminal before searching for market entry points.
How to Set up the Alligator Indicator in MetaTrader 4
The tool is available in any MT4 terminal, so you do not need to download it separately. This trading terminal has a special menu section devoted to the works of Bill Williams. To add Alligator to the chart, open
Insert → Indicators - Bill Williams → Alligator.
As a result, the following picture will appear on the chart, as shown in the screenshot below:
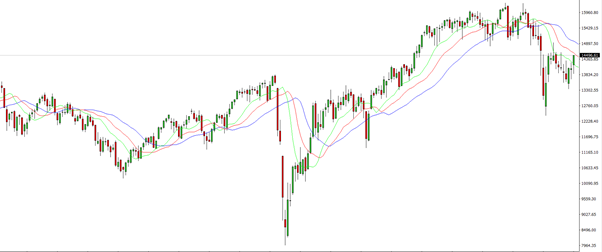
First, the indicator is tested on a demo account so as not to risk any real funds. At this stage, it is recommended to leave the basic settings by default. To change them, you can right-click on any line and go to the "Parameters" section. Here you can independently set any option, including the period and shift.
Note: Alligator provides sufficiently accurate signals, provided that the market has a pronounced trend. At the same time, there is moderate volatility (prices do not change sharply). Therefore, it is best to work with it during the European and American trading sessions. If the market is flat, it is better to switch to another chart.
Adjusting the Trading Strategy for the Forex Market
The use of any of Williams' indicators and strategies has its characteristics, which fully applies to Alligator and Fractals. This is because of the way they were originally designed and applied to the stock and bond market where a major breakout does lead to an up-trend more often than a rebound or return to the range. Therefore, a fractal symbolizes some psychologically important price levels, but only for the CFD market.
Forex is a more "emotional" market, here the breakout of the consolidation range does not always mean the beginning of the trend. As for the Williams' indicators, it means that before starting to trade, one must check on historical data how big the depth of false breakouts of a certain pair is, and adjust the placement of the pending order according to this data.
Moreover, it is not recommended to use the Alligator indicator in intraday trading on pairs with high sensitivity to the news background. The trader chooses the lower time frames (M15 and lower) and takes a serious risk as the new movement can be seen only in a very narrow consolidation channel or flat.
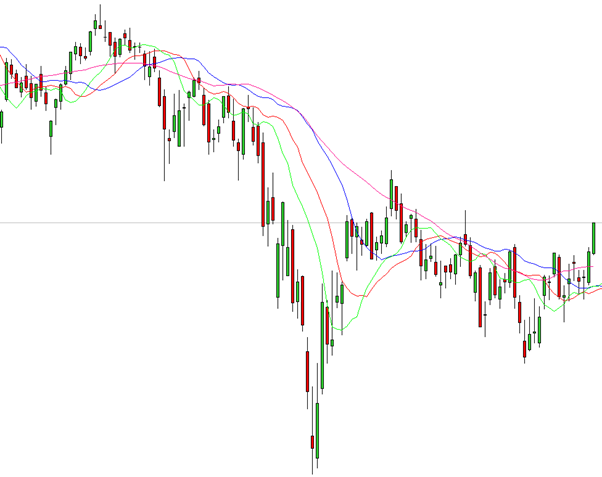
How to Read the Alligator Indicator?
All three lines of the indicator are used to analyze the situation:
- The intersection of the green and red lines shows specific entry points.
- The blue line shows the general trend (if it is upward, the trend is upward, and if it is downward, the trend is downward).
- The red line is also used to determine when to close a trade.
To enter the market, first of all, it is necessary to be guided by the lines' crossing:
- If the green line has crossed with the red line, with the green line going up, we open a long position.
- If the green line has crossed the red line from above downwards and continues to decrease, then we open a short position.
Stop Loss is placed at a distance of 15-20 points from the entry point. Thus gain is secured in different ways:
- After the price passes 50-60 points (3 times Stop Loss);
- After a reverse signal (when red and green lines cross in the opposite direction);
- The moment the price reaches the resistance line (BUY order) or the support level (SELL order);
- Trailing Stop (it automatically follows the chart and closes the position at the moment the price moves in the opposite direction).
How to Trade Pullbacks with the Alligator Indicator
Alligator does not reframe, i.e., a trader sees its lines equally both online and at any time in history. But this algorithm, like many other indicators, gives signals with a significant delay, which reduces the return and increases the likelihood of losses. In addition, it is inert, so sharp movements of the chart may trigger Stop Losses.
But both of these disadvantages can be overcome if the tool is used for trading corrections. Corrections are known as short-term pullbacks - price movements against the current trend.
Trades can be opened on corrections, if:
- There is a clear trend in the market;
- The price went in the opposite direction and crosses the green curve;
- Then the price reverses again and goes in the trend, crossing the green line again.
For example, to short, the signals would be as follows:
- There is a downtrend in the market.
- The candlesticks went upwards and crossed the green line (they may partially cross it).
- Then they come back down again. At this moment it is possible to open a short-term short position.
To long, the signals will be opposite:
- An uptrend is developing in the market;
- The candlesticks went down and crossed the green line from above downwards;
- Then the candlesticks come back up again. At this moment, it is possible to open a short-term long position.
For your information: the trades by this strategy are opened for a few minutes since if the trend is going on for a long time, it can reverse at any moment. That is why the described system is most often used in scalping trading (placing many trades a day with taking even a small return of some points).
Alligator in Combination with Other Indicators
Alligator can and should be combined with other algorithms. It is most often combined with fractals, Moving Averages, and oscillators (for example, Stochastic). They are all available in any MT4 or MT5 terminal.
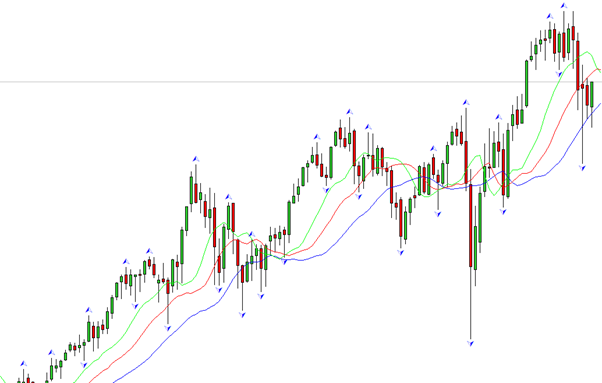
Alligator and Fractals
Fractals give specific trading signals in the form of triangles, which are usually above the local maximums (entry to sell) or below the local minimums (entry to buy). Trading using this algorithm is carried out only in the trend market, using pending orders, not market ones:
- Buy - Sell Stop (at a distance of 2/3 of the current price);
- Sell - Buy Stop (at the same distance).
Stop Loss and Take Profit are set according to the usual rules.
To understand how to trade with fractals, we recommend that you read more about the fractal analysis of the financial markets.
Moving Averages and Alligator
Moving Average is a classic indicator, which is used in many strategies to determine the main trend. Alligator includes 3 MAs, but a trader can add a fourth line, for example, with a period of 50. Then the market condition can be determined as follows:
- If the candles are located above the line 50, the trend is upward, and only Buy orders should be considered;
- If the candles are below the line 50, the trend is downward, it is worth considering a short position.
That is, the idea is to add to the chart a filtering Moving Average with a large period, which will show the global trend. Further sifting out Alligator signals by signals of this line. When adding another Moving Average to the chart, do not forget to color the new line, so that it does not merge with the Alligator lines.
Pay attention that Moving Averages may lag, as they only follow price. Therefore, you should consider different indicators, as well as price resistance and support levels when making your decision.
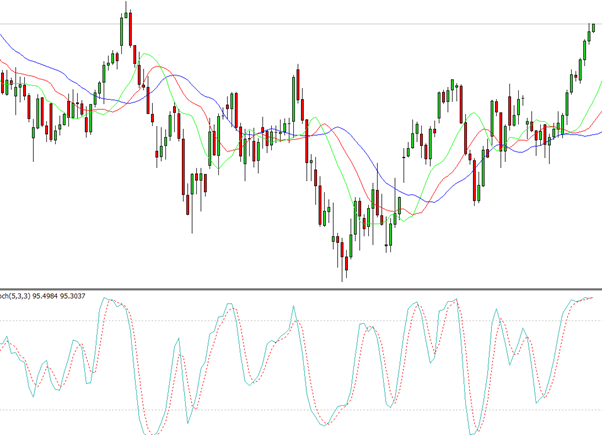
Stochastic + Alligator
The Stochastic can also be found in any MT4 and MT5 terminal. It provides clear, easy to understand signals:
- A buy trade can be opened when the line is below the 20 level, then crosses it and goes up;
- A sell trade can be opened when the Stochastic line is above level 80, crosses it, and goes down.
Alligator must confirm the entry point, plus the price must not be in a flat position.
Alligator is a fairly effective tool that is suitable for determining the entry point, as well as for setting a Stop Loss, as well as determining when to close the order. But it is better to use it in combination with other algorithms. Then the accuracy of signals increases markedly.
How to Use Alligator to Set Stop Loss and Take Profit
Alligator can be used for receiving basic signals, as well as for setting a Stop Loss and Take Profit. For example, a trader uses resistance and support lines to enter the market. But he also needs to understand where to place the protective Stop, and at what moment to close the order. Alligator is of great help here. For example, the Stop Loss can be set in 3 ways:
- Above or below the jaws of an Alligator (blue line) is the most reliable option. Although the potential loss can be large.
- On the green line - the riskiest option. But the potential loss is also minimal.
- Triple Stop - on each of the Alligator's lines. And the largest volume should stand on the blue line, i.e. on the jaw, and the smallest - on the green line, i.e. on the lips.
To secure the gain, you can also 3 ways - when the price crosses:
- the green line (cautious trading);
- the red line (trading with moderate risks);
- the blue line (risky trading).
Advantages and Disadvantages of the Indicator
Despite its versatility and high efficiency, the Alligator indicator has some disadvantages, which appear first of all in pairs with low exchange rate volatility. It generates too many false signals on such assets, so its environment is trading in the trend, on pairs not subject to unexpected and extreme reactions to the news background.
Forex strategies using Alligator as a trend indicator are successful in general, but they require individual adjustments for a particular trading instrument to reduce the number of false entries. However, almost all indicators and expert advisors need presetting. Alligator is notable for its easy readability of trading signals and clear tactics to use after the beginning of trading.
Tips for Using Alligator in Forex Trading
- The indicator lags, and the horizontal shift makes it somewhat inert. Do not enter the market as soon as the lines have diverged, most likely at this point, the correction to the previous movement has already begun.
- Alligator indicator is not a ready-made strategy, its signals must be filtered.
- Alligator is a pronounced trend indicator. During a flat, its signals are ignored.
- In low time frames, the number of false signals increases, and it is undesirable to use it on M1-M5.
- The standard approach (with the addition of fractals) may not work well on the forex market within a day.
- Do not try to remove the lag by adjusting settings. This will only increase the number of losing signals and can break Williams' basic logic.
- The above can be boiled down to "do not change the settings too much and filter signals tightly". This is the basic rule for most indicators.
Conclusion
The best proof of the value of the Alligator indicator is the results of Bill Williams. He made his millions thanks to this tool. This indicator is not just another theoretical development, its effectiveness has been tested by the developer and thousands of other traders.
Alligator can and will be beneficial in skillful hands. All you need to do is to follow the basic safety rules when working with this indicator.
Related Articles

Latest updates
Latest updates


Technical Analysis
Latest updates


