Bill Williams Indicators

Bill Williams indicators are familiar to all traders in the world. They are included in every terminal and are the basic tools for technical analysis of the forex market. Their popularity is due primarily to the fact that they were invented by Bill Williams — a successful trader, who created an entire financial institution. In addition, Mr. Williams became known to the participants of the foreign exchange market for his work "Trading Chaos". His creation couldn't go unnoticed, and when traders figured out the strategies the indicators support, they began to actively use the tools in trading. The fame was not long in coming, and today Bill Williams indicators are widely known throughout the world.
Bill Williams Strategy
The emergence of indicators was preceded by the already mentioned work "Chaos Theory", in which the author first mentioned the "Alligator" indicator. There, the indicator was called the best way to get the signal for opening a profitable trade at the beginning of an incipient trend. Soon millions of traders began to test this indicator. They were forced to agree with the opinion that the indicator can really work even in unpredictable market conditions.
The stunning success of the Alligator made this trading indicator the first in a series of other equally effective indicators later created by the genius trader. Bill Williams' strategy turned out to be so effective that traders began to switch to trading on its signals. Using Alligator and other indicative trading robots created by the Williams family, forex trading becomes a systematic way to profit.
Of course, Mr. Williams' strategy is the most ambiguous, controversial, and intriguing, but those who understand the system will be successful in the financial market. It cannot be denied that the indicators work perfectly even in today's frequent market volatility. Using standard variations of trading indicators as well as more modified versions, you will be able to analyze prices and open profitable transactions even before the trend appears, which means you will be beyond any competition.
The Essence of Bill Williams Trading System
In the "Chaos Theory" book, the author developed the idea that all currency movements can be completely chaotic and unpredictable. The strategy does not have any forecasting elements, for the author claimed that chaos is temporary in nature, and at the same time, it is constant.
Commenting on traders' losses, Mr. Williams argued that too much time and attention was given to analyzing the situation that had arisen and comparing it with experience. The author insisted that reducing the percentage of losses depended on understanding the structure of the currency exchange, not on long and useless analysis.
5 Market Dimensions
B. Williams' strategy is based on the fact that to improve trading, one must learn to distinguish between the 5 phases of the market. According to the author, a trader should distinguish:
- Fractal (phase space)
- The driving force (energy phase)
- Acceleration / deceleration (power phase)
- Zone ( combination of strength/power phase)
- Balance Line
In support of this system, Mr. Williams has developed indicators to help the trader with identifying market phases. These trading algorithms can be safely classified as technical analysis tools, as they really display the current market position. However, the Bill Williams indicators do not give specific signals for entering the trade, which qualitatively distinguishes them from other tools.
Bill Williams Indicators
The trader has developed several indicators, which are presently built into many trading platforms. These are such tools as Market Facilitation Index (MFI), Acceleration/Deceleration (AC), Alligator, Gator Oscillator (GO), Awesome Oscillator (AO), Filter AO, Fractal, and Williams %R.
The indicators in this set belong to different groups. For example, the Alligator is a trending algorithm based on Moving Average line readings. GO and AO belong to the group of oscillators and show price reversal points when the market is overheated. Fractal Price and Fractals are based on the fractal theory and are suitable for trading on fractals. Let's have a closer look at each of these tools and at how they can be used in forex trading.
Market Facilitation Index (MFI)
This tool shows the degree of asset price change per 1 tick. By the strength of price changes, we can judge the activity of buyers and sellers on the market.
When analyzing the MFI readings, one should take into account only the data of previous periods, as the indicator shows the level of price change based on the already formed candlesticks/balls.
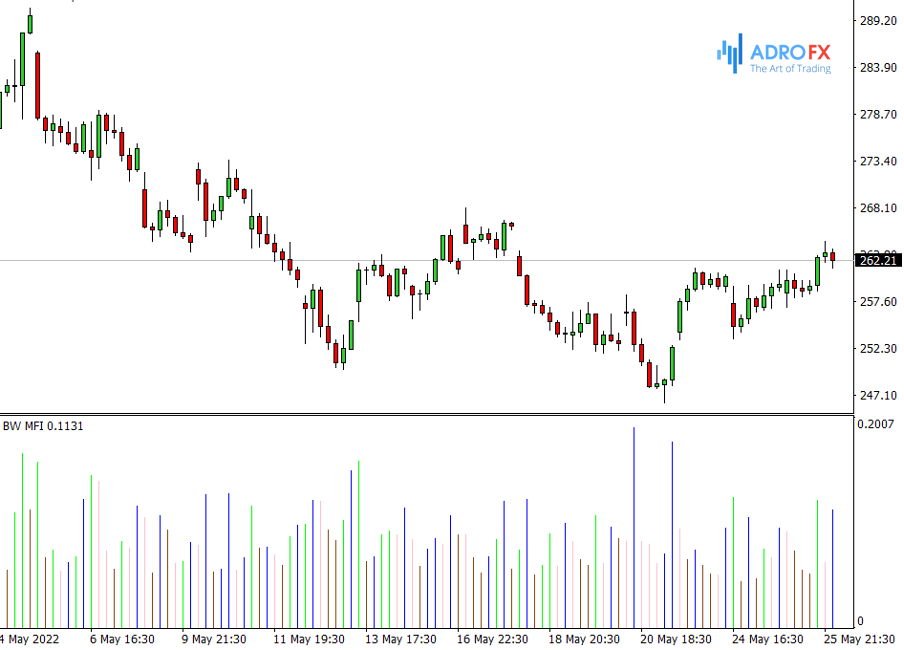
The tool is located in a separate panel under the work chart and has a form of a histogram with colored bars. Each bar shows the level of price change.
MFI signals:
A green bar indicates that market participants' activity is increasing along with trading volumes. This is usually a sign that a new trend is emerging.
A blue bar shows only an increase in the activity of market players. Trading volumes are down at this point.
The pink bar indicates an increase in trading volume only. Activity is decreasing. This is a clear signal of the weakening and fading of the current trend. It is high time to close all active positions and fix profits.
The brown bar indicates a decrease in the activity of players, as well as trading volumes. It is a sign that the market is quiet and is in waiting (flat). Usually, after such a lull, a strong price jump occurs, and a new trend begins.
The MFI indicator can be used as an addition to any trading strategy to control market volatility. The growth of volumes and activity is a confirmation of market entry. Conversely, when these indicators fall and the market goes flat, all trades should be closed.
Acceleration/Deceleration (AC)
AC indicator is used to measure the degree of deceleration and acceleration of price movement. The tool also has a form of a histogram and is located below the working chart. On the indicator panel, there are green and red columns, which move relative to the central zero level.
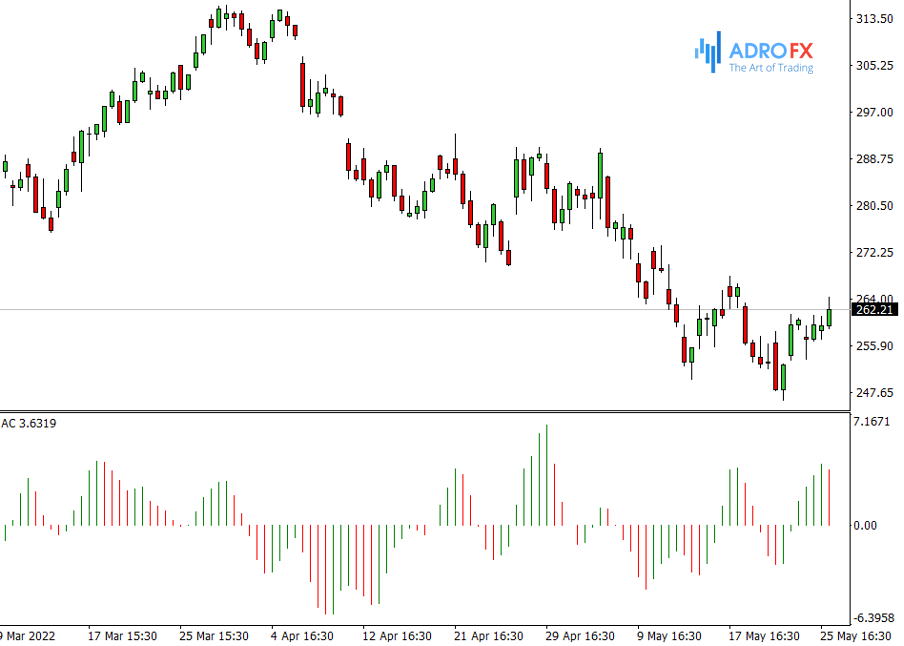
Note: The central level of the AC indicator is the point of equilibrium of driving forces. Do not confuse this indicator with MACD, where the crossing of the zero line indicates a change in the trend.
When working with the oscillator, you should be guided by the color of the bars and their position relative to the zero boundary. When the bars rise above the equilibrium point, only sell signals should be considered. In this case, you should wait until at least 3 bars appear on the bar chart, the values of which will gradually decrease, and only then open a position.
Falling bars below the equilibrium level indicate the possibility of opening a buy position. It is possible to enter the market only if at least 3 bars appear on the bar chart, the values of which are gradually increasing.
The Alligator Indicator
The Alligator indicator consists of three smoothed Moving Averages with different periods. The period of the first line is 13, the period of the second is 8, and the period of the third is 5. Calculations are performed by median prices. That is, the indicator first determines the minimum and maximum of the trading day, and then calculates their arithmetic average.
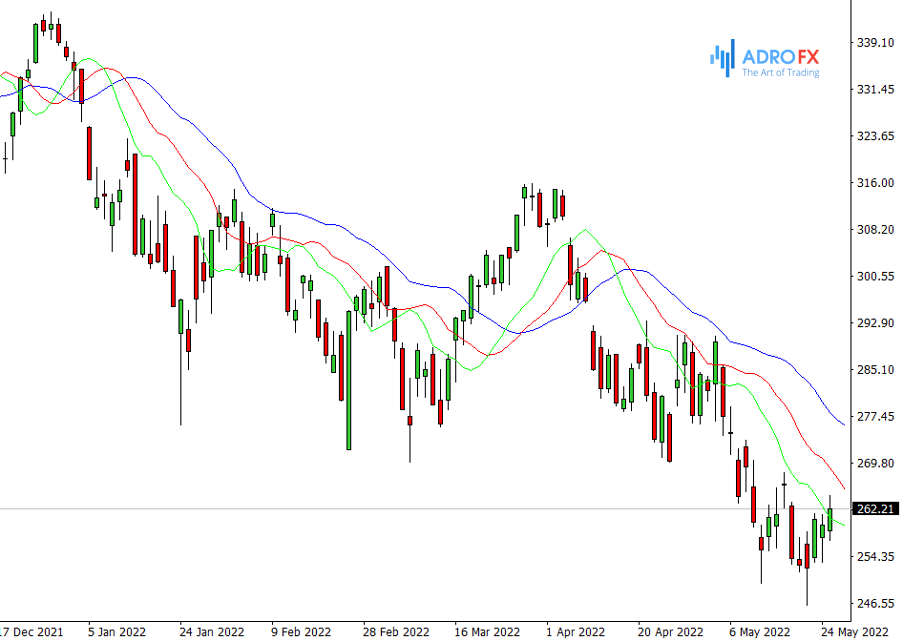
All lines are built with a slight shift. The first line (blue) is shifted by 8 bars, the second (red) by 5 bars, and the third (green) by 3 bars.
The indicator can be used to determine the volatility of the market, the transition of the chart into a flat, and the beginning of a new trend. Alligator's basic signals are:
- All three Moving Averages are intertwined with each other and move almost horizontally. This is a flat or lull in the market. The alligator is "sleeping".
- Moving Averages are beginning to diverge from each other, and the distance between them is increasing. This is a signal that the market volatility is increasing, and a new trend is beginning to emerge on the chart. If the lines are directed upwards, the trend is ascending; if they are directed downwards, the trend is descending. This situation is called "Alligator's awakening".
- The lines begin to get closer to each other, and the distance between them narrows. This is a sign of a decrease in market volatility. The trend fades, there is a lull or pause. The alligator "falls asleep".
The cycle repeats itself and so on to infinity.
The position of the lines relative to each other indicates the market direction, namely:
- Moving Averages are located from top to bottom in the following sequence - green, red, blue. This is a signal to buy, as the trend is bullish.
- The lines are in reverse order. The highest is the blue line, followed by red, and the lowest is green. This is a sell signal since the market is in a bearish trend.
Stop Loss is placed on the border of the nearest extreme Moving Average.
Gator Oscillator (GO)
We can say that it is an improved Alligator indicator, which is now plotted in a separate window from the chart and is no longer in the form of curves, but in the form of bars colored in green or red.
The main goal that Bill Williams pursued when creating this tool was to make it more understandable for traders and, at the same time, to systematize the work with the strategy. Now, you no longer have to look for the divergence of the three curves and think about whether it is there or not.
When the Gator Oscillator indicator has minimum or maximum values, it means that the lines are at a maximum distance from each other. When a red bar appears on the histogram of the oscillator, it means that the market is in a downtrend. Correspondingly, when a green bar appears on the oscillator indicates that the trend is positive.
The indicator is located in a separate window and consists of two histograms separated by a zero line. One is in the positive area, the other is in the negative area. The one above zero defines and shows the trader the absolute value of the current distance where the Alligator 13-period and 8-period Moving Averages (SMA) are located. The histogram, located under the zero line, calculates the absolute value of the interval between the 8-period and 5-period SMA.
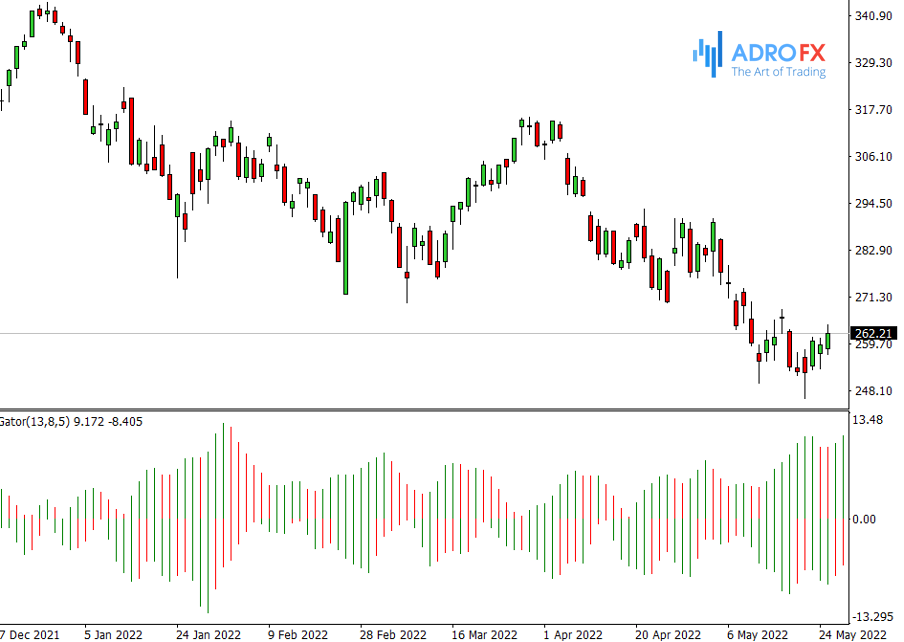
The bars of the histogram acquire a standard green or red color, depending on the difference between the values of the current and the previous reading. If the values decrease consistently, the histogram is red, if it increases, the color changes to green.
The Gator Oscillator clearly shows these periods to the trader. It is used in combination with Alligator and helps to visually identify its readings more accurately, especially when its signal lines are intertwined. With its help, it is convenient to determine the prospects of crossing the balance lines. It is recommended to open trades at the moment of growth of the histogram bars. The green color of the strongly elongated bar chart is considered a reliable signal to enter the market, which confirms the presence of a strong market trend. But it is recommended to give priority to the Alligator readings when placing orders.
Awesome Oscillator (AO)
Awesome Oscillator is an oscillator and shows the direction of market driving forces. This tool deserves a more detailed consideration, as its signals are similar to the Price Action signals.
The tool is located below the chart and looks like a histogram with green and red bars moving above and below the zero level. The bars form various shapes similar to the Price Action patterns (for example, Saucer).
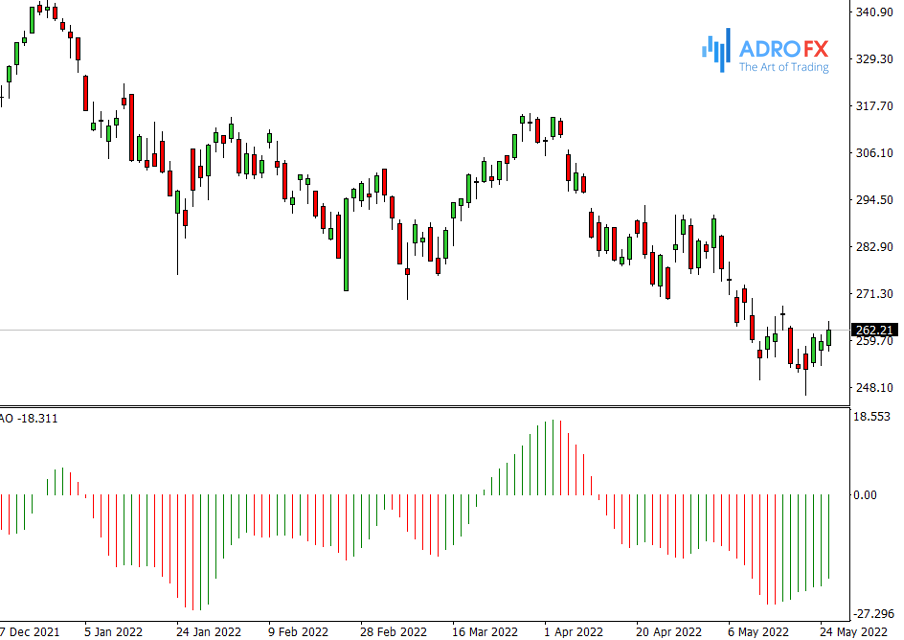
Awesome Oscillator gives standard signals similar to those of a classic MACD. For example, if there are two bars on the chart, the first of which is under the zero line and the second bar crosses it from below and rises above it, this is a signal to buy. And vice versa, if the bars have shifted under the zero level, it is a signal to sell.
Filter AO
The Filter AO is used mainly in flat market to filter signals from other indicators. Its calculation algorithm is not similar to the classical Bill Williams indicators, though the tool looks very much like the Awesome Oscillator described above. It also consists of a two-color histogram and one central level.
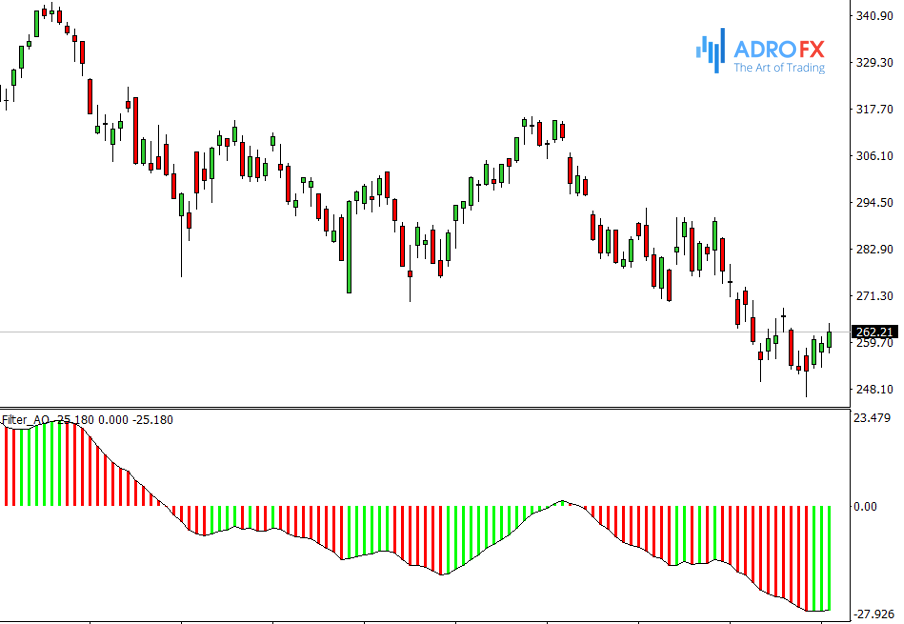
The main type of signal produced by Filter AO is a histogram crossing the zero line:
- Bars appeared above the level — a buy signal;
- Bars appeared under the level — a sell signal.
The tool is useful for determining the flat on the chart. If the price is near the zero line for several bars, it is a signal that there is a flat in the market. Consequently, it is not recommended to open new trades during such periods.
Fractal
Fractal is a classic indicator, which is a part of the famous Bill Williams trading system. Fractals indicator analyzes price figures, which are formed on the candlestick chart and show the reversal points of the market trend. Fractals can be used in almost any time frame, with the results being more reliable in the higher ones. The author himself advises using this tool in combination with Alligator.
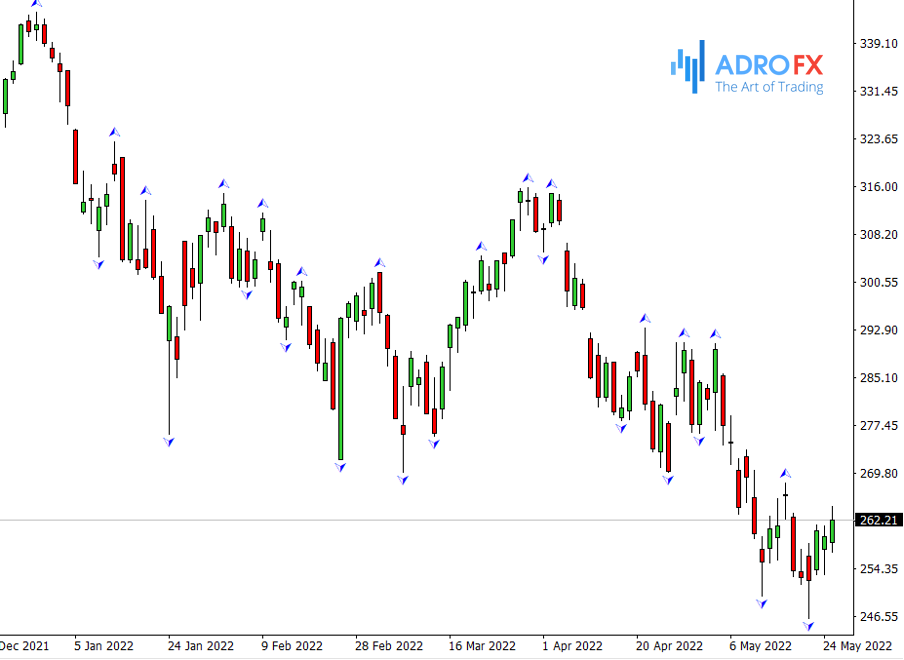
The Williams' Fractal indicator consists of the candlesticks, the middle of which is either the highest ("fractal up") or the lowest ("fractal down"). In the first case, the first two bars are formed first, with the second one being higher than the first one. The level of the third candle is even higher, and then it goes downwards one by one. This figure is also called a fractal to sell. Similarly, the indicator fractals to buy is formed, only here initially there is a decrease and then an increase.
The main condition is that the central bar is higher/lower than all the others. Its value will be the value of the fractal. If the number of candlesticks is paired, the center is considered to be the later maximum/minimum. Bars can participate in the formation of two figures at the same time.
You should wait for the last candle to close before making a decision based on the fractal. There is always a risk that during its formation there will be a price maneuver, as a result of which a figure not corresponding to the basic condition will be formed. Only after making sure that the fractal took place, it is possible to begin to work with it.
According to the classical strategy, a trader should enter the market when the price breaks out of the nearest fractal. One can work using both pending orders and market orders. The pending orders are placed at a distance of one point from the point formed by the indicator. If the trade is carried out according to the market, the orders are opened when the price reaches the fractal and leaves it on one or two points. The maximums and minimums shown by the indicator on the chart are recommended to be taken as points that form the support and resistance lines. The price overcoming these levels informs about the necessity of placing an order in the direction of the breakout. Therefore, position traders often use Fractal indicator in their strategies.
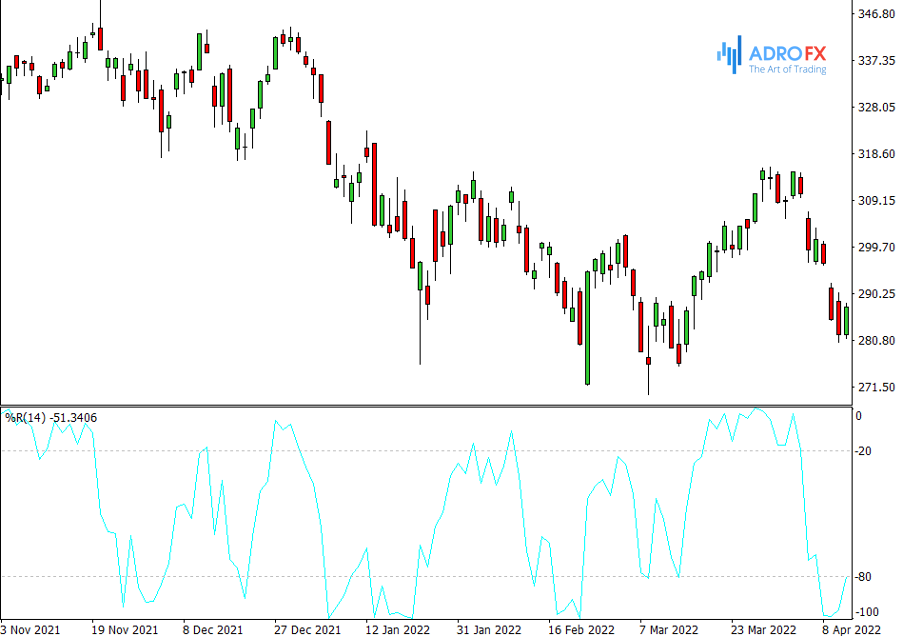
Williams %R
Williams %R is a handy technical indicator used to determine if the market is oversold/oversold. The analysis is based on studying the position of the current closing price in the range formed by extrema of past periods.
Williams %R uses the theoretical idea that price is an indicator of market equilibrium at a given time.
The highest price for the period characterizes the maximum strength of buyers, and the lowest one — is the maximum strength of sellers. The closing price of the period will show which group of participants ("bulls" or "bears") was stronger.
Williams %R compares each closing price to the last trading range and estimates the probability: either the buyers will "stop" the price at the high of the range, all the bears will be stronger and the market will close closer to the minimum price.
If the uptrend has closed away from the peak, it means that the buyers' position is weaker than thought, and it is worth thinking about selling.
If the trend is going downward, but the "bears" did not manage to keep the price near the minimum, you can talk about the sellers' weakening, and you should start looking for the opportunity to buy.
The Williams %R indicator will be near the zero level if the closing price and the maximum of the range are close to each other. If the price is almost the same as the low, the line will be near the -100 level.
The percentage range is calculated on a principle similar to the Stochastic oscillator. The result is the ratio of the closing price difference of the maximum to the closing price difference of the minimum for a certain period multiplied by -100. Thus, the indicator values may lie only in the negative area from -100 to 0.
- The overbought area range from -20 to 0.
- The oversold area is between -100 and -80.
The indicator period can be any, depending on the individual characteristics of the asset and the trader's preferences. The optimal number is 14, which is perfect for both hourly and daily time frames, as well as for W1 and MN.
Conclusion
The Williams indicators are an effective tool for technical analysis. They can be used in a trading strategy as one of the basic elements. When using it, one should keep in mind that indicators, based on Moving Averages, often generate lagging signals. This fact should be taken into consideration when developing a trading strategy.
About AdroFx
Established in 2018, AdroFx is known for its high technology and its ability to deliver high-quality brokerage services in more than 200 countries around the world. AdroFx makes every effort to keep its customers satisfied and to meet all the trading needs of any trader. With the five types of trading accounts, we have all it takes to fit any traders` needs and styles. The company provides access to 115+ trading instruments, including currencies, metals, stocks, and cryptocurrencies, which make it possible to make the most out of trading on the financial markets. Considering all of the above, AdroFx is the perfect variant for anyone who doesn't settle for less than the best.
Related Articles

Latest updates
Latest updates


Technical Analysis
Latest updates


