Wall Street Hits New Highs as Tech Stocks Rally Amid Earnings and Economic Data Anticipation | Daily Market Analysis

Key events:
- UK - Employment Change 3M/3M (MoM) (Aug)
- UK - Unemployment Rate (Aug)
- USA - FOMC Member Daly Speaks
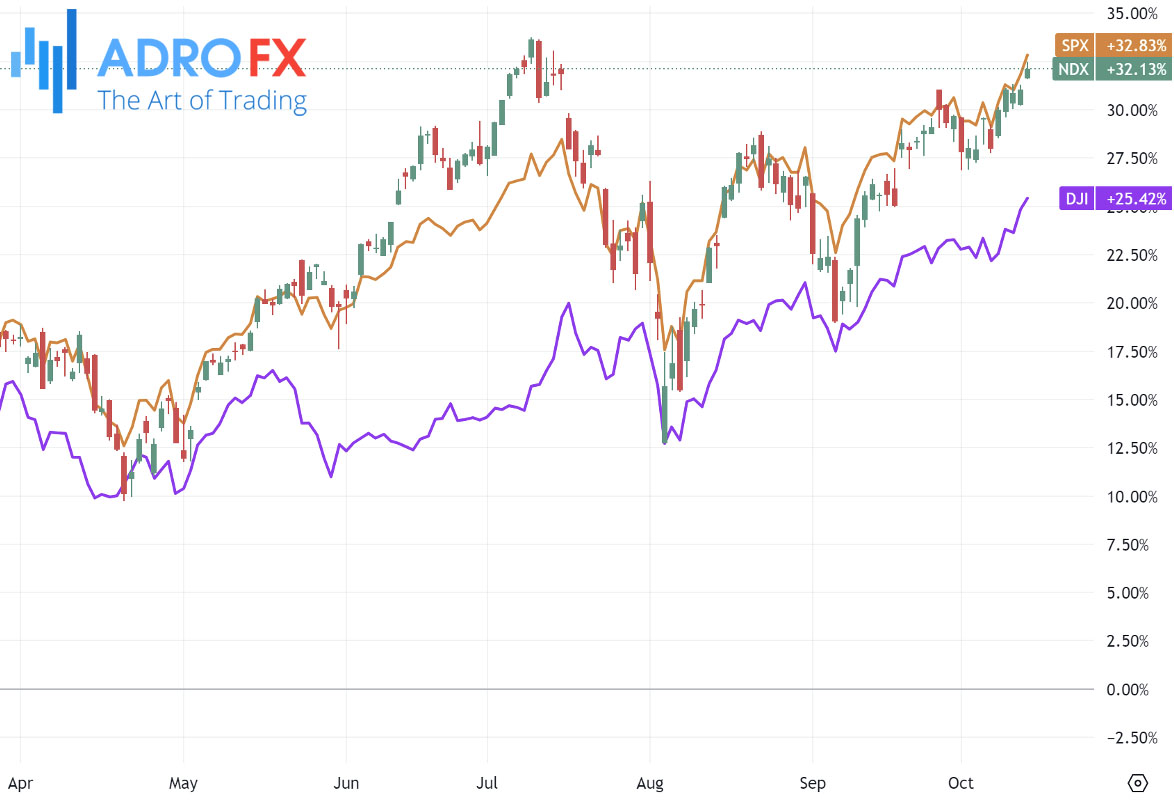
Wall Street moved higher on Monday, with the S&P 500 and Dow Jones reaching new intraday record highs as technology stocks rallied ahead of a week filled with corporate earnings reports and key economic data.
The influx of earnings results from major US companies will provide investors with insights into the economy's strength and whether stock valuations, which are at elevated levels, can be sustained.
Market participants are also watching economic data closely, as it could influence the Federal Reserve's stance on its interest rate-cutting strategy, a central focus this year.
Although trading volume was somewhat lighter due to the bond market closure for a federal holiday, US stocks continued their upward trend from Friday when both the S&P 500 and Dow closed at record highs after positive third-quarter earnings reports from major banks.
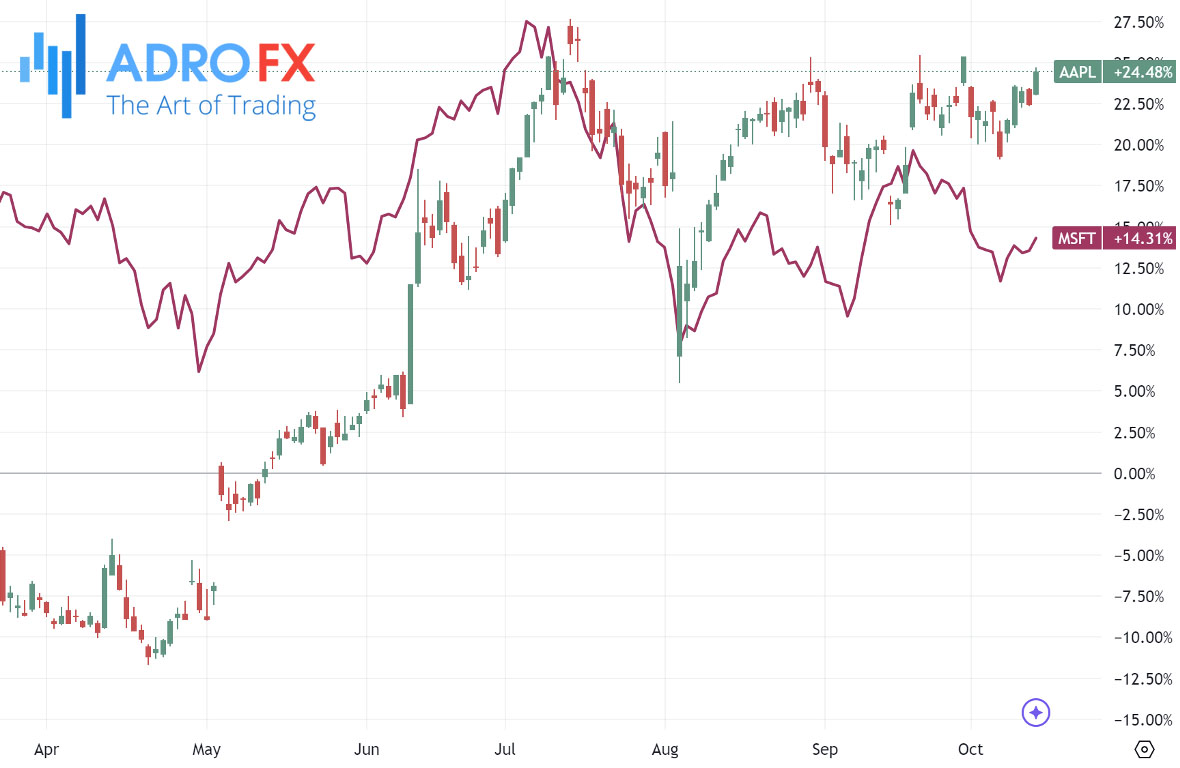
Monday’s gains were led by semiconductor stocks, with the chip index rising 1.8% to hit a two-month high, driven by Nvidia's (NASDAQ: NVDA) 2.9% climb. Other tech giants like Apple (NASDAQ: AAPL) and Microsoft (NASDAQ: MSFT) also rose, gaining 1.2% and 0.8%, respectively.
The upbeat bank earnings have fueled optimism that strong corporate results could further support the impressive market performance in 2024. However, with the S&P 500 trading at 21.8 times forward earnings - well above the long-term average of 15.7 - companies may face challenges in meeting investor expectations.
The Australian Dollar remains under pressure against the US Dollar on Tuesday, following disappointing trade balance data from China, Australia's largest trading partner. Released on Monday, the weak figures, along with uncertainty over China’s recently announced fiscal stimulus plan, failed to provide support for the Aussie Dollar.
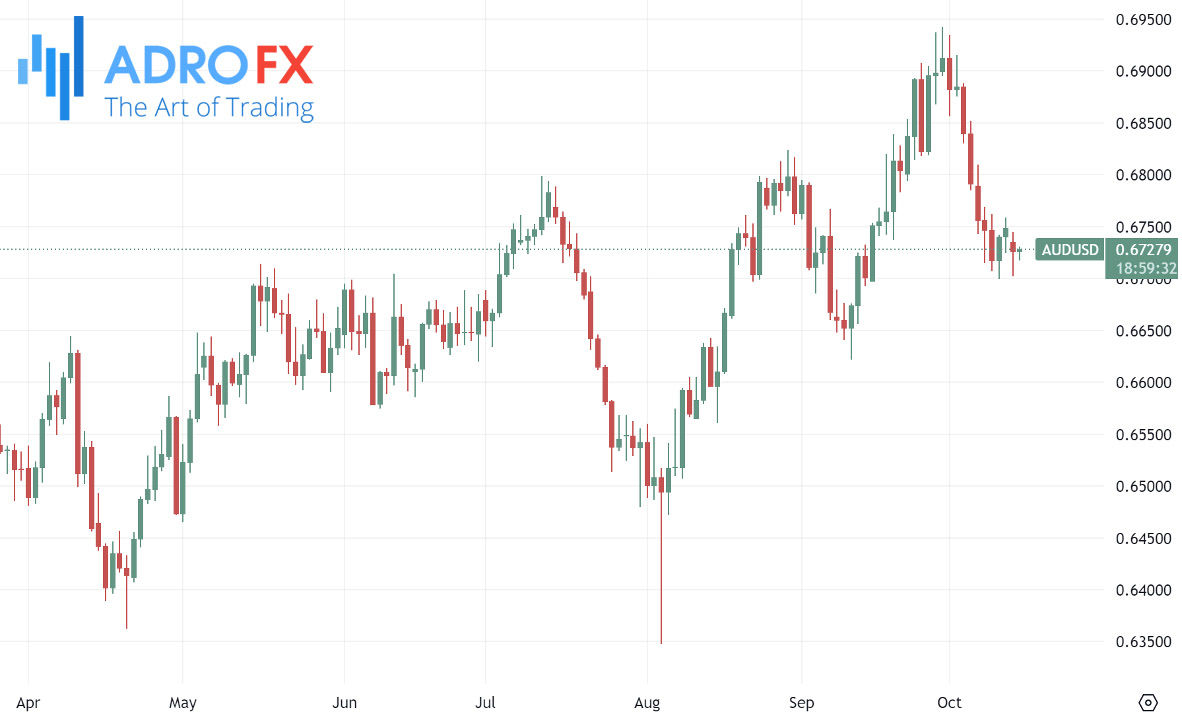
The Australian Consumer Confidence survey showed little movement this week, with the ANZ-Roy Morgan index holding steady at 83.4. Despite this unchanged figure, Consumer Confidence has remained below 85.0 for a record-breaking 89 weeks. Currently, it stands just above the 2024 weekly average of 82.1, indicating ongoing pessimism among consumers.
In contrast, the Japanese Yen gained some ground against the US Dollar during the Asian session, recovering from Monday’s losses that pushed the pair toward the key 150.00 level - its lowest since early August. However, further upside for the Yen seems limited due to uncertainty surrounding the Bank of Japan’s rate-hike plans and a risk-on market environment that curtails the appeal of the safe-haven currency.
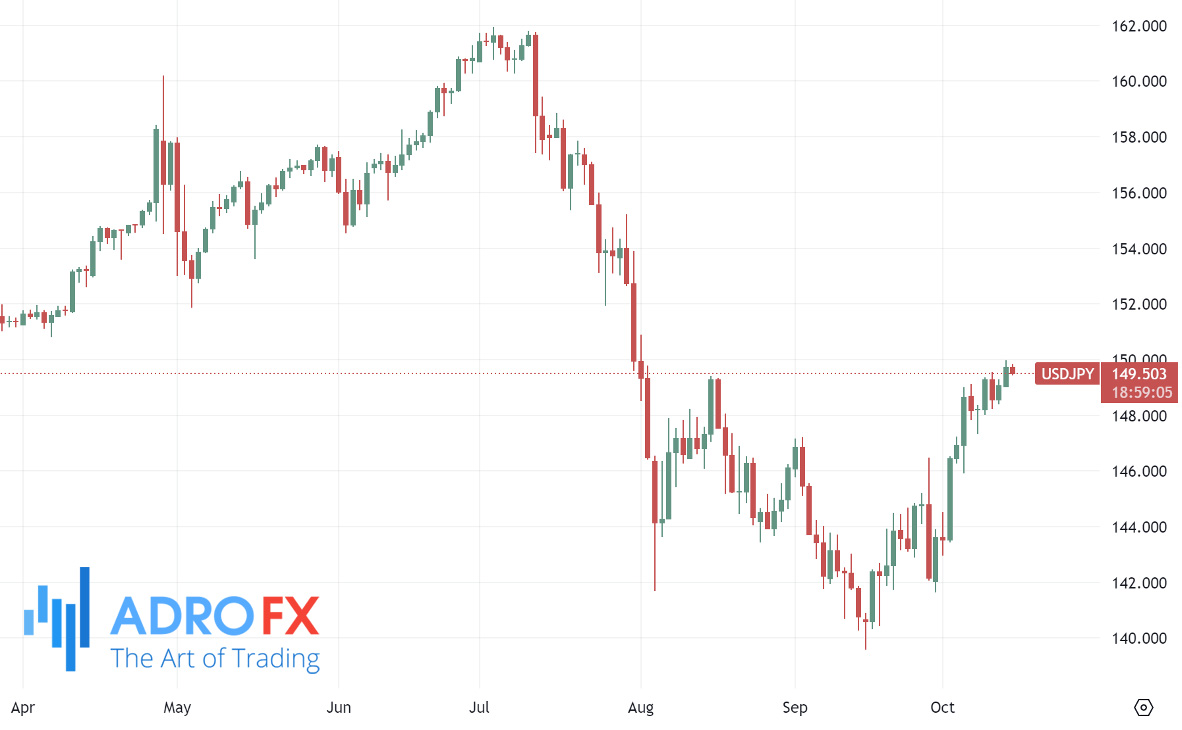
Meanwhile, traders have scaled back expectations for another large rate cut from the Federal Reserve in November, which has driven up US Treasury yields and kept the US Dollar near a two-month high. This strength in the Greenback could continue to weigh on the JPY, making any significant declines in USD/JPY likely to attract buying interest and limiting further downside for the pair.
Gold prices retraced after reaching a daily high of $2,666 on Monday, pressured by the lack of a clear boost from China’s stimulus efforts and the ongoing strength of the US Dollar. XAU/USD is trading around $2,650, down 0.26% at the time of writing.
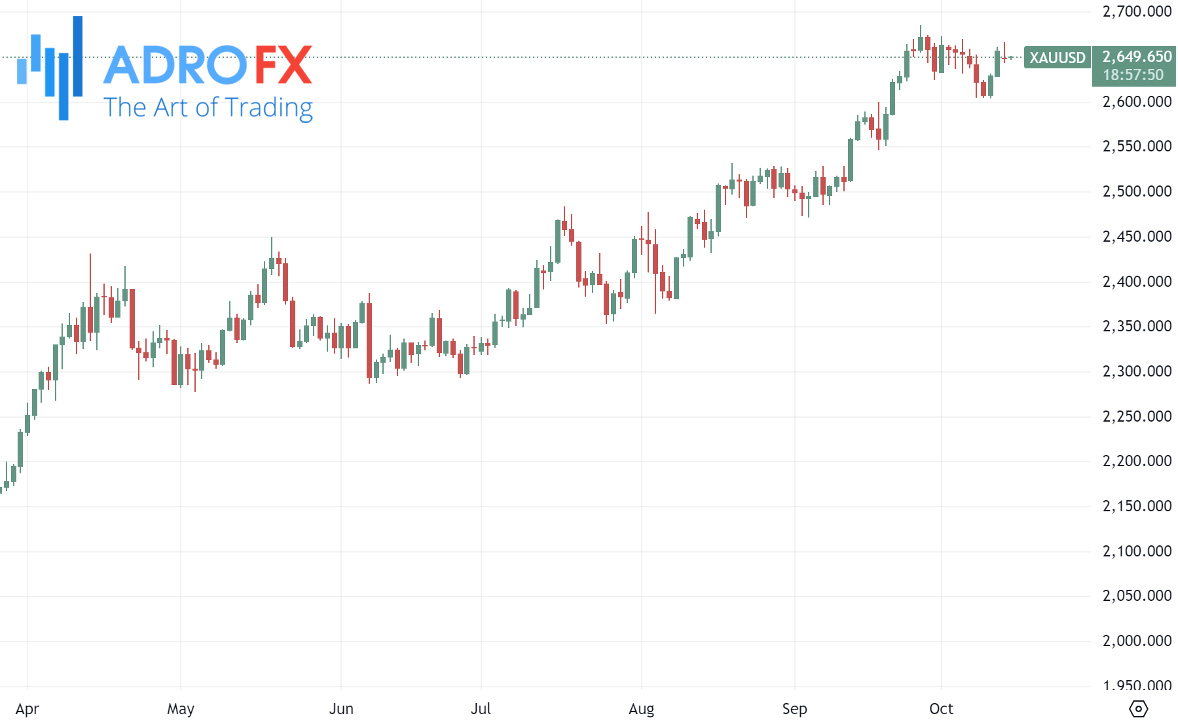
Over the weekend, China’s economic outlook was further clouded by data showing deflationary risks, which could hinder the country’s ability to meet its 5% GDP growth target. In response, China’s Finance Minister Lan Foan announced continued stimulus measures, including support for the property market and efforts to bolster state bank capital.
EUR/USD kicked off the week with renewed losses, hitting a fresh ten-week low as the Euro fell by 0.25% against the US Dollar. The pair dipped to the 200-day Exponential Moving Average (EMA), pressured by the Greenback’s strength and broader Euro weakness.
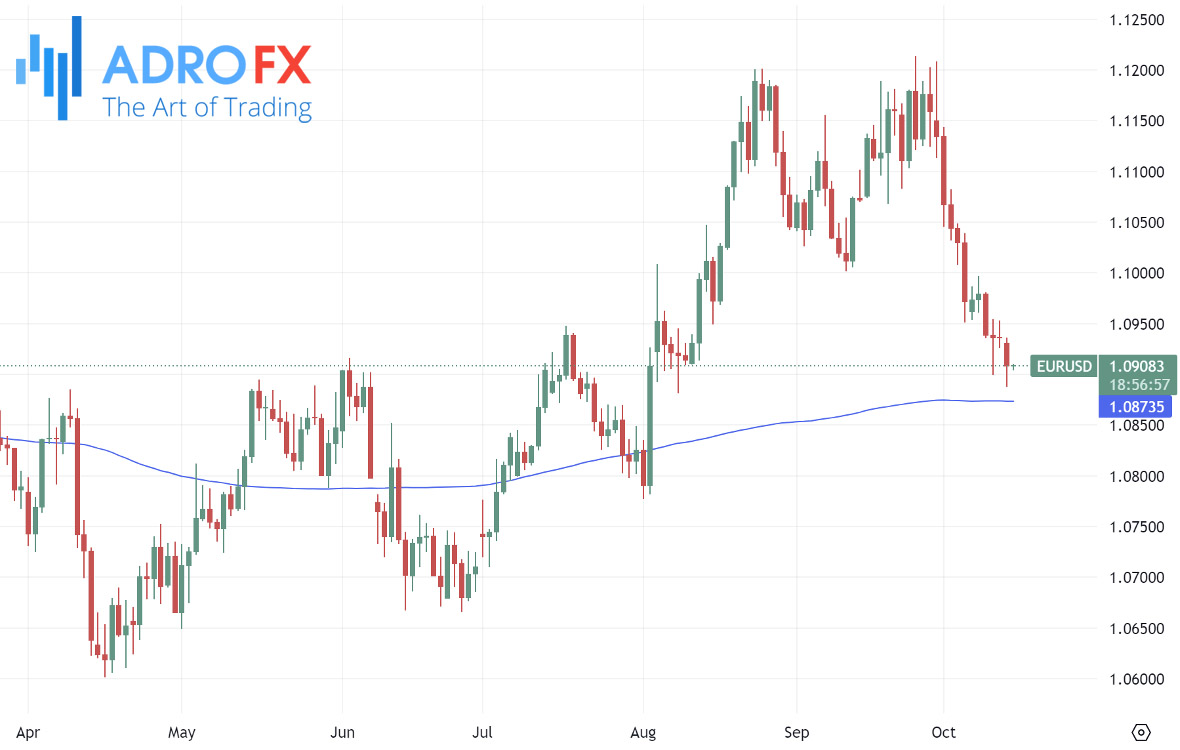
Investors will be watching the European Central Bank Lending Survey results on Tuesday for insights into the health of the European banking sector. Additionally, final European Harmonized Index of Consumer Prices (HICP) inflation figures are due on Thursday, although they are unlikely to spark significant volatility as markets anticipate a 25 basis point rate cut from the ECB later that day.
On the US side, markets are awaiting Thursday’s retail sales report, which is expected to show a 0.3% month-over-month rise for September, up from the 0.1% increase seen in August.
Related Articles


Latest updates
Latest updates


Technical Analysis
Latest updates


