US Treasury Yields Soar to 10-Year High, Nasdaq Surges Over 1%, and European Equities Rebound Amid Fed Meeting Anticipation | Daily Market Analysis
Key events:
- USA - Existing Home Sales (Jul)
US Treasury yields reached their highest point in a decade, European equities rebounded from a six-week low, and the Nasdaq surged over 1% on Monday, with investors anticipating the upcoming Federal Reserve meeting in Jackson Hole, Wyoming, scheduled for Friday.
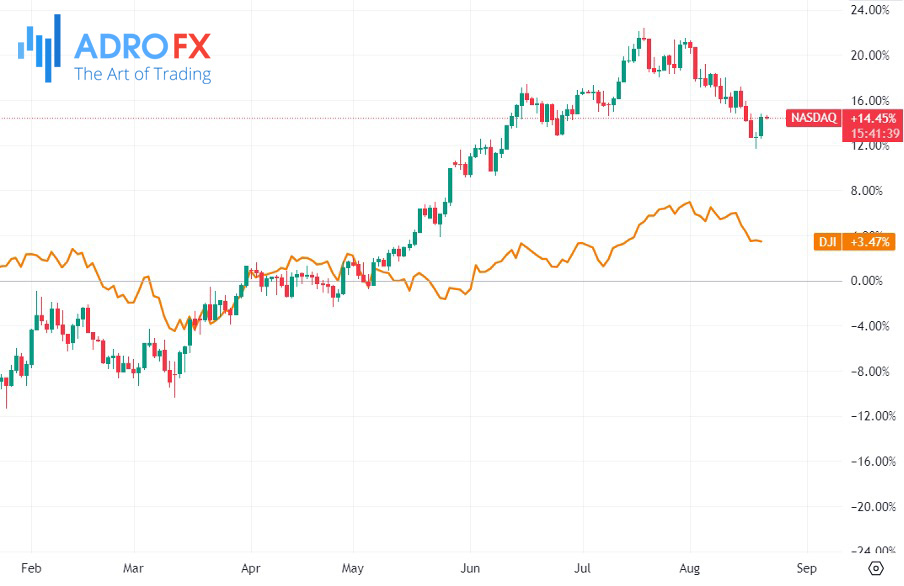
The trading session on Wall Street displayed mixed results: the Dow Jones Industrial and the S&P 500 relinquished their early gains, while the technology-focused Nasdaq Composite ascended, buoyed by optimism surrounding earnings.
Although benchmark oil futures initially surged by over $1 per barrel, they closed lower due to diminishing expectations for Chinese demand.
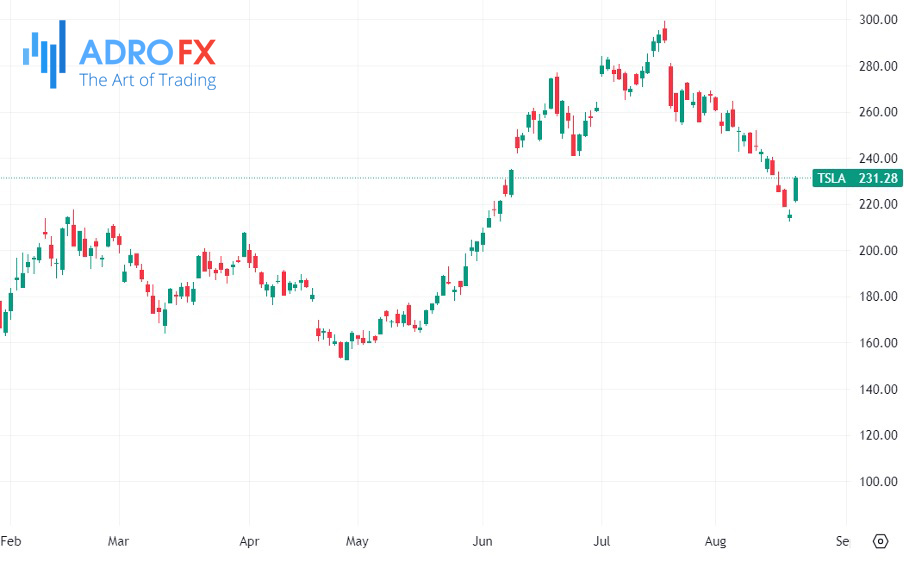
Tesla Inc (NASDAQ: TSLA) saw a notable surge of over 7% as investors capitalized on a recent dip in the electric vehicle manufacturer, encouraged by positive sentiments expressed by Wall Street.
Baird, in particular, placed Tesla on its 'best ideas' list, highlighting multiple favorable factors such as the impending Cybertruck launch, increased adoption of self-driving software, and ongoing growth in the energy sector. These potential tailwinds have the potential to overshadow concerns related to slightly softer margins resulting from recent price reductions.
Currently, the stock market appears unperturbed by the uptick in yields. The S&P 500 index demonstrated an upward trend on Monday, buoyed by gains across the "big 7" Tech stocks. Notably, AI-driven company Nvidia led the charge, with raised targets. The forthcoming release of Nvidia's report on Wednesday assumes significant importance, as it will serve as a litmus test to ascertain the validity of the existing level of AI enthusiasm.
Projections concerning the Fed Funds rate suggest a likelihood of maintaining relative stability until at least May of the upcoming year. However, it's crucial to acknowledge that while market forecasts hold value, they aren't infallible. The collective wisdom of the crowd is insightful, though prone to errors. Nevertheless, it remains the most dependable estimate at our disposal. Moreover, if short-term interest rates have indeed plateaued, it's plausible that long-term rates have mirrored this pattern.
Should this theory materialize, it would denote a shift in which earnings take center stage as the pivotal metric impacting stock prices, overshadowing the sway of interest rates. In this context, Nvidia's upcoming report holds substantial significance as a key indicator.
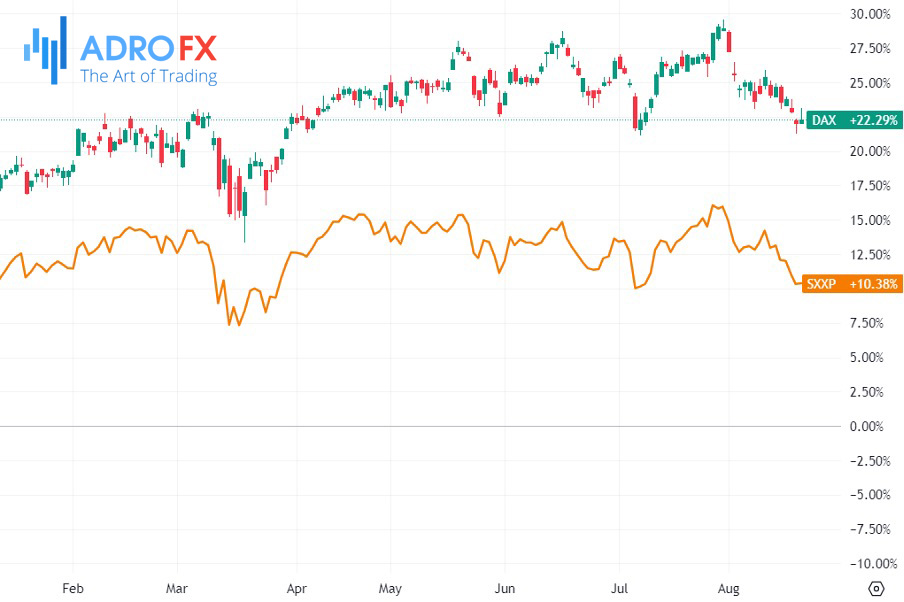
Across Europe, the pan-European STOXX 600 closed higher, recovering from Friday's six-week low by posting gains, especially in the energy and mining sectors, which mirrored the upward movement in prices of crude oil and metals.
Germany's DAX index rose by 0.2%, despite official data revealing a larger-than-anticipated decline in German producer prices for July.
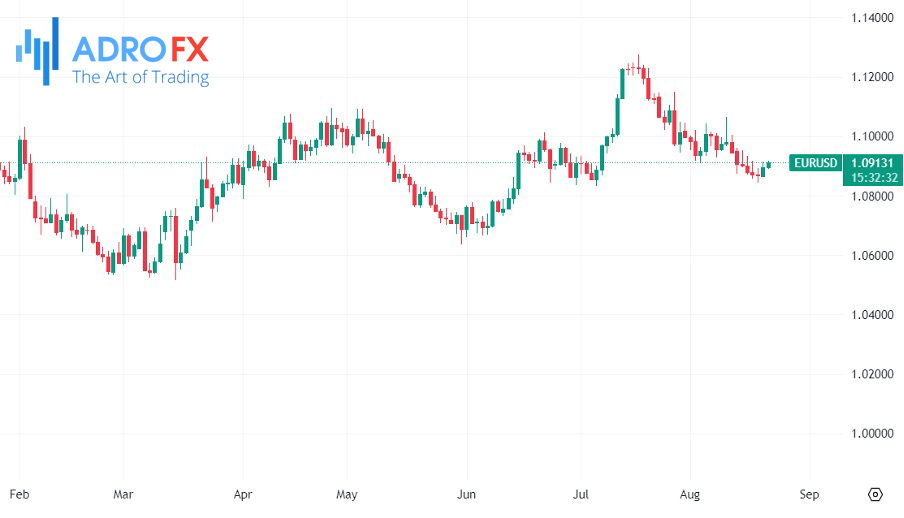
On the currency front, the European single currency experienced a 0.2% increase, reaching $1.0892, while the dollar index, measuring the strength of the greenback against a basket of major trading partner currencies, edged lower to 103.35.
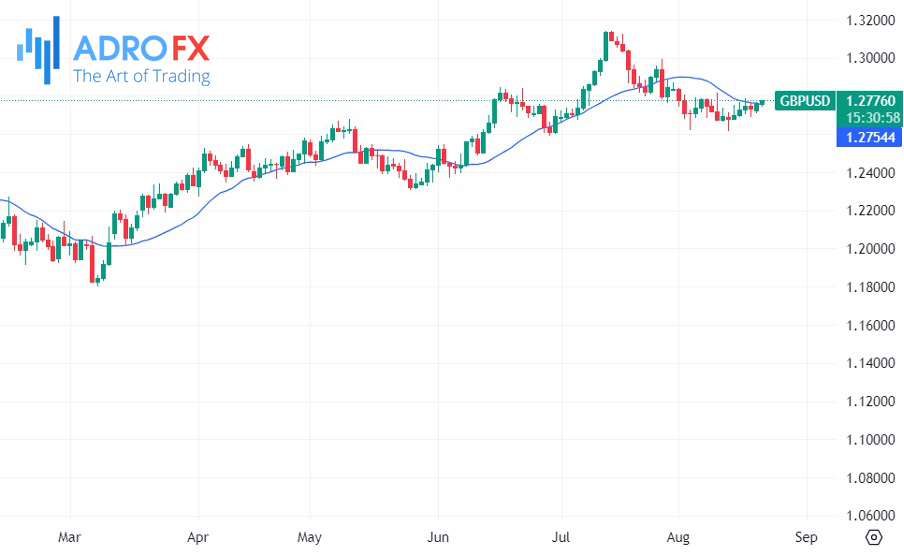
Moreover, the British pound tested the upper boundary of its range at $1.26-$1.28, but the dollar's overall resilience prevented a breakthrough. Subsequently, the pound retreated to around $1.2690 and consolidated before the weekend. To kick off the current week, it is trading within a narrow band ($1.2710-$1.2750) that falls within the range of last Friday's trading. A close above the 20-day moving average ($1.2760)—an achievement not accomplished since July 26—could potentially signal another attempt to breach the upper boundary of the range.
Gold prices experienced a slight uptick on Tuesday, finding relief from a weakened dollar that retreated from its two-month highs. However, apprehensions about higher US interest rates continued to cast a shadow over the outlook for metal markets.
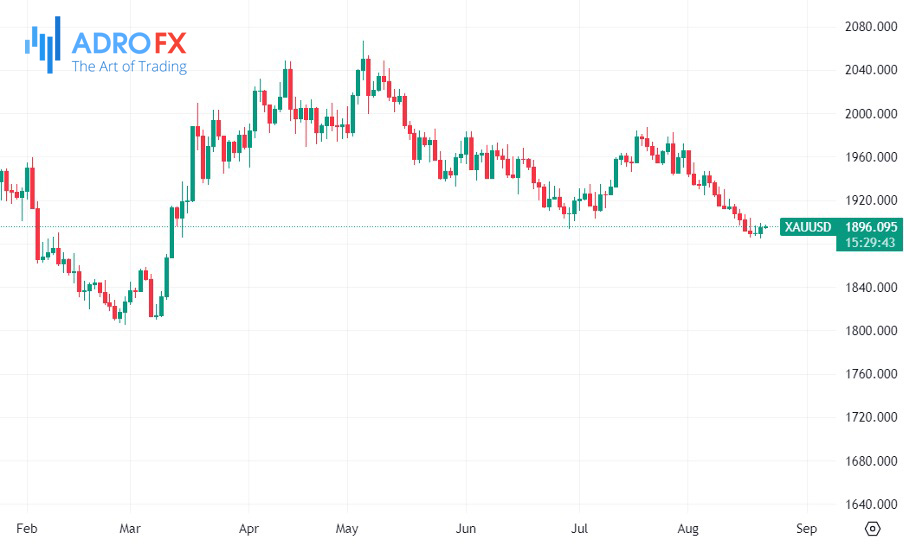
After encountering a dip to a five-month low earlier this month, the yellow metal displayed signs of recovery. Despite this, spot prices have struggled to regain the crucial $2,000 per ounce level and are yet to make a convincing breakthrough.
Related Articles

Latest updates
Latest updates


Technical Analysis
Latest updates


