Tech Stocks Drag S&P 500 Lower Amid Fed Meeting and Anticipated Big Tech Earnings | Daily Market Analysis

Key events:
- China - Manufacturing PMI (Jul)
- Japan - BoJ Interest Rate Decision
- Eurozone - CPI (YoY) (Jul)
- USA - ADP Nonfarm Employment Change (Jul)
- USA - Chicago PMI (Jul)
- USA - Crude Oil Inventories
- USA - FOMC Statement
- USA - Fed Interest Rate Decision
- USA - FOMC Press Conference
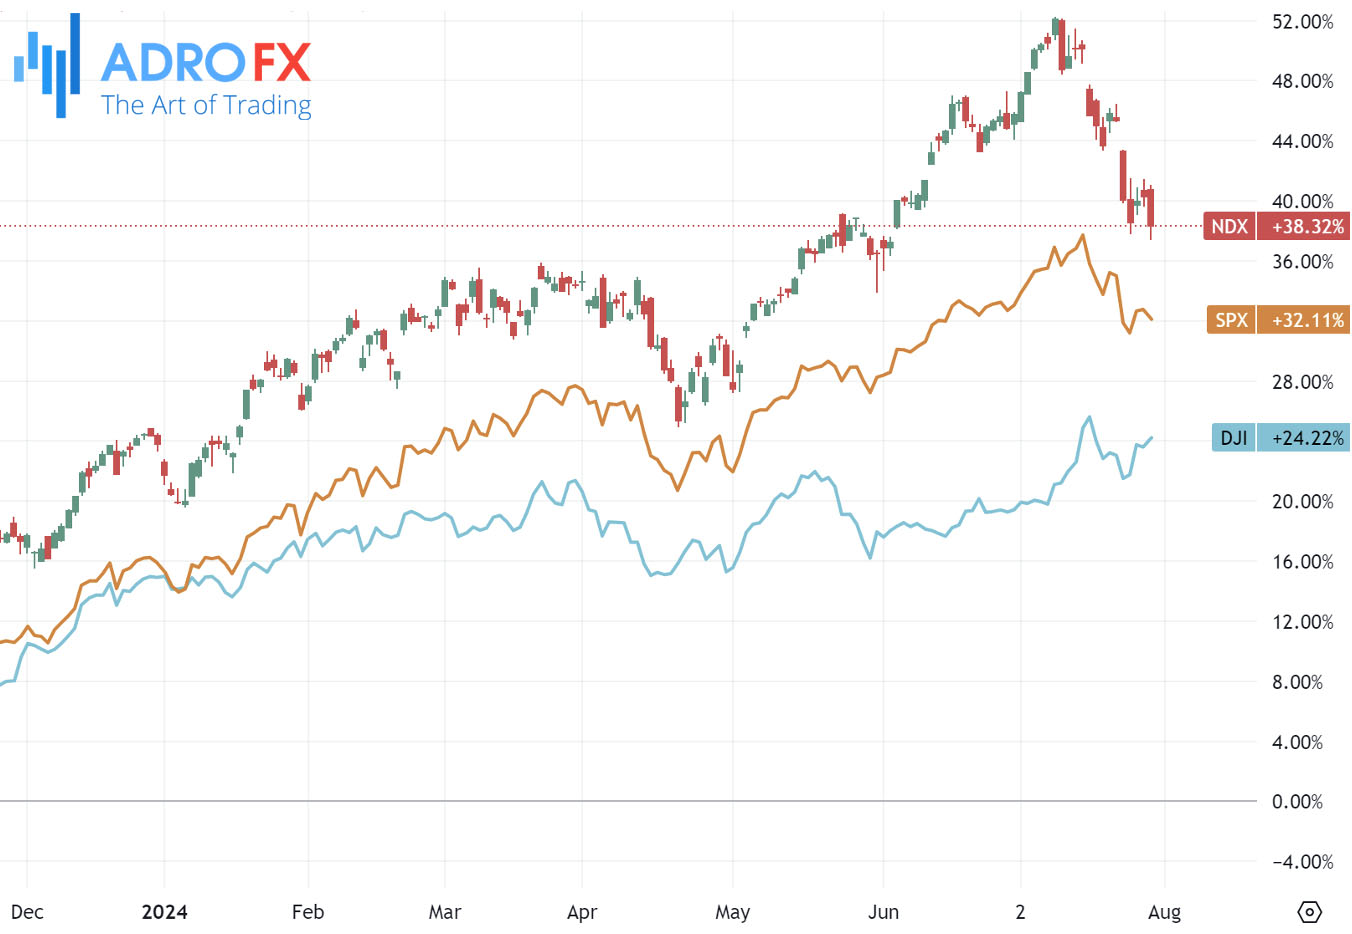
The S&P 500 ended Tuesday in the red, primarily dragged down by the tech sector amid cautious trading as the Federal Reserve commenced its two-day meeting and investors anticipated more earnings reports from major tech companies.
The S&P 500 dropped 0.5%, and the NASDAQ Composite decreased by 1.3%, while the Dow Jones Industrial Average gained 205 points, or 0.5%. Tech stocks led the decline, with NVIDIA Corporation falling 7%, as the sector continued to experience a rotation out of tech.
Significant earnings reports are expected throughout the week, beginning with Microsoft releasing its June quarter results after the market closed on Tuesday.
Microsoft's earnings report will be scrutinized to "gauge the adoption of the AI Revolution, as Microsoft and Nvidia are the two best indicators in technology for the pace of global AI adoption," Wedbush stated earlier this week.
Additionally, tech giants Meta Platforms and Apple are scheduled to announce their earnings on Wednesday and Thursday, respectively.
Gold prices experience some dip-buying after a brief decline to the $2,400 area, turning positive for the second consecutive day on Wednesday. The third rise in four days is driven by multiple factors, pushing the commodity to a one-week high of around $2,419 during the Asian session. The Israeli attack on Lebanon's capital in response to a rocket strike in the Golan Heights on Saturday has heightened geopolitical tensions in the Middle East.
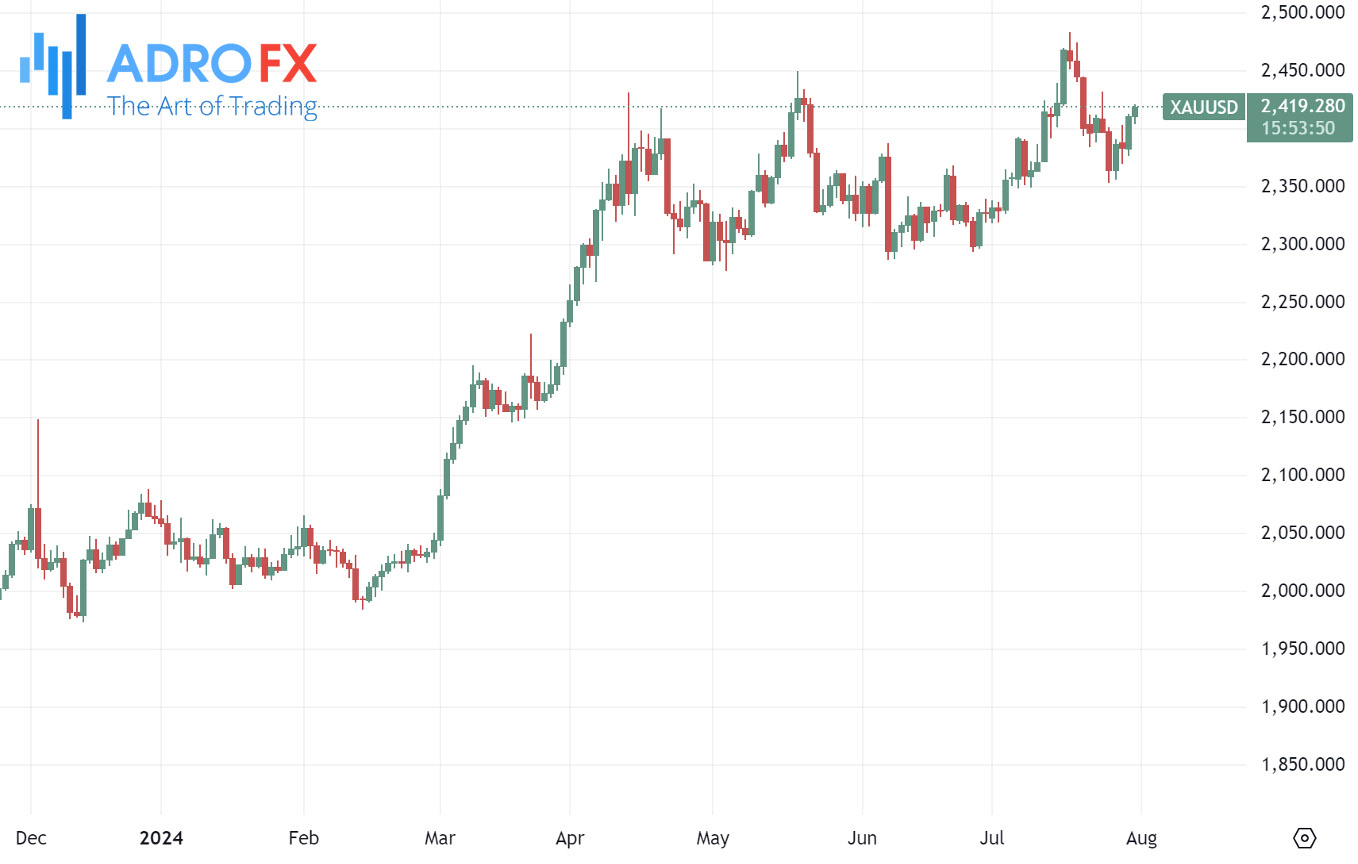
Additionally, a sluggish global economic growth outlook and a pullback of the US Dollar from a nearly three-week high reached on Tuesday support the gold price. However, bulls may hold off on aggressive bets, awaiting more clarity on the Federal Reserve's rate-cut trajectory. The focus remains on the outcome of the Federal Open Market Committee meeting concluding later today, along with geopolitical developments, which will determine the near-term direction for XAU/USD.
The Australian Dollar declined relative to the US Dollar following the release of mixed Consumer Price Index data on Wednesday. This report offers insights into the potential future actions of the Reserve Bank of Australia regarding monetary policy. The inflation figures have led to increased speculation that the RBA might maintain its current interest rates at the upcoming policy meeting. Nonetheless, economists caution that additional rate hikes could threaten Australia's economic recovery.
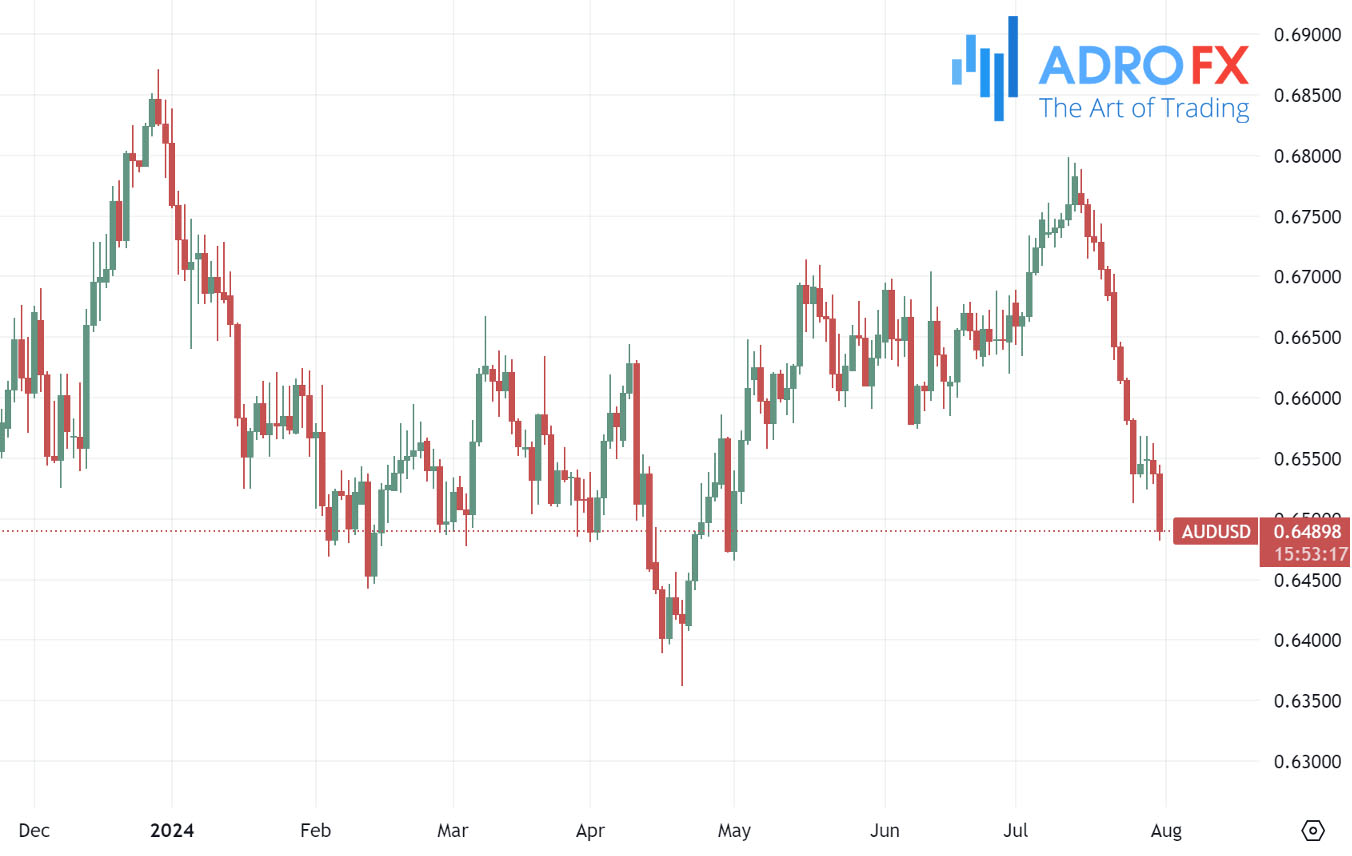
The NBS Manufacturing PMI for July was reported at 49.4, slightly above the expected 49.3 but below the previous 49.5. The Non-Manufacturing PMI met expectations at 50.2. Given the significant influence of the Chinese economy on the Australian market, these PMI figures are especially critical.
Despite potential challenges, the downside for the AUD/USD pair might be limited due to uncertainties surrounding the US Dollar ahead of the Federal Reserve's interest rate decision on Wednesday.
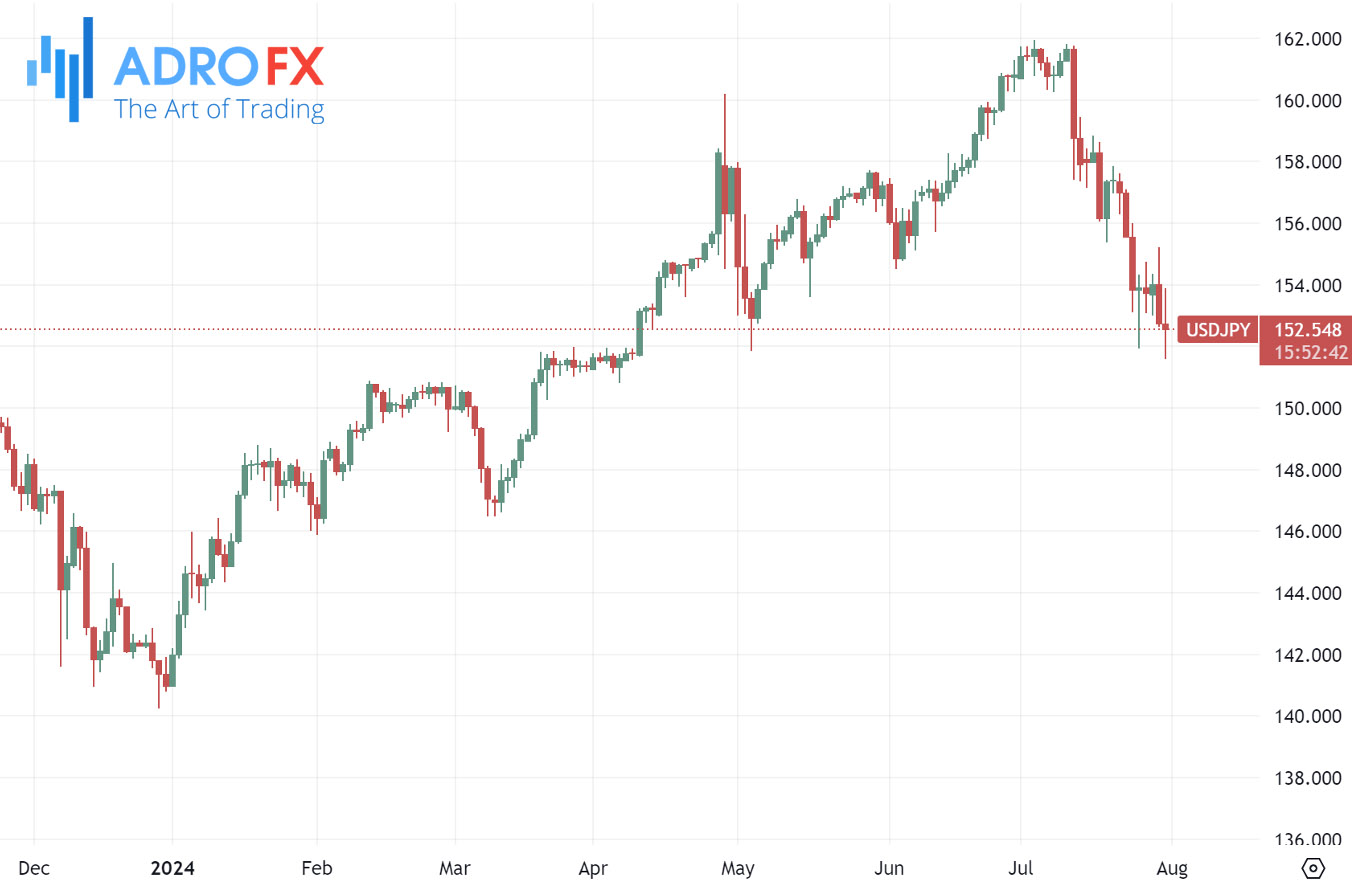
Meanwhile, the Japanese Yen weakened against the US Dollar even though Bank of Japan board members decided to raise the short-term rate target by 15 basis points from 0%-0.1% to 0.15%-0.25% after their two-day monetary policy review on Wednesday. Additionally, the BoJ announced plans to reduce Japanese government bond purchases to ¥3 trillion per month starting in the first quarter of 2026.
The NZD/USD pair continues its recovery, trading around 0.5915 during the Asian session on Wednesday. This upward movement follows stronger-than-expected Chinese Manufacturing Purchasing Managers' Index data for July. The National Bureau of Statistics reported that China's Manufacturing PMI decreased to 49.4 in July from 49.5 in June, surpassing the forecast of 49.3. Concurrently, the NBS Non-Manufacturing PMI fell to 50.2 in July from 50.5, aligning with market expectations. These better-than-expected Chinese PMI figures bolster the New Zealand Dollar, given China's importance as a key trading partner for New Zealand.
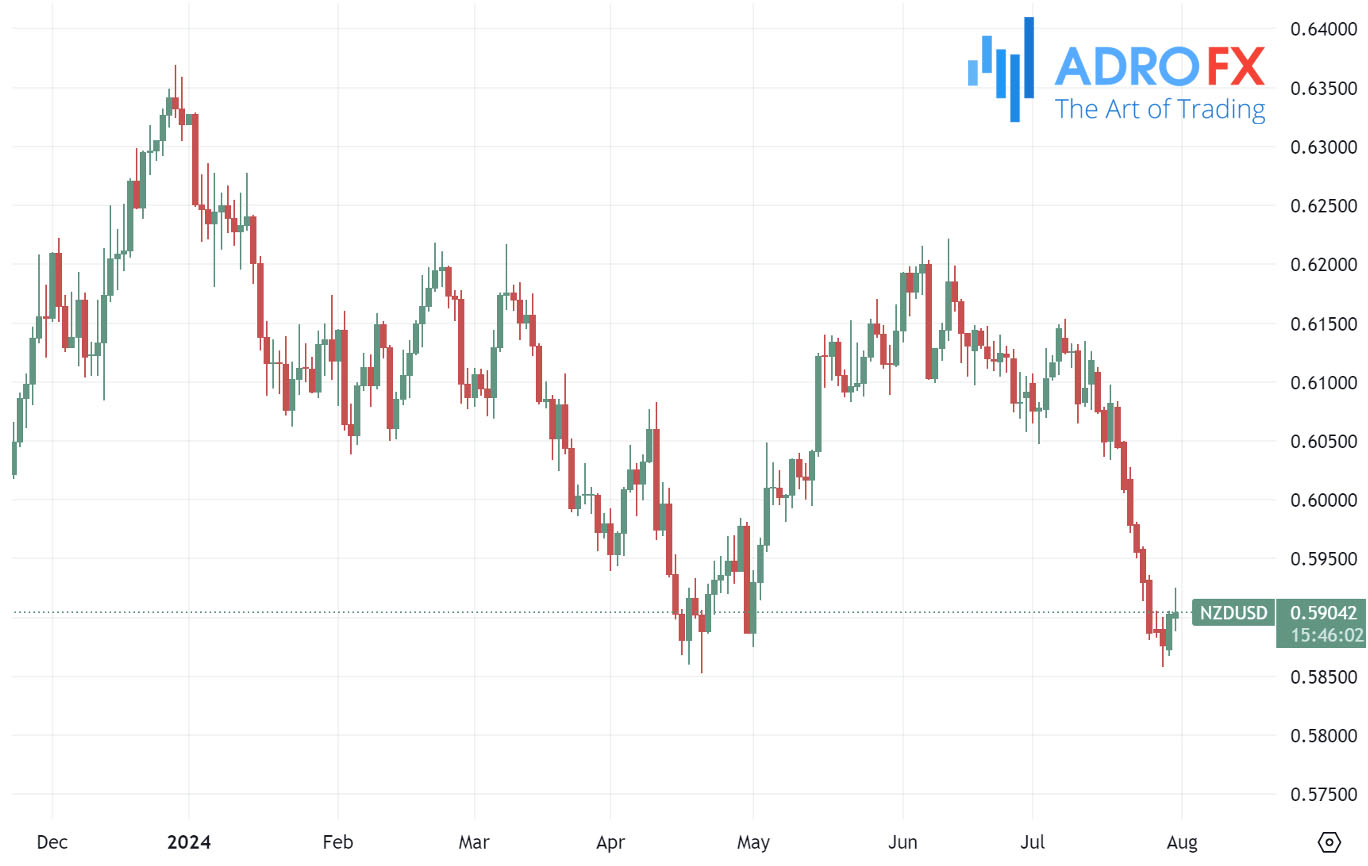
Nonetheless, the pair's upside may be limited due to increasing speculation about an early interest rate cut by the Reserve Bank of New Zealand. Investors are anticipating potential RBNZ rate cuts, with traders pricing in 14 basis points of cuts in August, suggesting a 55% likelihood of an imminent rate reduction.
Related Articles


Latest updates
Latest updates


Technical Analysis
Latest updates


