Tech Stocks Drag Down S&P 500 Amid Economic Growth Concerns | Daily Market Analysis

Key events:
- Eurozone - CPI (YoY) (May)
- USA - Core PCE Price Index (MoM) (Apr)
- USA - Core PCE Price Index (YoY) (Apr)
- USA - Chicago PMI (May)
- Canada - GDP (QoQ) (Q1)
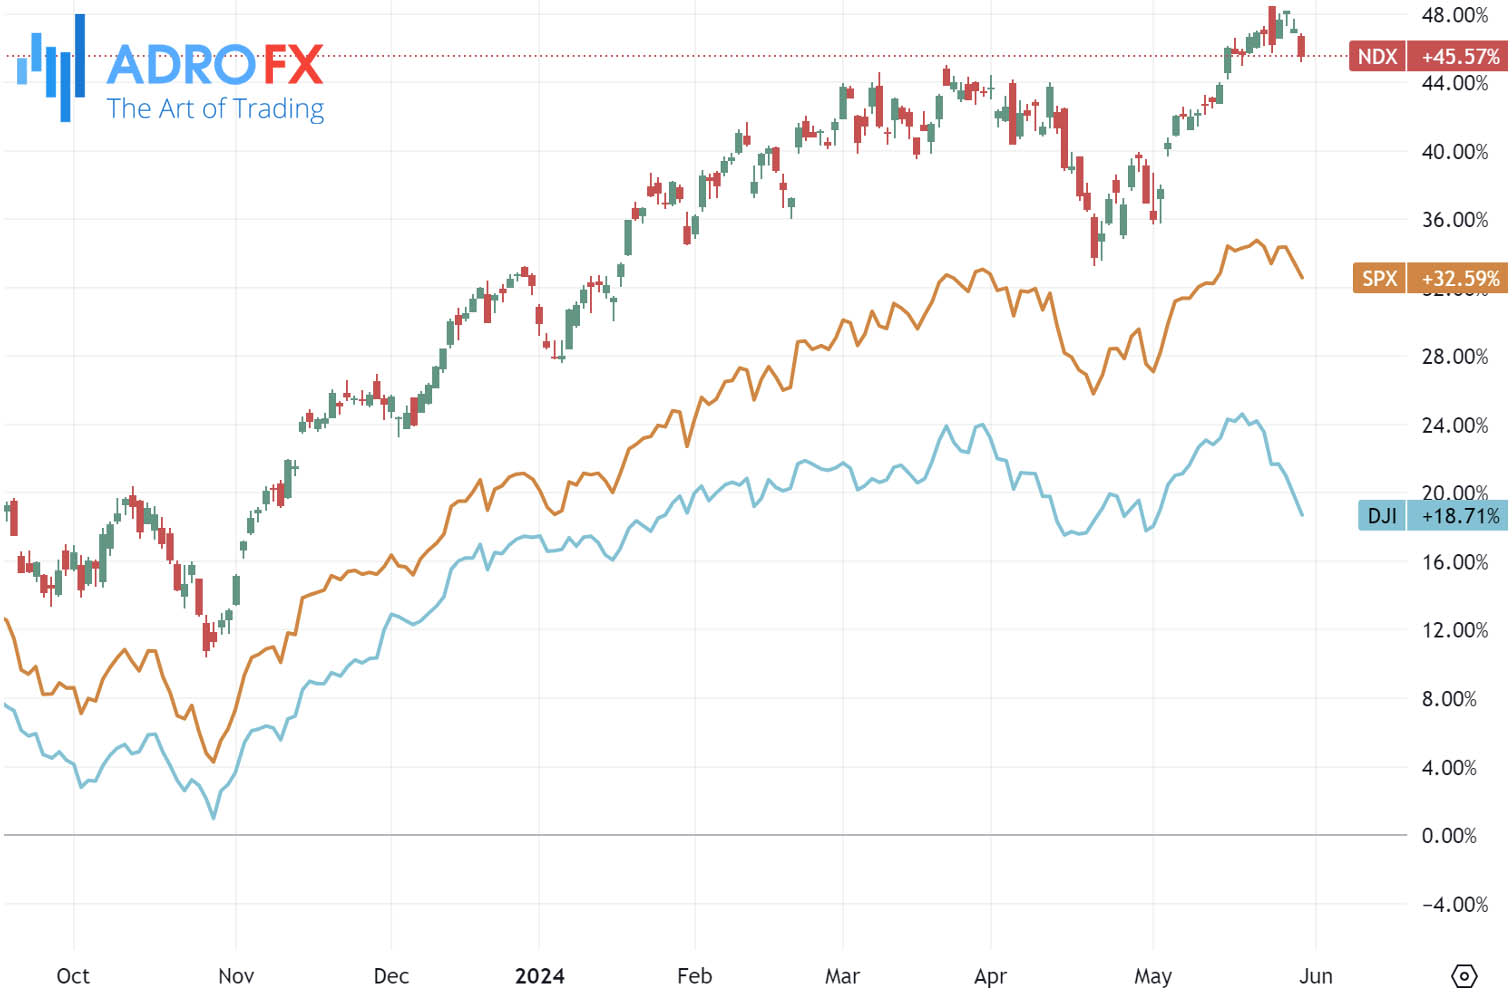
The S&P 500 closed lower on Thursday, pulled down by a drop in technology stocks, particularly Salesforce, and cautious sentiment ahead of key inflation data expected on Friday.
The Dow Jones Industrial Average fell by 330 points, or 0.9%. The S&P 500 decreased by 0.6%, and the NASDAQ Composite declined by 1.1%.
Economic growth in the first quarter of the year was slower than initially estimated, with the gross domestic product rising at an annualized rate of 1.3% from January to March. This is below the preliminary estimate of 1.6% and significantly lower than the 3.4% growth rate in the final quarter of 2023.
These figures were released just before Federal Reserve President John Williams commented, downplaying fears of an imminent rate cut by stating that the current monetary policy was effectively restraining the economy. Federal Reserve policymakers have revised their expectations for when interest rate cuts might occur, making Friday's PCE price index data, the Fed’s preferred measure of inflation, a key focus for investors.
The Japanese Yen remained stable after the Statistics Bureau of Japan released the Tokyo CPI data on Friday. The year-over-year CPI rose to 2.2% in May, up from a previous 26-month low of 1.8%.
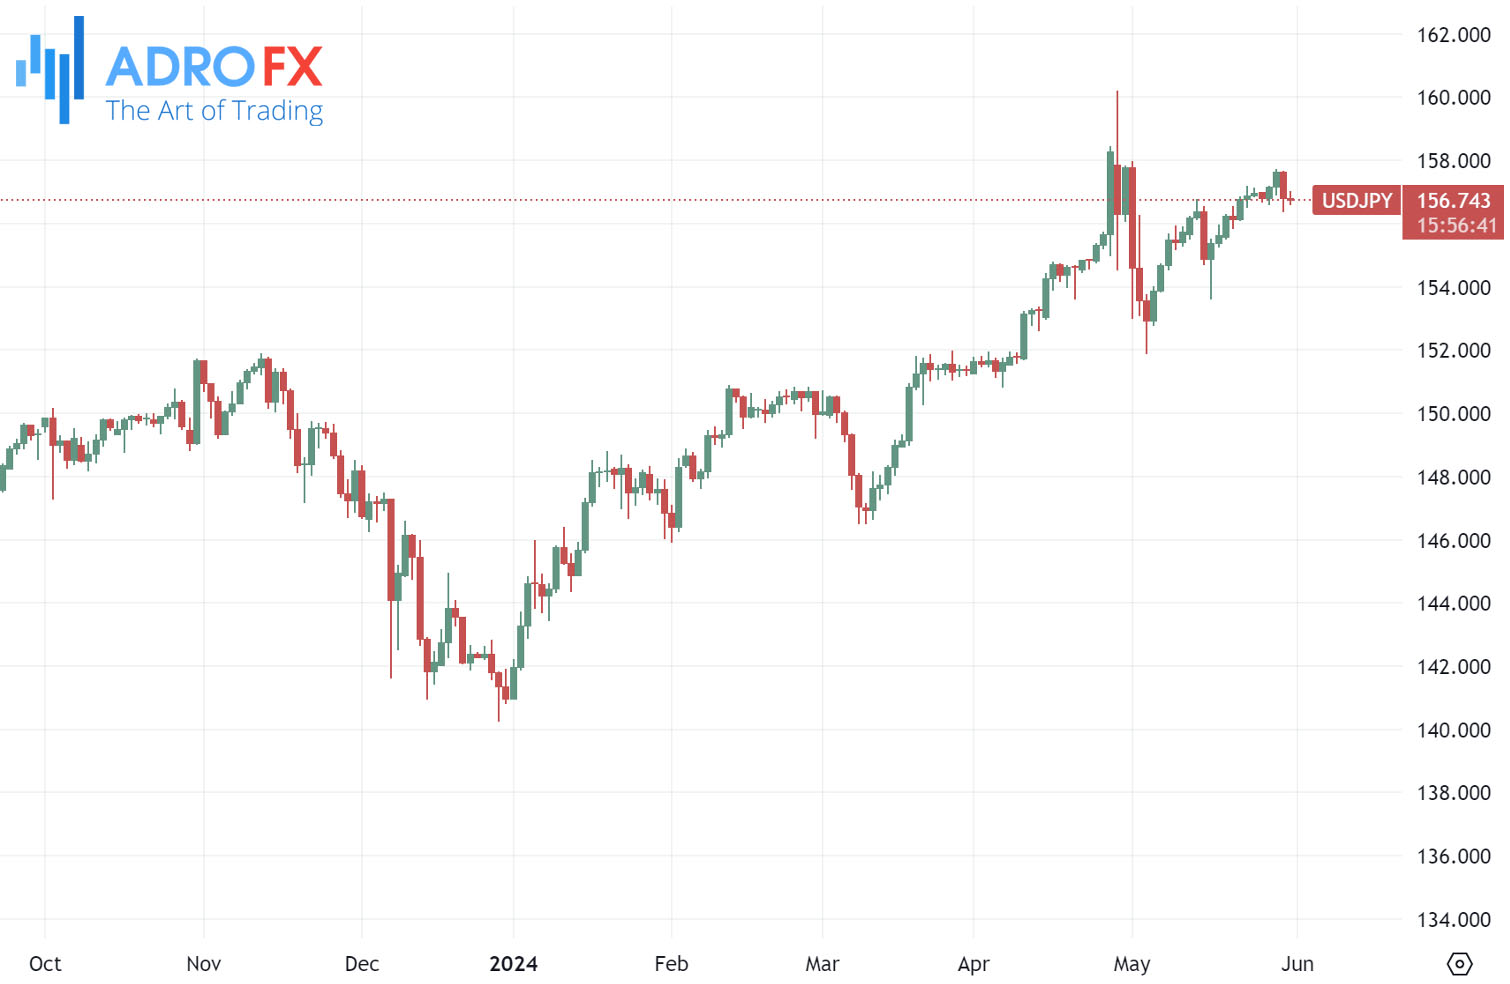
The Bank of Japan has maintained a firmly entrenched monetary policy stance. If national inflation in Japan declines, it could prevent the central bank from raising interest rates. The significant rate differential between Japan and other countries continues to put pressure on the Japanese Yen, supporting the USD/JPY pair.
The Australian Dollar remained relatively unchanged after the release of disappointing NBS PMI data from China on Friday. Given Australia's close trade ties with China, any shifts in the Chinese economy can significantly affect the Australian market. Earlier in the day, the AUD/USD pair had strengthened as the US Dollar faced pressure due to signs of an economic slowdown in the US.
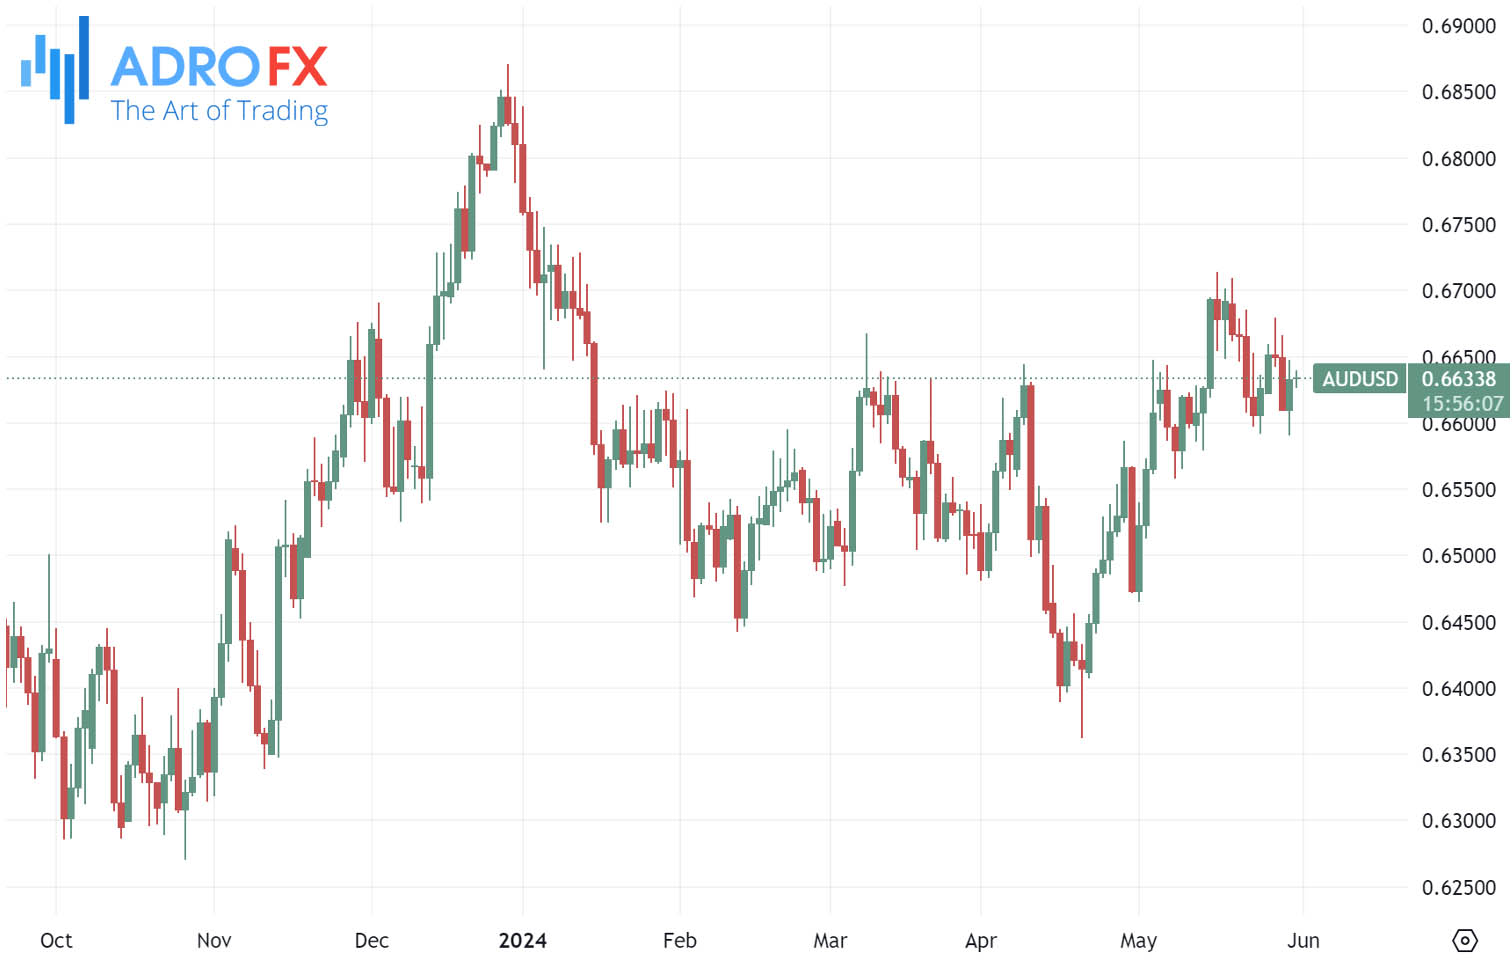
Support for the AUD also came from a rise in the monthly inflation rate to 3.6%, increasing the likelihood that the Reserve Bank of Australia may need to raise interest rates again. Investors now expect that the RBA will maintain high rates for an extended period, with a rate cut not anticipated until May next year.
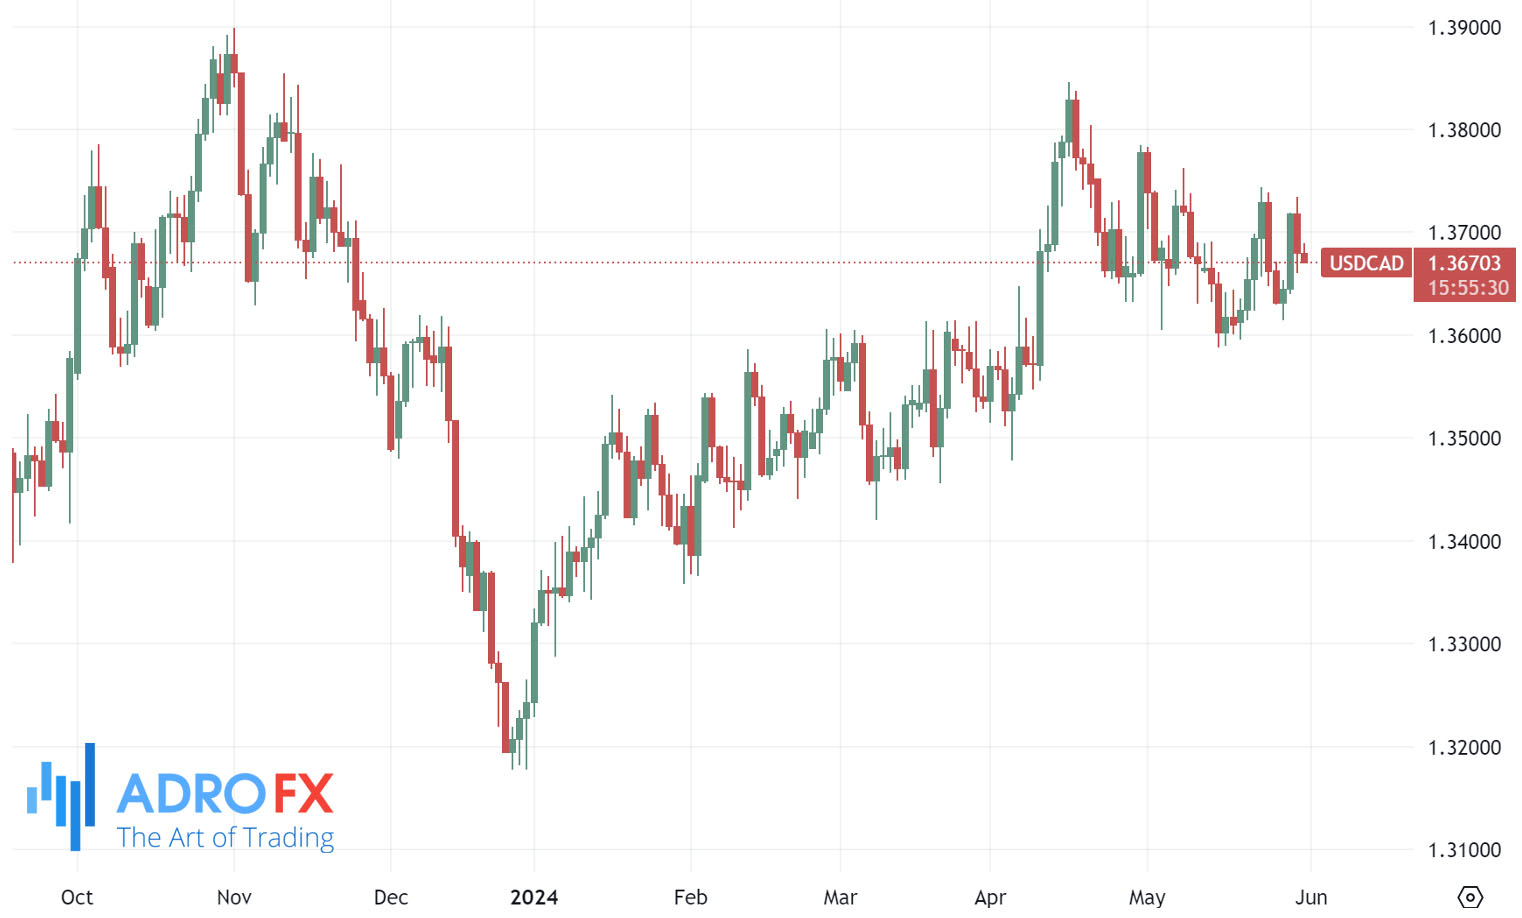
The USD/CAD pair stopped its recent decline, trading around 1.3690 during the Asian session on Friday. The US Dollar saw a rebound ahead of the anticipated release of the Federal Reserve's preferred inflation measure, the Core PCE Price Index.
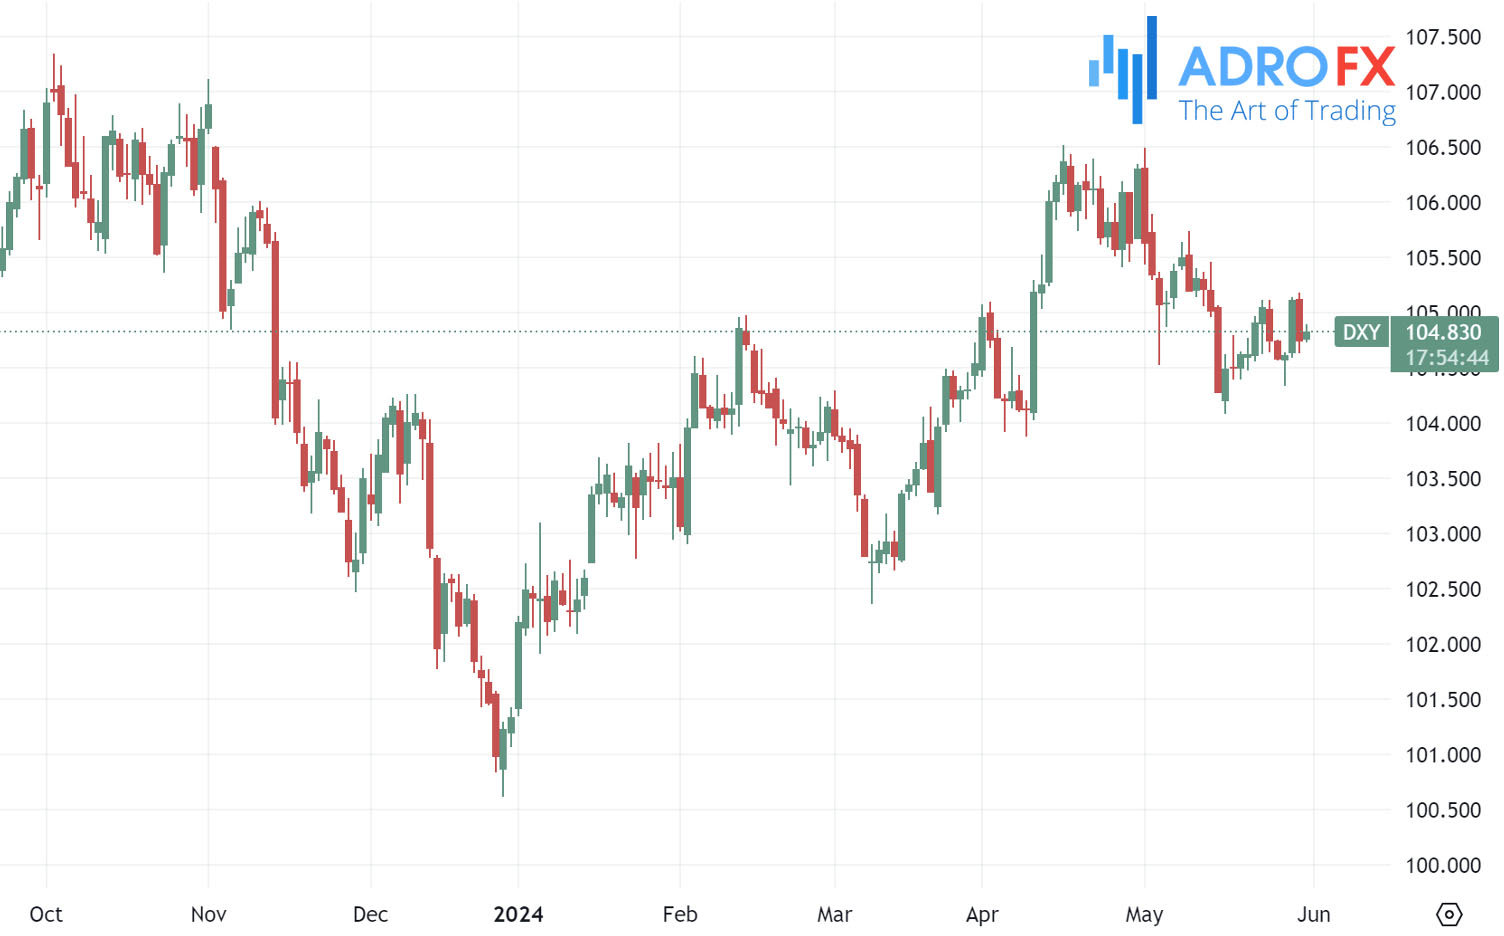
A decline in US Treasury yields could curb the US Dollar's advance. The US Dollar Index, which tracks the USD against six major currencies, rose to around 104.80, with 2-year and 10-year US Treasury yields at 4.92% and 4.54%, respectively, at the time of reporting.
In Canada, expectations for a rate cut in June by the Bank of Canada have lessened due to recent data showing persistent price pressures. Producer prices increased by 1.5% in April from the previous month, following a 0.9% rise in March, nearly double the forecasted 0.8% change. Interest rate futures now indicate that only 34% of the market expects a 25-basis point rate cut at the BoC's June meeting, down from 46% a week prior.
On Friday, Statistics Canada is set to release the country's GDP data. The annualized figure for the first quarter is projected to show a 2.2% growth, up from the 1.0% increase recorded in the previous quarter.
Related Articles


Latest updates
Latest updates


Technical Analysis
Latest updates


