S&P 500 Rebounds as Investors Eye Apple's AI Push and Key Inflation Data | Daily Market Analysis

Key events:
- UK - Employment Change 3M/3M (MoM) (Jul)
- UK - Unemployment Rate (Jul)
- Eurozone - EU Economic Forecasts
- Canada - BoC Gov Macklem Speaks
- USA - Fed Vice Chair for Supervision Barr Speaks
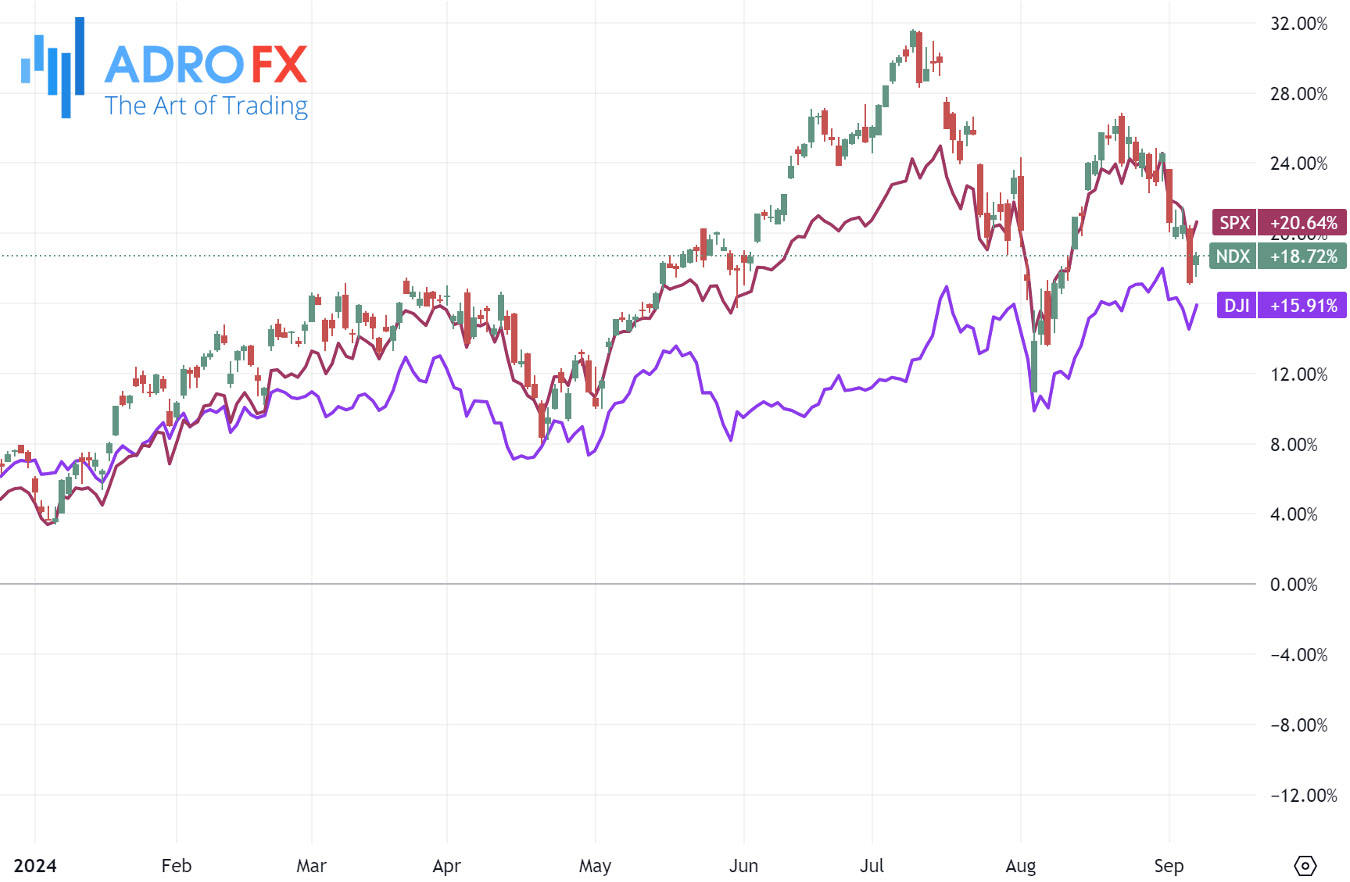
The S&P 500 rallied on Monday, recovering from its steepest weekly decline since 2023, as investors reacted to Apple's latest AI-powered iPhones and anticipated this week's inflation data.
The Dow Jones Industrial Average climbed 484 points, or 1.2%, while both the S&P 500 and the Nasdaq Composite each gained 1.2%.
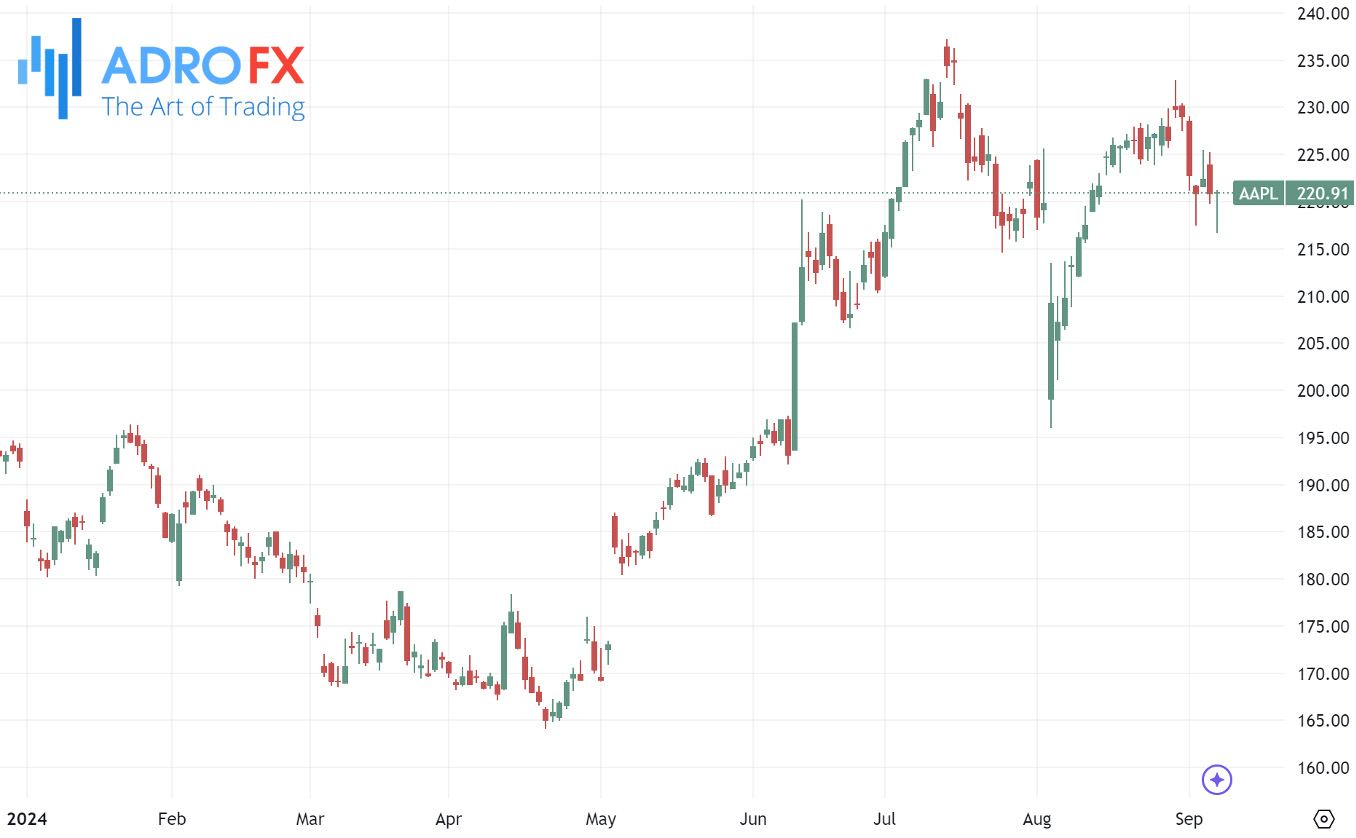
Despite the broader tech sector's rally, Apple Inc (NASDAQ: AAPL) closed relatively unchanged. This came after the company revealed its new iPhone models and introduced its generative AI software, Apple Intelligence.
Apple's iPhone 16 will start at $799, with the 16 Plus model priced at $899. The company also confirmed that Apple Intelligence would launch in October, along with announcements of the redesigned Watch Series 10 and AirPods 4.
The product event drew significant attention as investors looked for signs that Apple's push into AI could drive a fresh upgrade cycle for the iPhone.
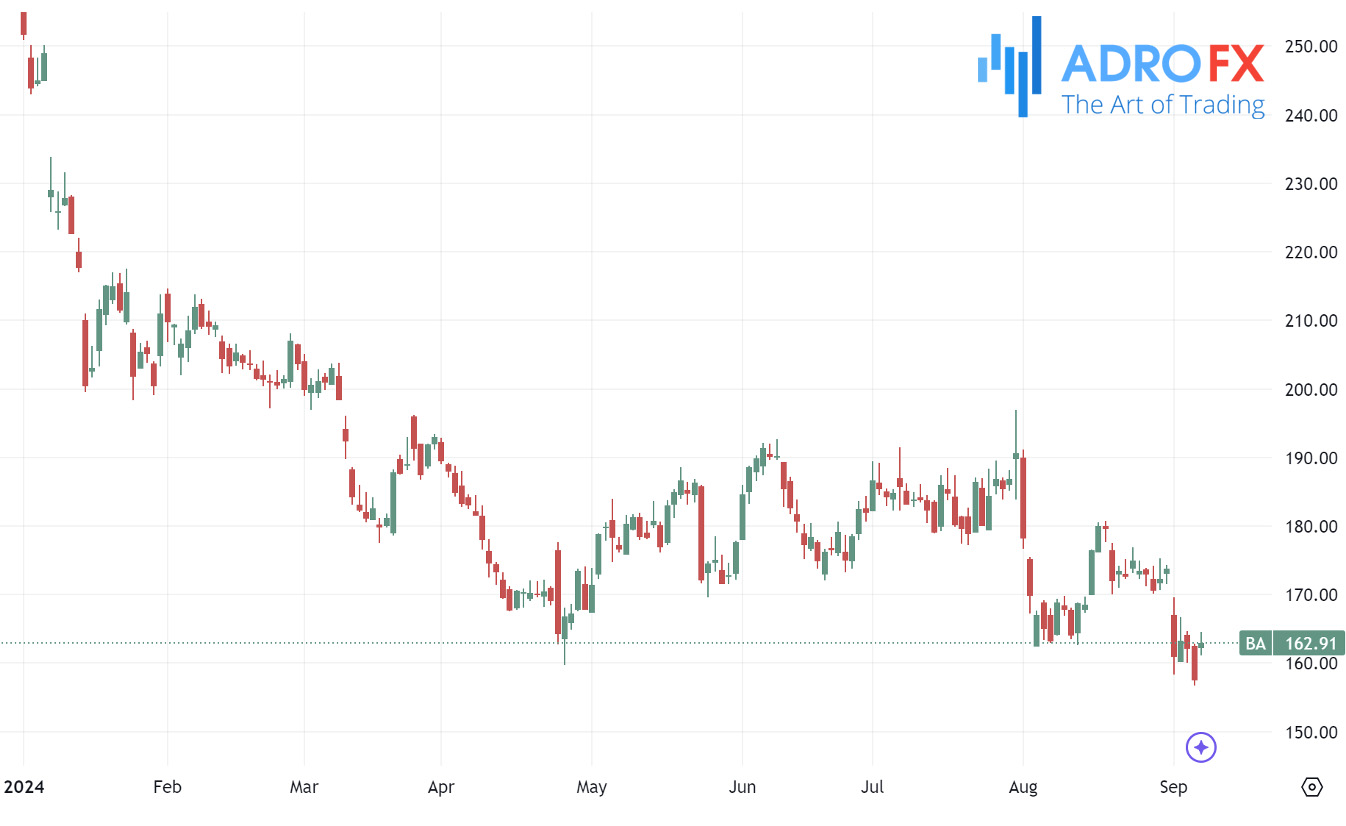
In other news, Boeing (NYSE: BA) saw its shares rise by more than 3% after reaching a tentative agreement that includes a 25% pay increase for its largest union, potentially averting a strike. The proposed four-year deal also involves commitments to build a new plane in the Pacific Northwest, improved retirement benefits, and enhanced union involvement in jet quality.
Meanwhile, the gold market faced renewed selling pressure during Tuesday's Asian session, reversing some of Monday's gains. This shift came amid continued strength in the US Dollar, following mixed US jobs data that led investors to reduce expectations of a larger interest rate cut by the Federal Reserve in September. The USD Index edged closer to last week's monthly high, further weighing on gold, a non-yielding asset.
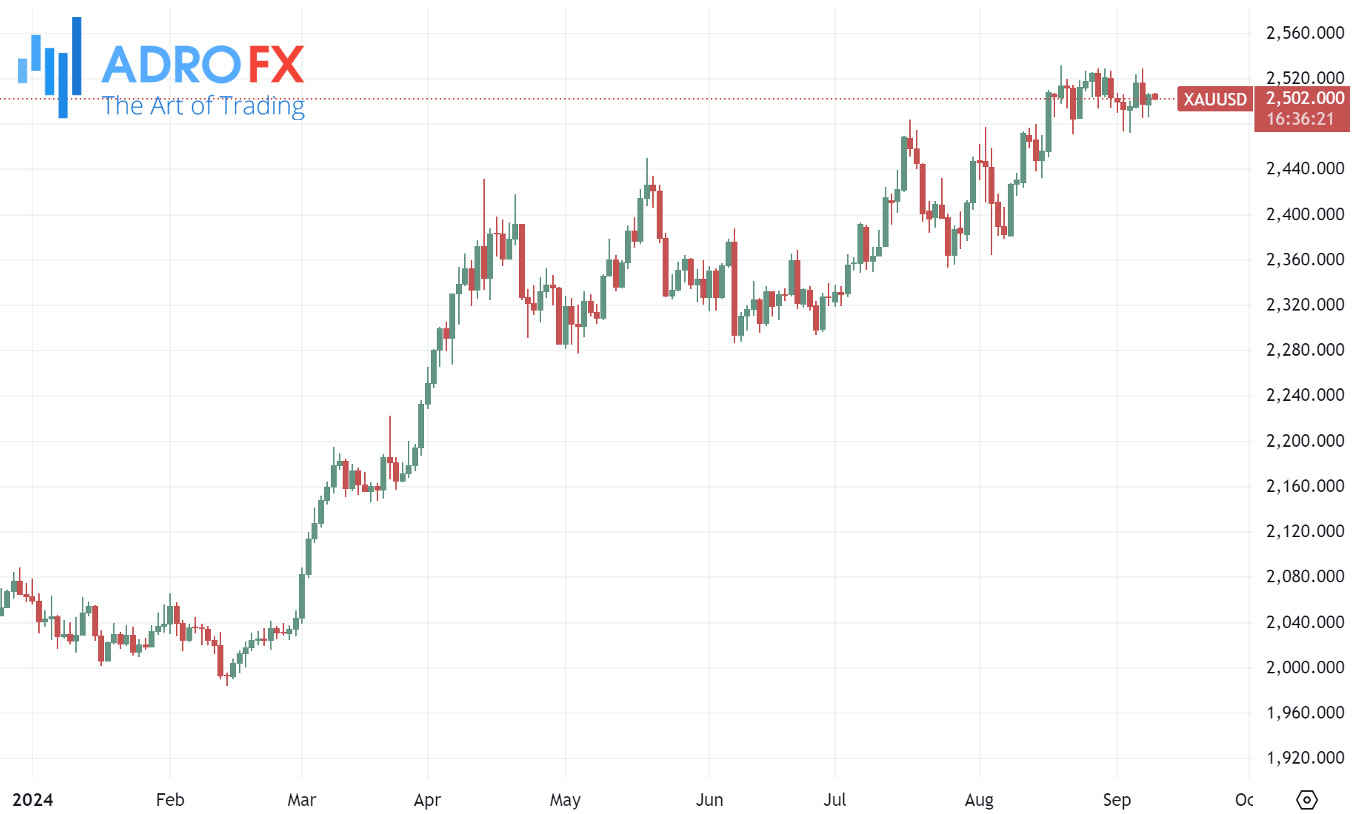
Additionally, a positive sentiment in the equity markets contributed to the downward pressure on gold prices. Investors are now closely watching the upcoming US consumer inflation data on Wednesday, along with the Producer Price Index (PPI) on Thursday, which could influence USD demand and gold's future direction.
The USD/CAD pair attracted some buyers during the Asian session on Tuesday but remained within the previous day's range. Spot prices hovered around 1.3565, up slightly but still below the 200-day Simple Moving Average (SMA), awaiting further momentum.
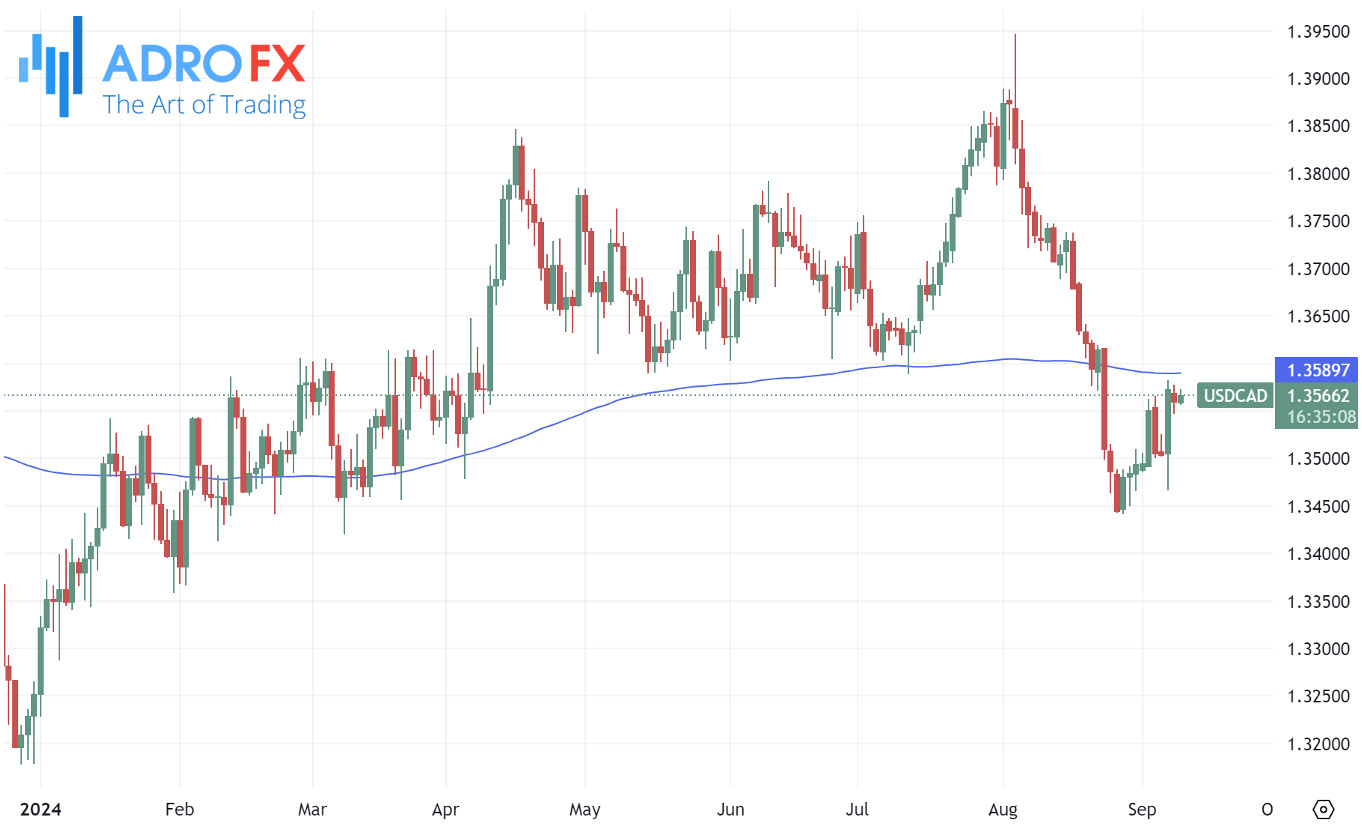
Crude oil prices struggled to sustain gains from the previous session's rebound, facing pressure due to concerns over China's economic slowdown, the world's largest oil importer. Fresh trade balance data from China showed stagnant imports in August, contrasting with the 6.6% growth seen in the prior month, indicating weak domestic demand. Furthermore, expectations of additional interest rate cuts by the Bank of Canada, fueled by disappointing Canadian jobs data, added to the support for the USD/CAD pair.
The AUD/USD pair continues its downward trend for the third consecutive day, influenced by the disappointing Westpac Consumer Confidence data from Australia released on Tuesday. Additionally, the US Dollar gained strength after a recent US labor market report raised doubts about the Federal Reserve's potential for a significant interest rate cut in its upcoming September meeting.
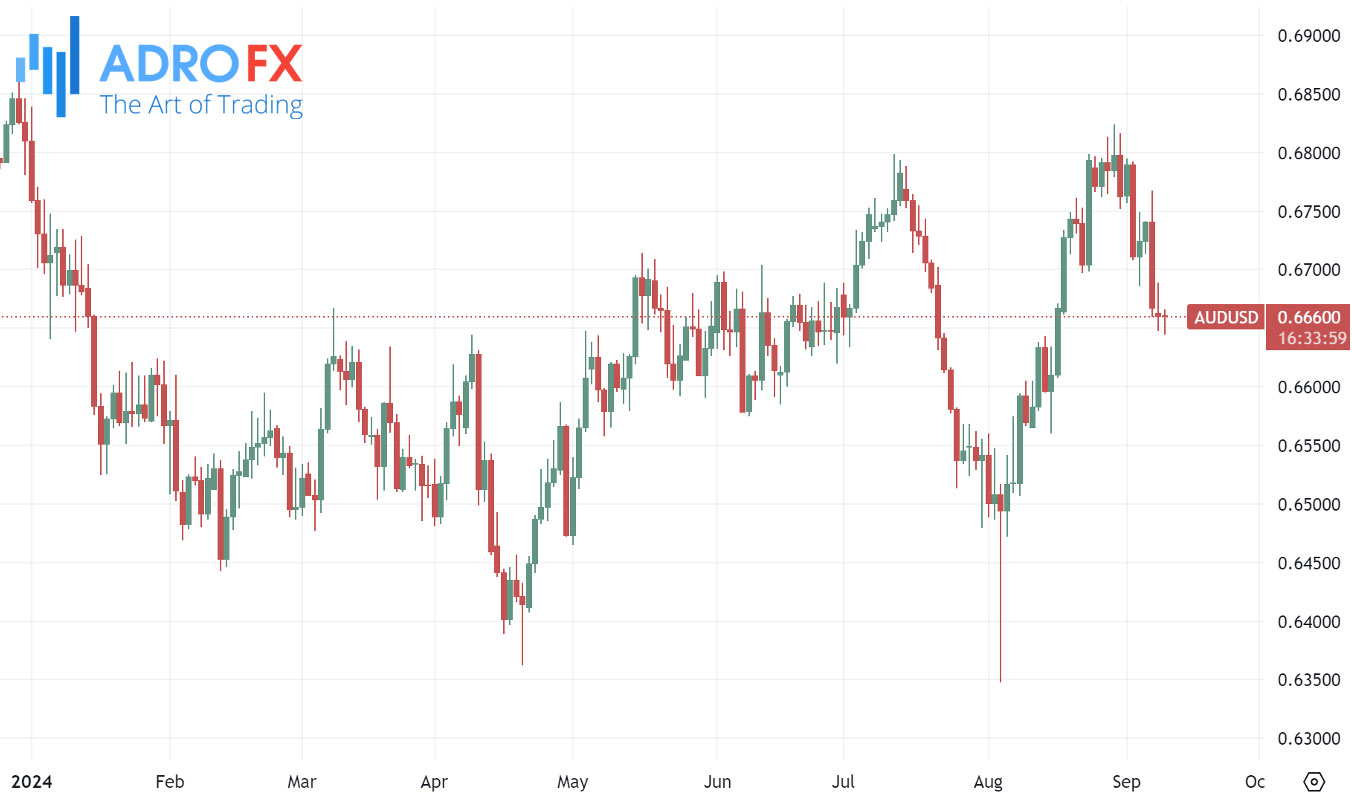
China's Trade Balance data revealed a trade surplus of CNY 649.34 billion in August, up from the previous CNY 601.90 billion. Meanwhile, China's exports grew by 8.4% year-on-year, following a 6.5% rise in the previous month. Australia's Westpac Consumer Confidence fell by 0.5% month-on-month in September, reversing a 2.8% gain in August. Market participants are now awaiting the release of China's Trade Balance data later in the day, as any shifts in the Chinese economy could have significant implications for the Australian market due to their close trade ties.
However, the Australian Dollar's downside might be cushioned by the hawkish stance of the Reserve Bank of Australia. RBA Governor Michele Bullock recently stated that it is too early to consider rate cuts, and the board does not expect to reduce rates in the near term.
Meanwhile, the USD/JPY pair turned positive for the second consecutive day after an early Asian session dip to the 142.85 region, though it lacks strong bullish momentum. Spot prices are trading with a slight positive bias just below the mid-143.00s, remaining close to the one-month low touched last Friday.
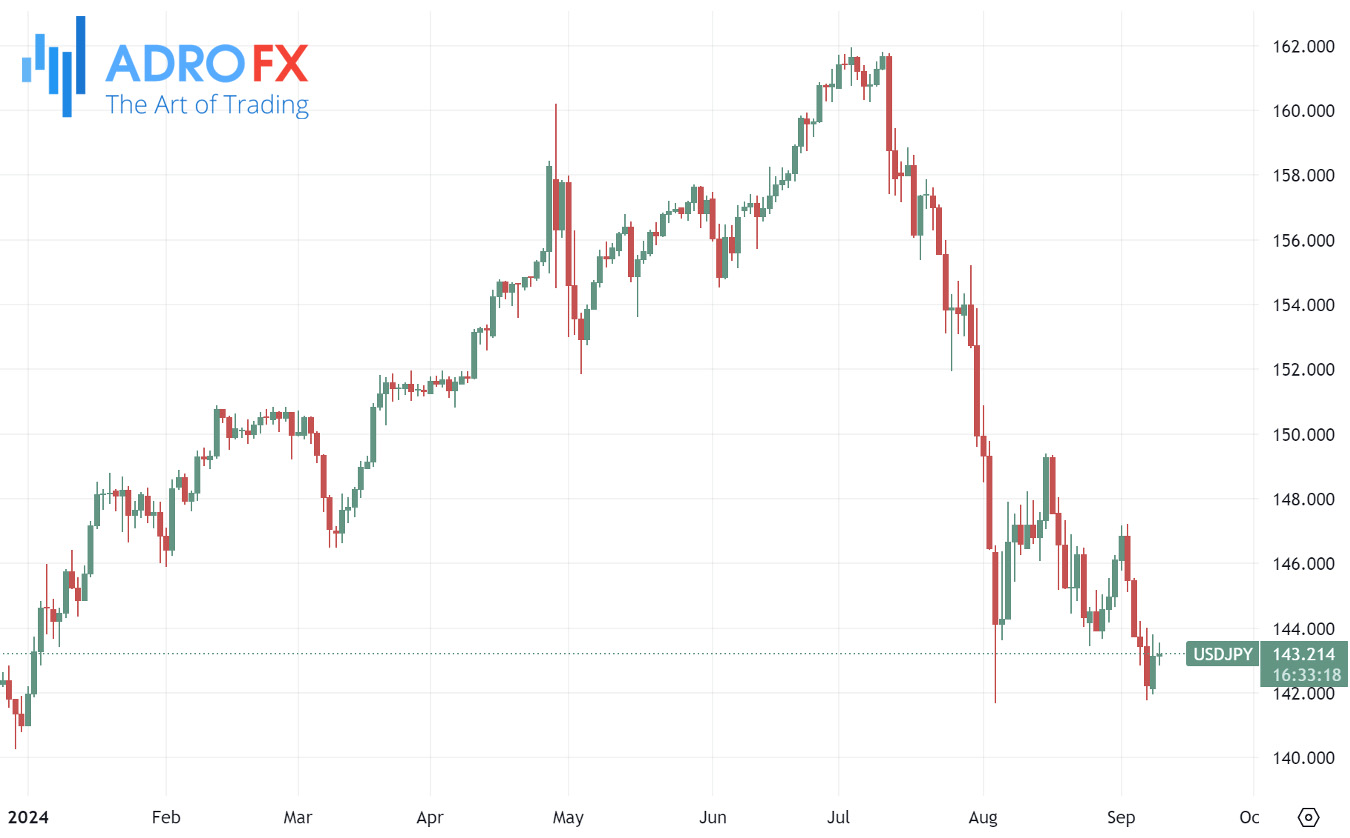
The Japanese Yen continues to be pressured by Monday's data, which showed that Japan's economy grew at a slightly slower pace than initially reported in the second quarter. This may complicate the Bank of Japan's plans for further interest rate hikes in the coming months. Additionally, a generally positive risk sentiment in equity markets has reduced demand for the safe-haven JPY, providing support for the USD/JPY pair amid ongoing US Dollar buying interest.
Investors may prefer to remain cautious and wait for the release of US consumer inflation data on Wednesday before making fresh directional bets. Strong follow-through buying is necessary to confirm that the USD/JPY pair has established a near-term bottom and is positioned for a significant upward move. However, in the absence of relevant US macroeconomic data on Tuesday, speeches by key Federal Open Market Committee (FOMC) members later in the US session could provide some direction.
Related Articles


Latest updates
Latest updates


Technical Analysis
Latest updates


