How to Decode Market Movements Using Elliott Wave Theory

Elliott Wave Theory, introduced by Ralph Nelson Elliott in the 1930s, is a cornerstone of technical analysis used to predict market trends and price movements. Elliott's revolutionary insight revealed that market prices unfold in specific patterns, known as "waves," reflecting the collective psychology of investors. This article will explore how traders can use the Elliott Wave Theory to decode market movements and forecast future behavior effectively.
Elliott Wave Theory is powerful because it provides a structured way to understand and predict market dynamics. By identifying the patterns of price movements, traders can anticipate potential future trends and make more informed trading decisions. The theory's application to various market conditions and its integration with other technical indicators further enhance its utility in crafting effective trading strategies.
Fundamentals of Elliott Wave Theory
Grasping the fundamentals of Elliott Wave Theory is essential for leveraging this potent analytical tool in trading. At its core, the theory posits that market prices oscillate in predictable patterns that mirror the collective psychology of investors. These patterns, called waves, are categorized into two primary types: impulse waves that follow the main trend and corrective waves that counter it. By understanding the structure and nuances of these waves, traders can glean critical insights into market trends and potential turning points.
Wave Patterns
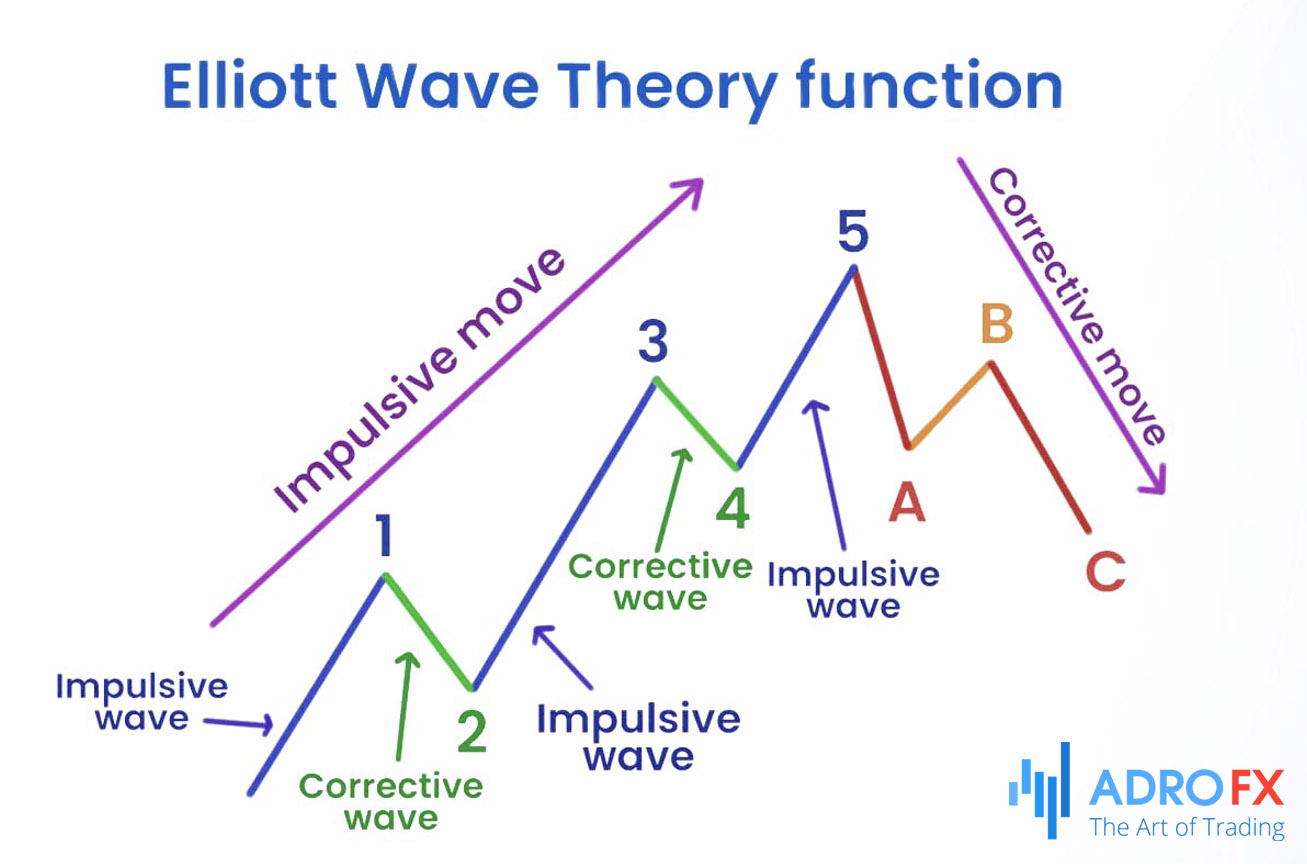
The essence of Elliott Wave Theory is encapsulated in its wave patterns, which are a series of impulsive and corrective waves. The basic configuration comprises five waves that align with the main trend (impulse waves) followed by three waves that counter the trend (corrective waves).
Impulse Waves
Impulse waves are distinguished by five unique waves (1, 2, 3, 4, and 5) that propel the market in the direction of the prevailing trend. Wave 1 marks the initial movement, Wave 2 is a pullback, Wave 3 is typically the most robust and extended wave, Wave 4 represents a smaller correction, and Wave 5 concludes the trend movement. These waves showcase the dominant market trend and are vital for determining the overall market direction.
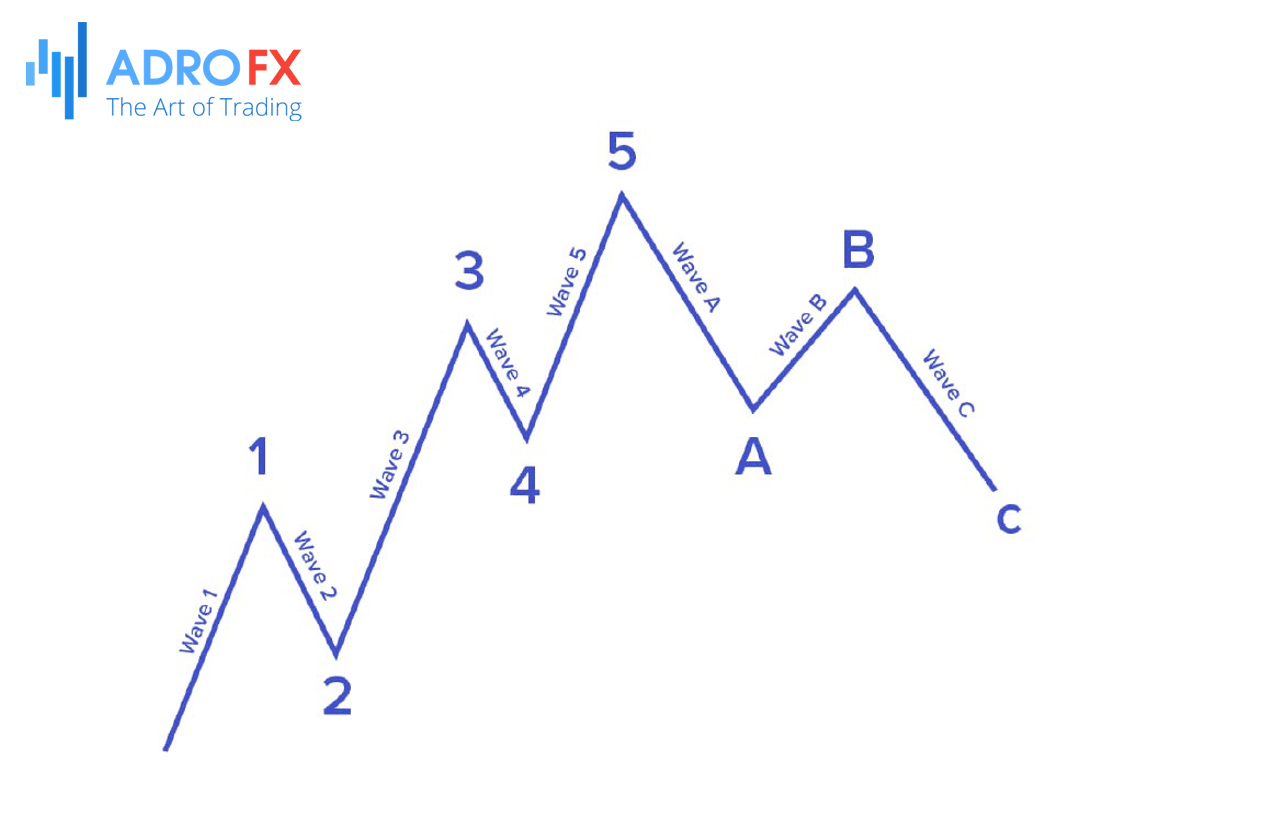
Elliott Wave Theory chart showing impulse and corrective waves.
Corrective Waves
After the impulse waves, the market enters a corrective phase, consisting of three waves labeled A, B, and C that move contrary to the primary trend. Wave A marks the initial counter-trend movement, Wave B is a partial retracement of Wave A, and Wave C completes the corrective process. This three-wave structure aids traders in identifying the conclusion of a trend and the possible commencement of a new one.
Wave Degrees
Elliott Wave Theory is founded on the concept of fractals, meaning that wave patterns recur at different scales or degrees. From the smallest intraday fluctuations to long-term multi-year trends, waves of varying degrees interconnect to create a comprehensive market structure. Understanding these wave degrees allows traders to analyze market movements across multiple time frames, offering a detailed view of the market's behavior.
Also read: Wolfe Wave Pattern Trading Guide
Wave Rules and Guidelines
To accurately identify and interpret Elliott Wave patterns, traders must follow specific rules and guidelines. Key principles include:
- Rule of Alternation
Corrective waves vary in complexity. If Wave 2 is simple, Wave 4 is likely to be complex, and vice versa.
- Wave Equality
In an impulse sequence, Waves 1 and 5 are often equal in length, while Wave 3 is typically the longest.
- Fibonacci Relationships
Waves frequently conform to Fibonacci ratios, such as 0.618 and 1.618, which help predict the length and timing of future waves.
By adhering to these principles and guidelines, traders can utilize the Elliott Wave Theory to forecast market movements and make strategic trading decisions.
Applying Elliott Wave Theory to Forecast Market Trends
Elliott Wave Theory offers traders a powerful framework for analyzing and predicting market trends. By recognizing and interpreting wave patterns on price charts, traders can foresee future market movements and make well-informed trading decisions. Here’s how to effectively apply Elliott Wave Theory to forecast market trends.
Identifying Wave Patterns
To start, follow these steps to identify Elliott Wave patterns on price charts:
- Start with a Clean Chart
Begin with a clear, uncluttered price chart to identify initial wave patterns.
- Identify Impulse Waves
Look for a sequence of five waves moving in the direction of the primary trend, labeled 1 through 5.
- Spot Corrective Waves
After identifying the five-wave impulse, look for a three-wave corrective pattern moving against the trend, labeled A, B, and C.
- Check Wave Degrees
Verify the wave degrees, ensuring that smaller wave patterns fit within larger ones, as Elliott Waves are fractal.
- Apply Rules and Guidelines
Ensure that the identified waves comply with Elliott Wave rules, such as the rule of alternation and wave equality.
Using Fibonacci Ratios
Fibonacci ratios are crucial to Elliott Wave Theory, helping traders predict wave movements and potential reversal points. Here’s how to use them:
- Measure Wave Lengths
Utilize Fibonacci retracement tools to measure the length of impulse waves.
- Identify Key Levels
Look for common Fibonacci levels (e.g., 38.2%, 50%, 61.8%) where price corrections are likely to occur.
- Project Future Movements
Use Fibonacci extensions to project the length of future waves, particularly waves 3 and 5 in the impulse sequence.
- Combine with Other Indicators
Enhance the accuracy of your predictions by combining Fibonacci ratios with other technical indicators like moving averages or RSI.
Comparing Elliott Waves and Wolfe Waves
Both Elliott Waves and Wolfe Waves are influential tools in the realm of technical analysis, but they each offer unique advantages depending on your trading strategy. Here’s a breakdown of their structural differences, applications, and flexibility to help you choose the right tool for your needs.
Structural Differences
Elliott Waves are defined by a distinctive five-wave impulse pattern followed by a three-wave correction, illustrating the larger market trend. This model provides a broad overview of market behavior, highlighting the overall direction and momentum.
In contrast, Wolfe Waves consist of a five-wave pattern within a channel, often pinpointing precise reversal points and optimal entry and exit signals. This structure helps in identifying specific moments of change within a more defined market range.
Application and Purpose
Elliott Waves are ideal for understanding overarching market cycles and long-term trends. They offer a comprehensive perspective on market behavior, allowing traders to align their strategies with broader trends and make strategic decisions.
Wolfe Waves, on the other hand, are tailored for identifying precise entry and exit points. Their focus is on short-term trading, making them particularly effective for spotting exact moments of market reversals and fine-tuning trading strategies.
Flexibility and Subjectivity
The interpretation of Elliott Waves is often flexible and subjective. Traders must adapt to various market conditions and sometimes ambiguous wave patterns, which can lead to diverse interpretations. This adaptability allows Elliott Waves to be applied across a range of market scenarios, though it can also introduce variability in analysis.
Wolfe Waves offer a more rigid structure, which can reduce subjectivity and provide clearer, more consistent signals. This rigidity enhances the precision of predictions but might limit their application in certain market conditions.
By understanding the distinct characteristics of Elliott Waves and Wolfe Waves, traders can leverage each tool’s strengths to better align with their trading goals and strategies.
Advantages and Challenges of Elliott Wave Theory
Elliott Wave Theory is a powerful analytical tool that provides valuable insights into market trends. However, its application is not without its complexities. Here’s a look at both the strengths and the challenges associated with this approach.
Advantages
- Holistic Market Perspective
Elliott Wave Theory offers a broad view of market cycles by breaking down price movements into distinct patterns. This comprehensive outlook enables traders to anticipate future price actions and grasp the underlying market dynamics more effectively.
- Long-Term Trend Insights
This theory excels in analyzing long-term trends. By pinpointing the primary trend and its subsequent corrections, traders can align their strategies with the overall market direction, enhancing the chances of successful trades.
- Predictive Capabilities
Elliott Wave patterns are renowned for their predictive power. They help traders forecast potential market reversals and continuation points, which can improve decision-making and timing in trading activities.
- Fractal Flexibility
The fractal nature of Elliott Waves means that patterns can be observed across various time frames. This flexibility allows traders to apply the theory to both short-term and long-term charts, adjusting their strategies as needed.
Also read: A Trader's Guide To Using Fractals
Challenges
- Subjectivity in Wave Counting
One notable criticism of Elliott Wave Theory is its subjectivity. Different traders may interpret the same price chart in varied ways, leading to different wave counts and potentially conflicting predictions.
- Complexity
The theory is intricate and demands a thorough understanding of its principles and rules. For beginners, learning to accurately identify wave patterns and apply the theory effectively can be a formidable task.
- Variable Interpretations
Due to its complexity and subjective nature, Elliott Wave Theory can lead to varying interpretations among traders. This variability can hinder consistent results, particularly in volatile or ambiguous market conditions.
- Time-Intensive Analysis
Conducting a detailed Elliott Wave analysis requires considerable time and effort. The process of counting waves and applying the theory's rules meticulously can be time-consuming and demanding.
By weighing these advantages and challenges, traders can better understand how to leverage Elliott Wave Theory and navigate its complexities effectively.

Mastering Elliott Wave Theory: Advanced Strategies for Traders
Unlocking the full potential of Elliott Wave Theory requires more than just a basic understanding. By integrating advanced techniques and additional analytical tools, traders can elevate their forecasting accuracy and refine their trading strategies. Here’s a guide to employing advanced methods with Elliott Wave Theory:
Integrating with Other Indicators
Enhancing Elliott Wave analysis with complementary technical indicators can significantly boost the precision of your trading decisions:
- Relative Strength Index (RSI)
Utilize RSI to validate wave patterns. For example, an overbought RSI can signal the completion of a fifth wave in an impulse pattern, while an oversold RSI might indicate the end of a corrective wave. This confirmation helps solidify your wave counts and trading decisions.
- Moving Average Convergence Divergence (MACD)
MACD is invaluable for assessing momentum and direction. A MACD crossover can confirm the initiation of a new wave, providing additional support for your Elliott Wave counts and enhancing trade accuracy.
- Fibonacci Retracement and Extension Levels
Integrate Fibonacci tools to forecast wave movements. These levels can reveal potential support and resistance zones, aligning with the predictions made by Elliott Wave Theory and providing clearer entry and exit points.
Employing Multi Time Frame Analysis
Analyzing wave patterns across multiple time frames can offer a more comprehensive view of market behavior and refine your trading strategy:
- Top-Down Approach
Start by examining higher time frames (e.g., monthly or weekly) to identify the overarching trend and broader wave structures. Then, drill down to shorter time frames (e.g., daily or hourly) to detect more precise wave patterns and pinpoint exact entry and exit opportunities.
- Aligning Trends
Ensure that wave patterns on shorter time frames align with the primary trend observed on longer time frames. This alignment enhances the reliability of your signals and reduces the likelihood of false entries.
- Consistency Across Time Frames
Look for consistent wave counts across different time frames. Confirming patterns at multiple levels strengthens the analysis and boosts your confidence in the trade.
Advanced Wave Concepts
Incorporating advanced concepts like wave extensions and truncations adds depth to your Elliott Wave analysis and can refine market predictions:
Wave Extensions
Be aware that waves 3 and 5 in an impulse sequence can sometimes extend beyond typical Fibonacci projections. These extensions often signal strong market momentum and can provide insights into potential price targets.
Truncations
Recognize that the fifth wave in an impulse pattern might occasionally fail to reach the anticipated level, resulting in a truncation. Identifying truncations allows you to adjust your wave counts and avoid misleading predictions.
Spotting Anomalies
Understanding these advanced phenomena enables traders to adapt their wave counts dynamically. This adaptability is key to maintaining accurate market forecasts and achieving better trading outcomes.
By combining Elliott Wave Theory with other technical indicators, applying multi time frame analysis, and mastering advanced concepts like wave extensions and truncations, traders can develop sophisticated strategies that significantly enhance their market forecasting and trading decision-making.
Conclusion
Elliott Wave Theory, developed by Ralph Nelson Elliott, remains a foundational tool in technical analysis, offering traders a structured methodology to predict market trends and price movements. By mastering intricate wave patterns and principles, traders can gain valuable insights into market dynamics and forecast future behavior. Despite its complexity and subjectivity, Elliott Wave Theory's comprehensive market outlook and applicability across various time frames make it indispensable for traders.
For those looking to enhance their trading strategies, combining Elliott Wave Theory with other technical indicators, conducting multi time frame analysis, and mastering advanced concepts like wave extensions and truncations can significantly improve market predictions and trading decisions.
If you're ready to put these strategies into practice and harness the power of Elliott Wave Theory in your trading, consider partnering with AdroFx. With advanced trading platforms, educational resources, and expert support, AdroFx provides the tools and guidance you need to succeed in today's dynamic markets. Start your journey with AdroFx and take your trading to the next level.

About AdroFx
Established in 2018, AdroFx is known for its high technology and its ability to deliver high-quality brokerage services in more than 200 countries around the world. AdroFx makes every effort to keep its customers satisfied and to meet all the trading needs of any trader. With the five types of trading accounts, we have all it takes to fit any traders` needs and styles. The company provides access to 115+ trading instruments, including currencies, metals, stocks, and cryptocurrencies, which make it possible to make the most out of trading on the financial markets. Considering all the above, AdroFx is the perfect variant for anyone who doesn't settle for less than the best.
Related Articles


Latest updates
Latest updates


Technical Analysis
Latest updates


