Geopolitical Developments Drive Market Moves: Stocks Gain, Gold Rises Amidst Military Actions, and UK Economy Rebounds | Daily Market Analysis

Key events:
- UK - GDP (MoM) (Nov)
- USA - PPI (MoM) (Dec)
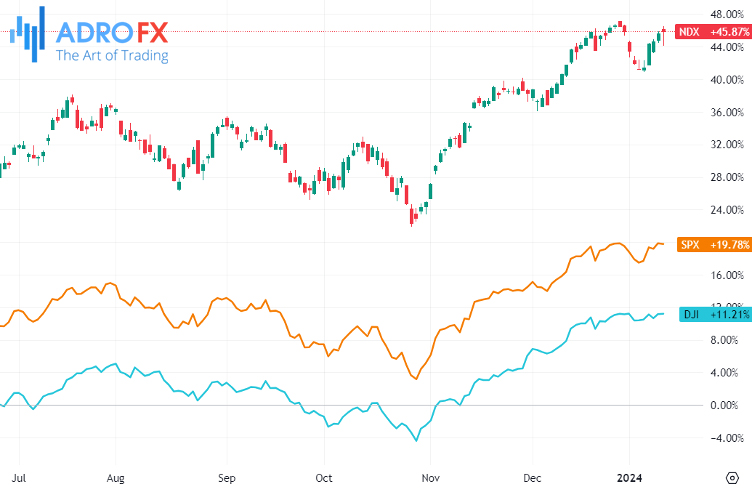
US stocks experienced modest gains on Thursday as investors processed a decrease in core inflation for December, despite higher-than-expected headline consumer prices. The Dow Jones Industrial Average declined by 255 points or 0.7%, the S&P 500 traded 38 points, or 0.8%, lower, and the NASDAQ Composite dropped by 140 points, or 0.9%.
The US consumer inflation report for December introduced uncertainty to Wall Street, with the annualized headline US inflation rising to 3.4%, up from 3.1% in November, surpassing the anticipated 3.2%.
Conversely, the "core" measure, excluding volatile items like food and energy, decreased to 3.9%, down from the prior month's 4.0%, albeit still above the expected 3.8%.
Despite figures surpassing market expectations, they suggest a decline in core prices, potentially leading the Federal Reserve to consider interest rate cuts this year.
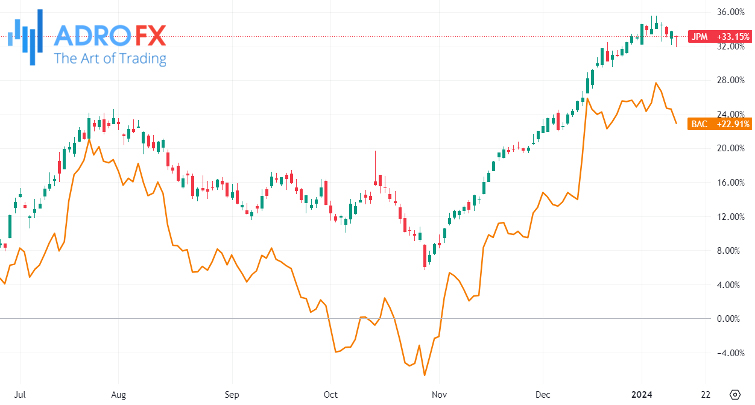
The fourth-quarter earnings season commences on Friday, featuring reports from major banking entities such as Bank of America (NYSE: BAC) and JPMorgan Chase (NYSE: JPM).
Citigroup (NYSE: C) shares fell by 2.5% after the bank cautioned about an $880 million impact from currency conversion losses in Argentina's currency and an additional $780 million from restructuring moves in its fourth-quarter results.
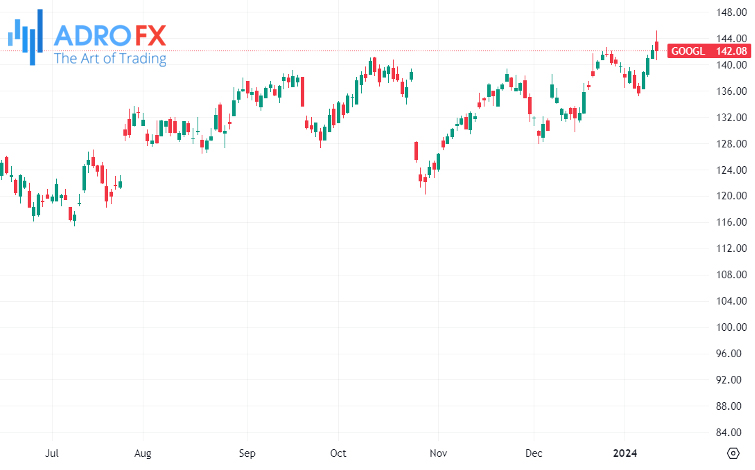
Alphabet (NASDAQ: GOOGL) initially rose around 1.8% on reports of Google dismissing employees to cut costs and support AI initiatives but later traded around 0.8% lower in line with the overall market trend.
In regulatory news, the US Securities and Exchange Commission (SEC) approved rule changes on Wednesday, paving the way for Bitcoin exchange-traded funds (ETFs) and expanding investor access to the cryptocurrency.
Oil prices rebounded on Thursday after weakness in the previous session, driven by ongoing Red Sea shipping attacks, including Iran boarding an oil tanker. US crude futures rose by 2.6% to $73.20 a barrel, and the Brent contract climbed by 2.2% to $78.50 a barrel.
Although both benchmarks settled lower on Wednesday due to unexpected US inventory builds, signaling weakness in fuel demand, ongoing concerns about Middle East supply disruptions persisted. Iran's seizure of an oil tanker with Iraqi crude destined for Turkey on Thursday added to regional tensions, supporting the overall market.
US and British forces initiated a series of strikes against the Iran-aligned Houthi group in Yemen, responding to the group's attacks on ships in the Red Sea. This action signaled an escalation in the Israel-Hamas war, a significant motivator for recent Houthi aggression.
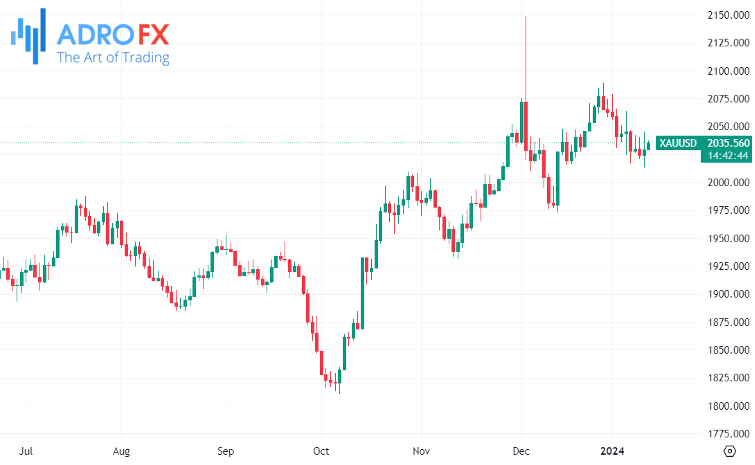
The heightened military activity increased safe haven demand for gold, as geopolitical risks typically drive investors towards more traditional havens. Despite a stronger US inflation reading, this development supported bullion prices.
Spot gold experienced a 0.3% rise, reaching $2,034.78 per ounce, while gold futures expiring in February surged by nearly 1%, reaching $2,038.80 per ounce.
The UK economy rebounded in November, showing a 0.3% growth after a 0.3% contraction in October, according to the latest data from the Office for National Statistics (ONS) published on Friday. The market had anticipated a 0.2% expansion for the reported period.
Surprisingly, the positive UK GDP data did not significantly impact the Pound Sterling.
The Japanese Yen strengthened for the second consecutive day against the US Dollar on Friday, recovering further from a one-month low observed after the release of US consumer inflation figures.
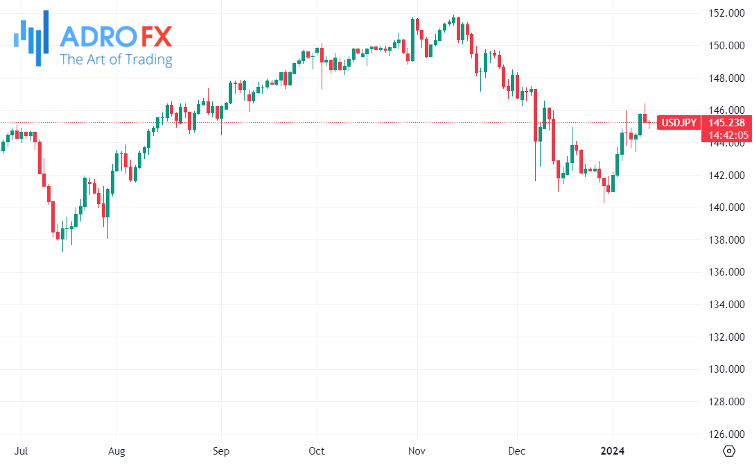
Amid concerns about China's economic challenges, the JPY's relative safe-haven status benefited from the perceived risk of increased geopolitical tensions in the Middle East. Additionally, the subdued performance of the US Dollar added some downward pressure on the USD/JPY pair.
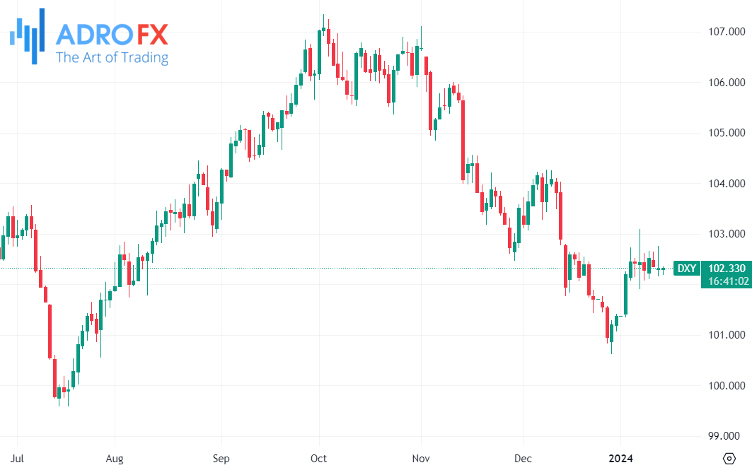
The US Dollar is facing challenges due to an improved risk appetite as traders move away from the Greenback. This shift could be attributed to speculation about potential rate cuts by the Federal Reserve in March and May. Despite improved US Treasury yields, the US Dollar Index trades slightly lower around 102.20.
Related Articles


Latest updates
Latest updates


Technical Analysis
Latest updates


