Dow Marks Longest Winning Streak Since 2019, Gold Declines, Central Banks in Focus | Daily Market Analysis

Key events:
- Japan - BSI Large Manufacturing Conditions (Q4)
- USA - 3-Year Note Auction
- USA - 10-Year Note Auction
- Eurozone - ECB McCaul Speaks
- New Zealand - Electronic Card Retail Sales
On Friday, the Dow experienced a rise, marking its lengthiest weekly winning streak since 2019. This surge was attributed to a stronger-than-expected jobs report, fostering optimism that the US economy would steer clear of a recession, coupled with ongoing speculations of an early rate cut in the coming year.
The S&P 500, a key benchmark, climbed 0.5% to reach a new yearly closing high of 4,604.37. Simultaneously, the Dow Jones Industrial Average, comprising 30 stocks, saw a 0.4% increase (130 points), securing its sixth consecutive weekly victory. The Nasdaq Composite, known for its tech-heavy composition, also rose by 0.5%.
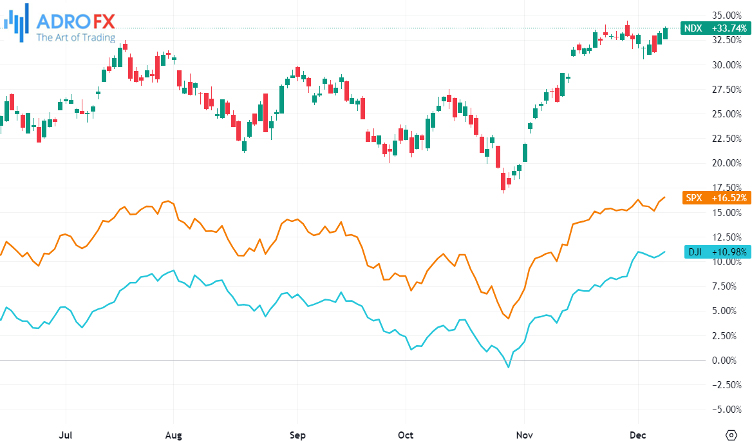
In the employment sector, nonfarm payrolls grew by 199,000 jobs last month, surpassing the October increase of 150,000, according to data from the Bureau of Labor Statistics. Economist predictions of a 180,000-job climb were exceeded. Additionally, average hourly earnings, a crucial indicator of wage growth, accelerated to a monthly pace of 0.4% compared to October's 0.2%, surpassing the anticipated 0.3%. Despite the unexpected drop in the unemployment rate to 3.7%, concerns about rising wage growth and potential inflation dampened optimism for rate cuts, leading to higher Treasury yields.
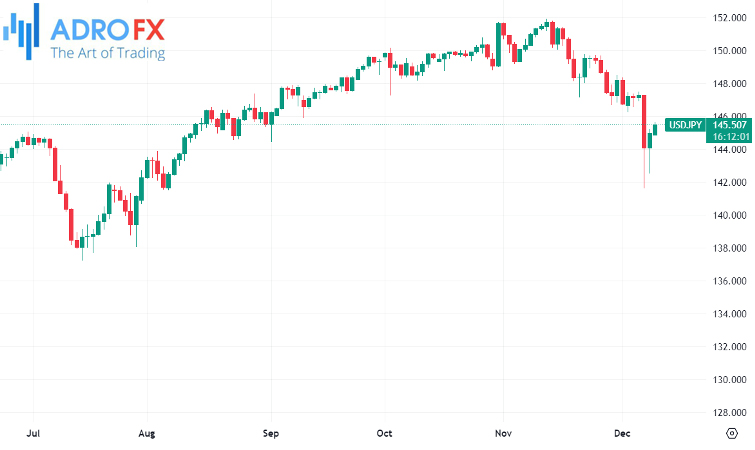
The dollar began the week on a positive note, particularly against the yen, as speculation grew that the Bank of Japan's ultra-low interest rates policy might be nearing its end.
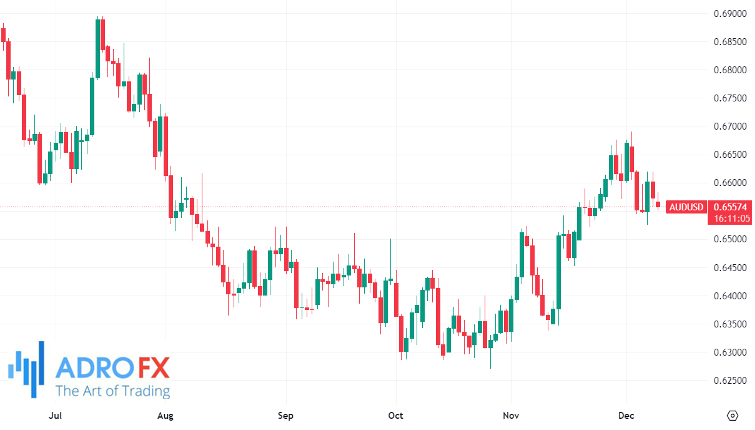
Meanwhile, the Australian Dollar extended its losses for the second consecutive session on Monday. Robust US employment figures on Friday, along with concerns about deflation in China and disappointing Consumer Price Index (CPI) and Producer Price Index (PPI) readings, contributed to a sell-off in the AUD/USD pair. Australia's Reserve Bank Governor, Michele Bullock, is set to deliver a speech on Tuesday, following the RBA's decision to maintain the cash rate at 4.35% in its December meeting. Despite a tightening bias, recent economic indicators suggest a likelihood of no further rate hikes in the near future.
On Friday, the price of gold experienced a notable decline of over 1.5%, reaching a two-week low. The selling pressure persisted into the Asian session on Monday, although it lacked momentum amid ongoing geopolitical uncertainties. Traders appeared hesitant to make bold moves, likely awaiting key data releases and central bank events scheduled for the week.
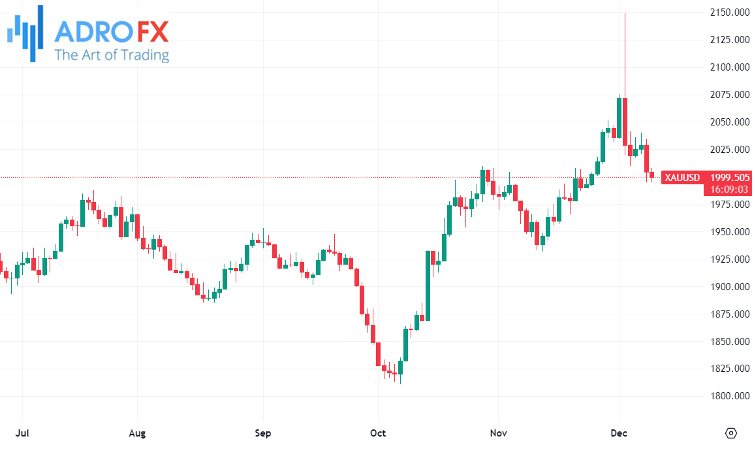
Despite this, XAU/USD has currently settled below the psychologically significant $2,000 mark. Attention is now directed towards a potential shift in the Federal Reserve's stance, seen as a factor that could prevent a more profound correction in gold prices.
In the realm of cryptocurrencies, Bitcoin witnessed a 7.74% drop during the early Asian session, briefly touching the $40,400 level. According to CoinGlass data, this movement led to the liquidation of nearly $200 million worth of positions. As of now, Bitcoin is trading around $42,289, positioned at the midpoint of the 77% crash observed during the previous bear market. This particular level is crucial and could trigger substantial Take Profit actions or sell orders, potentially resulting in widespread market liquidations.
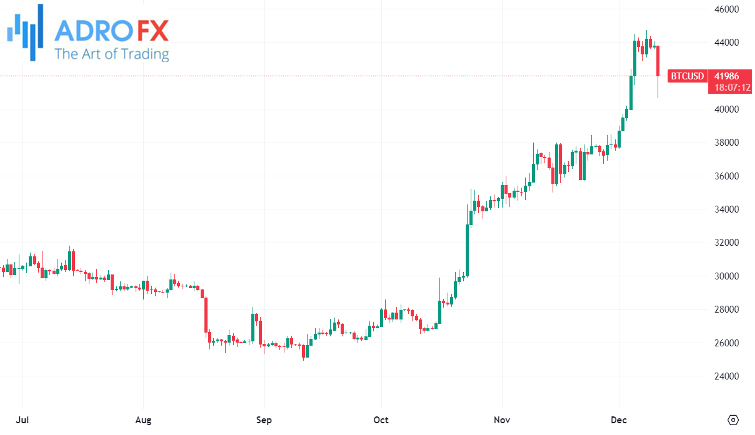
The ongoing struggle between bulls and bears may lead BTC to consolidate at its current level. Drawing comparisons from the price action in the last two market cycles, a significant correction in Bitcoin's price is not anticipated until it approaches the 62% retracement level at $48,733. However, investors are urged to exercise caution given the potential for unexpected market movements that could catch overly optimistic investors off-guard.
Apart from key economic indicators such as inflation data, job numbers, and global PMIs, this week places significant focus on four major central banks - the Federal Reserve, the Swiss National Bank, the Bank of England, and the European Central Bank. Market expectations suggest that all these central banks are likely to maintain their current policy positions without making significant changes.
The dot plot, a graphical representation of where central banks foresee interest rates in the upcoming years, is anticipated to be a crucial aspect this week. While it will provide insights into the central banks' interest rate projections, it won't necessarily indicate when the easing cycle might commence. For a clearer understanding of the timing of potential policy adjustments, market participants will closely scrutinize forecasts and commentary accompanying the dot plot.
The current scenario presents a situation where the Fed's stance could be influenced by the November inflation report. A disappointing report might lead the Fed to uphold its narrative of being prepared to hike interest rates if deemed necessary, casting doubt on the possibility of a rate cut in March. The forecasts and commentary from the central bank will play a pivotal role in shaping market expectations and understanding the nuances of their monetary policy decisions.
Related Articles


Latest updates
Latest updates


Technical Analysis
Latest updates


